

Organotypic whole hemisphere brain slice models to study the effects of donor age and oxygen-glucose-deprivation on the extracellular properties of cortical and striatal tissue
- PMID: 35698088
- PMCID: PMC9195469
- DOI: 10.1186/s13036-022-00293-w
Organotypic whole hemisphere brain slice models to study the effects of donor age and oxygen-glucose-deprivation on the extracellular properties of cortical and striatal tissue
Abstract
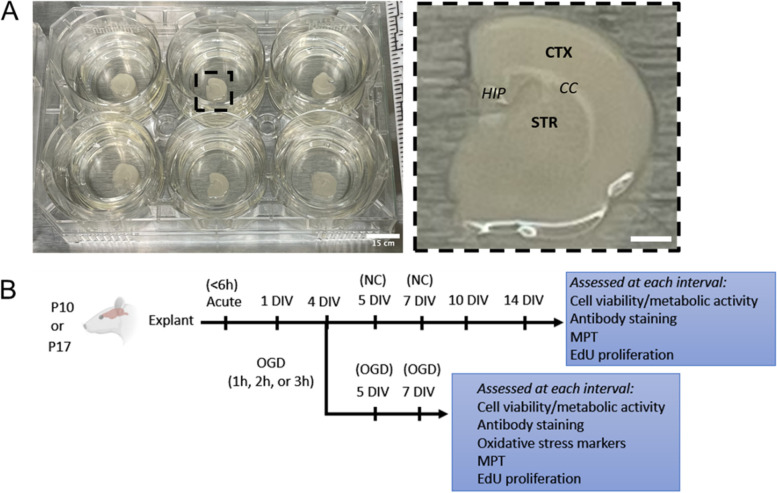
Background: The brain extracellular environment is involved in many critical processes associated with neurodevelopment, neural function, and repair following injury. Organization of the extracellular matrix and properties of the extracellular space vary throughout development and across different brain regions, motivating the need for platforms that provide access to multiple brain regions at different stages of development. We demonstrate the utility of organotypic whole hemisphere brain slices as a platform to probe regional and developmental changes in the brain extracellular environment. We also leverage whole hemisphere brain slices to characterize the impact of cerebral ischemia on different regions of brain tissue.
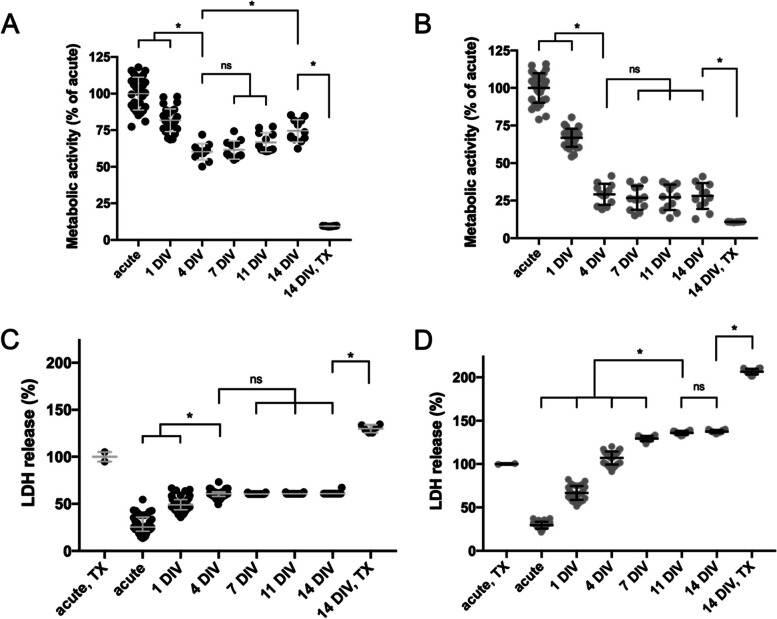
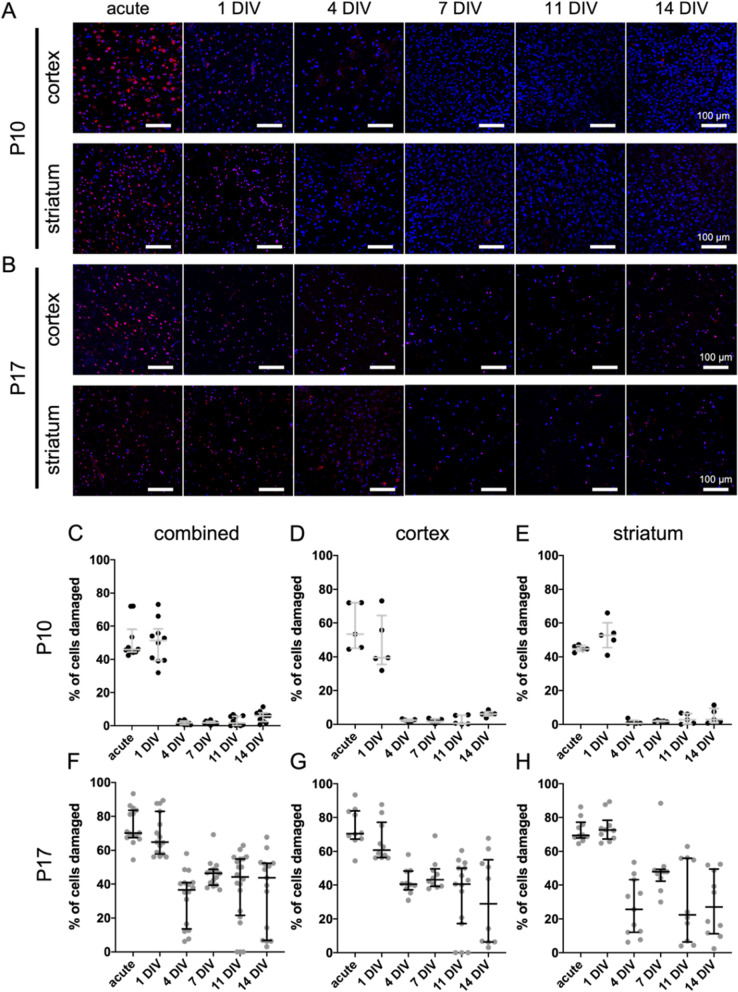
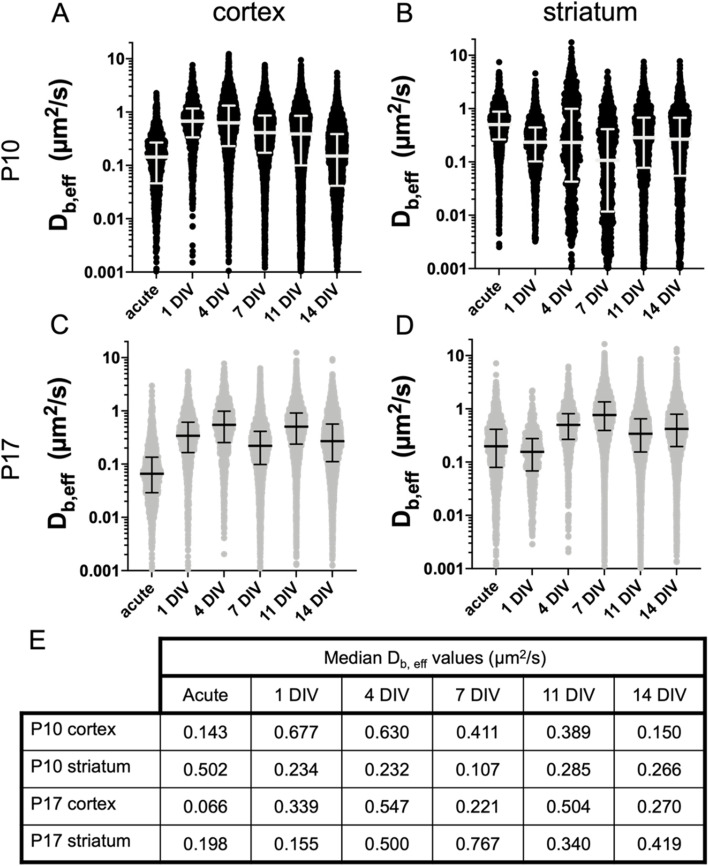
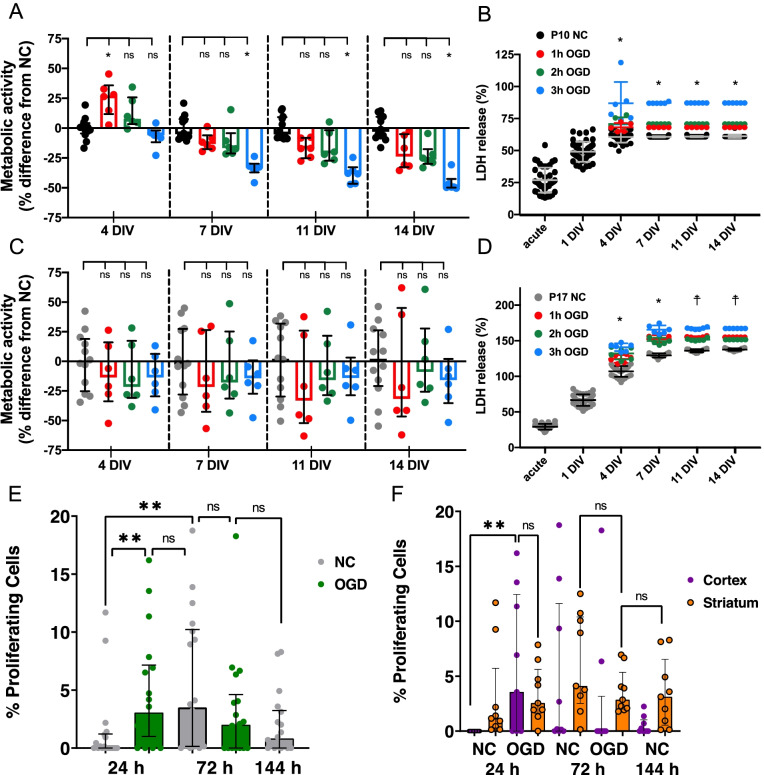
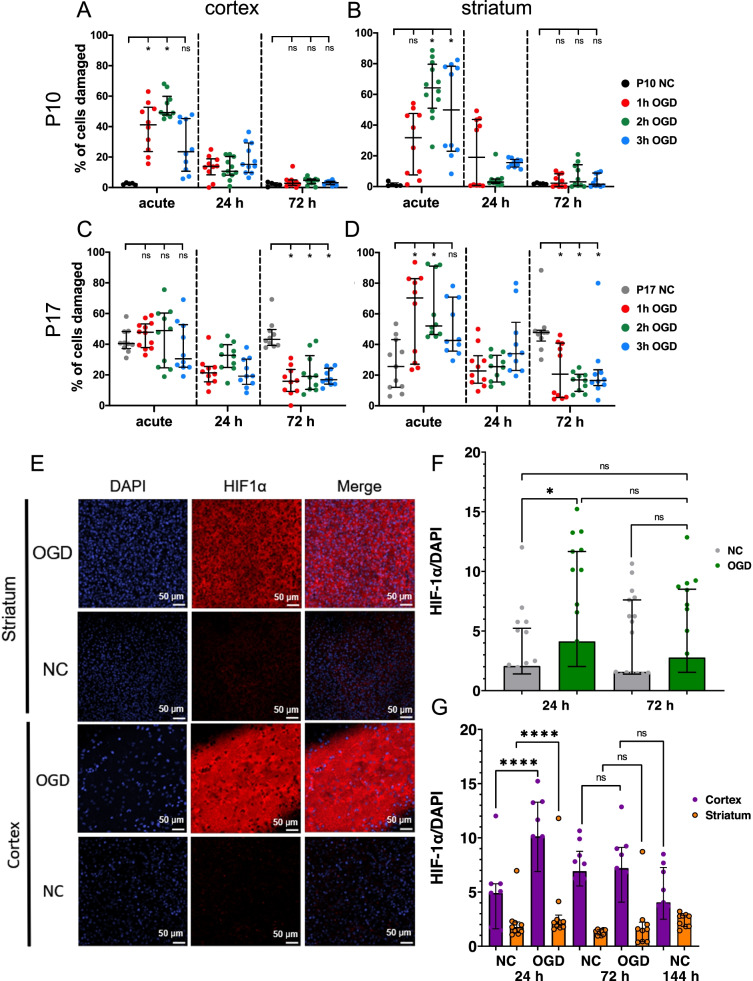
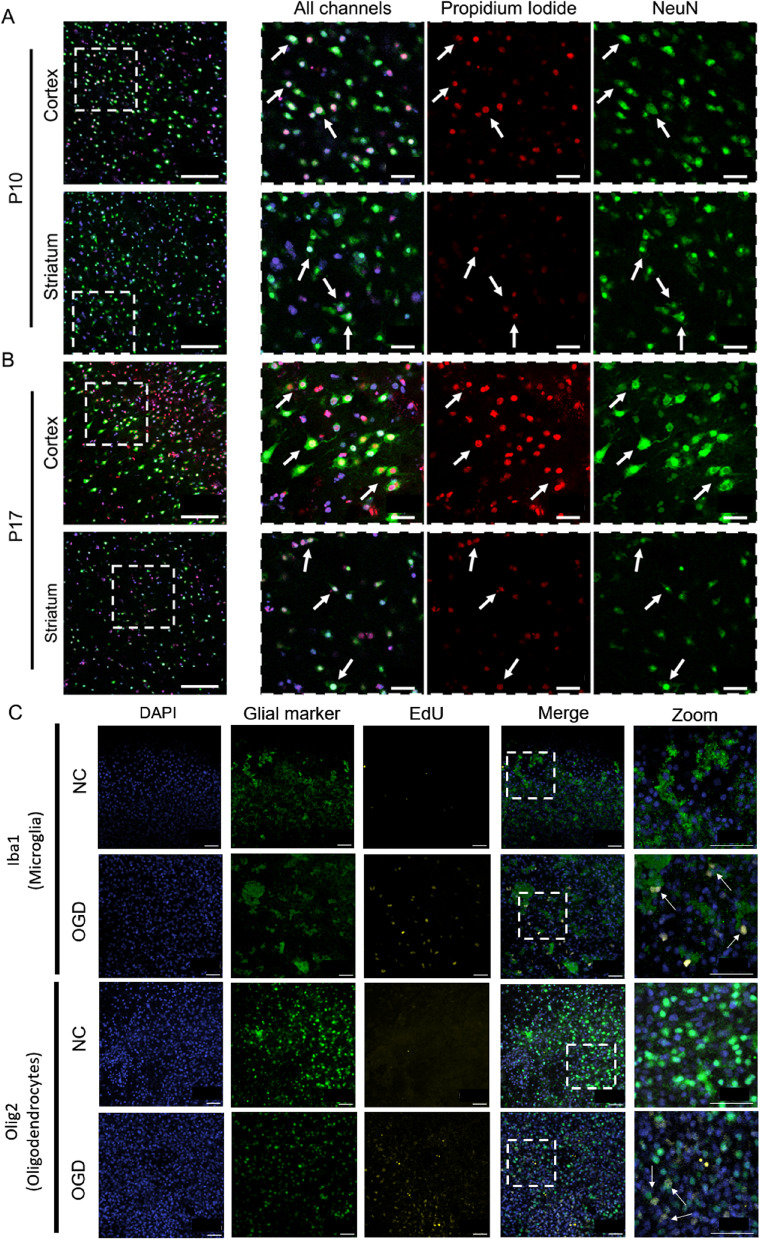
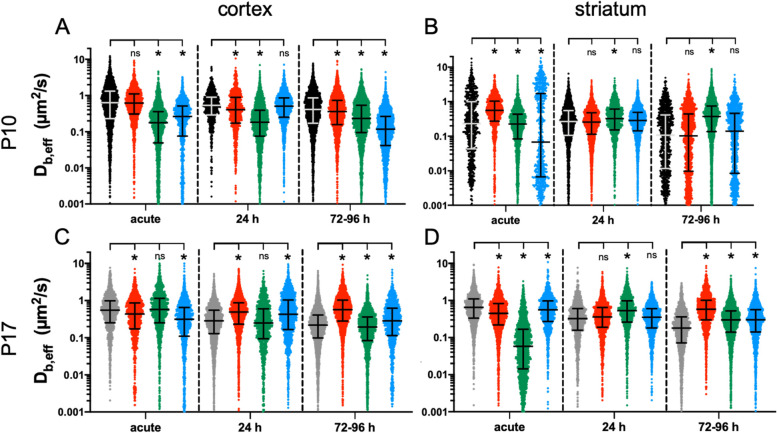
Results: Whole hemisphere brain slices taken from postnatal (P) day 10 and P17 rats retained viable, metabolically active cells through 14 days in vitro (DIV). Oxygen-glucose-deprivation (OGD), used to model a cerebral ischemic event in vivo, resulted in reduced slice metabolic activity and elevated cell death, regardless of slice age. Slices from P10 and P17 brains showed an oligodendrocyte and microglia-driven proliferative response after OGD exposure, higher than the proliferative response seen in DIV-matched normal control slices. Multiple particle tracking in oxygen-glucose-deprived brain slices revealed that oxygen-glucose-deprivation impacts the extracellular environment of brain tissue differently depending on brain age and brain region. In most instances, the extracellular space was most difficult to navigate immediately following insult, then gradually provided less hindrance to extracellular nanoparticle diffusion as time progressed. However, changes in diffusion were not universal across all brain regions and ages.
Conclusions: We demonstrate whole hemisphere brain slices from P10 and P17 rats can be cultured up to two weeks in vitro. These brain slices provide a viable platform for studying both normal physiological processes and injury associated mechanisms with control over brain age and region. Ex vivo OGD impacted cortical and striatal brain tissue differently, aligning with preexisting data generated in in vivo models. These data motivate the need to account for both brain region and age when investigating mechanisms of injury and designing potential therapies for cerebral ischemia.
Keywords: Brain microenvironment; Brain slices; Extracellular; Nanoparticle diffusion; Organotypic; Particle tracking.
© 2022. The Author(s).
Conflict of interest statement
The authors declare that they have no competing interests.
Figures
Similar articles
-
A rotenone organotypic whole hemisphere slice model of mitochondrial abnormalities in the neonatal brain.J Biol Eng. 2024 Nov 14;18(1):67. doi: 10.1186/s13036-024-00465-w. J Biol Eng. 2024. PMID: 39543609 Free PMC article.
-
A novel method for oxygen glucose deprivation model in organotypic spinal cord slices.Brain Res Bull. 2017 Oct;135:163-169. doi: 10.1016/j.brainresbull.2017.10.010. Epub 2017 Oct 17. Brain Res Bull. 2017. PMID: 29054697
-
β-Adrenoceptor activation depresses brain inflammation and is neuroprotective in lipopolysaccharide-induced sensitization to oxygen-glucose deprivation in organotypic hippocampal slices.J Neuroinflammation. 2010 Dec 20;7:94. doi: 10.1186/1742-2094-7-94. J Neuroinflammation. 2010. PMID: 21172031 Free PMC article.
-
Tumor necrosis factor receptor-1 is essential for LPS-induced sensitization and tolerance to oxygen-glucose deprivation in murine neonatal organotypic hippocampal slices.J Cereb Blood Flow Metab. 2009 Jan;29(1):73-86. doi: 10.1038/jcbfm.2008.90. Epub 2008 Aug 27. J Cereb Blood Flow Metab. 2009. PMID: 18728678
-
Organotypic hippocampal slice cultures for studies of brain damage, neuroprotection and neurorepair.Curr Drug Targets CNS Neurol Disord. 2005 Aug;4(4):435-52. doi: 10.2174/1568007054546108. Curr Drug Targets CNS Neurol Disord. 2005. PMID: 16101559 Review.
Cited by
-
A rotenone organotypic whole hemisphere slice model of mitochondrial abnormalities in the neonatal brain.J Biol Eng. 2024 Nov 14;18(1):67. doi: 10.1186/s13036-024-00465-w. J Biol Eng. 2024. PMID: 39543609 Free PMC article.
-
Isolation methods and characterization of primary rat neurovascular cells.J Biol Eng. 2024 Jul 11;18(1):39. doi: 10.1186/s13036-024-00434-3. J Biol Eng. 2024. PMID: 38992711 Free PMC article.
-
Monitoring in real time and far-red imaging of H2O2 dynamics with subcellular resolution.Nat Chem Biol. 2025 Apr 28. doi: 10.1038/s41589-025-01891-7. Online ahead of print. Nat Chem Biol. 2025. PMID: 40295764
-
High-fidelity predictions of diffusion in the brain microenvironment.Biophys J. 2024 Nov 19;123(22):3935-3950. doi: 10.1016/j.bpj.2024.10.005. Epub 2024 Oct 10. Biophys J. 2024. PMID: 39390745
-
Ex vivo study of neuroinvasive and neurotropic viruses: what is current and what is next.FEMS Microbiol Rev. 2025 Jan 14;49:fuaf024. doi: 10.1093/femsre/fuaf024. FEMS Microbiol Rev. 2025. PMID: 40498321 Free PMC article. Review.
References
LinkOut - more resources
Full Text Sources
