. 2022 Jun 7:14:1097-1111.
doi: 10.2147/NSS.S360120. eCollection 2022.

EEG Activation Does Not Differ in Simple and Complex Episodes of Disorders of Arousal: A Spectral Analysis Study

Affiliations

EEG Activation Does Not Differ in Simple and Complex Episodes of Disorders of Arousal: A Spectral Analysis Study

Greta Mainieri et al. Nat Sci Sleep. .

Abstract

Purpose: Disorders of arousal (DoA) are characterized by incomplete awakening from NREM sleep, with the admixture of both deep sleep and wake EEG activity. Previous observations suggested that changes in EEG activity could be detected in the seconds preceding DoA episodes. The aims of this work were to characterize the topography of EEG spectral changes prior to DoA episodes and to investigate whether or not behavioral complexity could be predicted by changes in EEG immediately preceding behavioral onsets.

Patients and methods: We collected 103 consecutive video-polysomnographic recordings of 53 DoA adult patients and classified all episodes as simple, rising and complex arousal movements. For each episode, a 5-second window preceding its motor onset ("pre-event") and a 60-second window from 2 to 3 minutes before the episodes ("baseline") were compared. Subsequently, a between-group comparison was performed for the pre-event of simpler versus the more complex episodes.

Results: Spectral analysis over 325 DoA episodes showed an absolute significant increase prior to DoA episodes in all frequency bands excluding sigma, which displayed the opposite effect. In normalized maps, the increase was relatively higher over the central/anterior areas for both slow and fast frequency bands. No significant differences emerged from the comparison between simpler and more complex episodes.

Conclusion: Taken together, these results show that deep sleep and wake-like EEG rhythms coexist over overlapping areas before DoA episodes, suggesting an alteration of local sleep mechanisms. Episodes of different complexity are preceded by a similar EEG activation, implying that they possibly share a similar pathophysiology.

Keywords: disorders of arousal; neurophysiology; parasomnia; spectral EEG.


Conflict of interest statement

The authors report no conflicts of interest in this work.

Figures
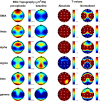
Figure 1
Figure 1
Pre-episode versus baseline. Spectral bands of all DoA episodes analyzed, for each band frequency: slow wave activity or delta (0.5–4 Hz), theta (4–8 Hz), alpha (8–12 Hz), sigma (12–16 Hz), beta (15–25 Hz), and low gamma (25–45 Hz). First column: average NREM sleep EEG topographies across frequency bands during pre-episode. Second column: topographic averages during stable NREM sleep, two to three minutes before the episode. Third column: map showing the individual electrode t-value (two-tailed, paired) maps for the comparison between pre-episode and baseline sleep in terms of absolute power. Red values represent an increase in absolute EEG power and blue values represent a decrease. Fourth column: same as third column except that each subject was spatially normalized using the z-score across electrodes before creating the t-value comparison. White dots belong to significant clusters (P < 0.05) using statistical non-parametric mapping for multi-comparison correction.
Figure 2
Figure 2
SAMs versus RAMs/CAMs. Spectral bands of simple and more complex DoA episodes for each band frequency: slow wave activity or delta (0.5–4 Hz), theta (4–8 Hz), alpha (8–12 Hz), sigma (12–16 Hz), beta (15–25 Hz), and low gamma (25–45 Hz). First column: average NREM sleep EEG topographies across frequency bands during pre-episode in SAMs. Second column: average NREM sleep EEG topographies across frequency bands during pre-episode in RAMs/CAMs. Third column: map showing the individual electrode t-value (two-tailed, unpaired) maps for the comparison between SAMs and RAMs/CAMs in terms of absolute power. Red values represent an increase in absolute EEG power and blue values represent a decrease. Fourth column: same as third column except that each subject was spatially normalized using the z-score across electrodes before creating the t-value comparison. White dots belong to significant clusters (P < 0.05) using statistical non-parametric mapping for multi-comparison correction. Black dots indicate individual channels with P < 0.05 (uncorrected).

References

    1. American Academy of Sleep Medicine. International Classification of Sleep Disorders. 3rd ed. Darien, IL: American Academy of Sleep Medicine; 2014. - PubMed
    1. Blatt I, Peled R, Gadoth N, Lavie P. The value of sleep recording in evaluating somnambulism in young adults. Electroencephalogr Clin Neurophysiol. 1991;78(6):407–412. doi:10.1016/0013-4694(91)90058-c - DOI - PubMed
    1. Zucconi M, Oldani A, Ferini-Strambi L, Smirne S. Arousal fluctuations in non-rapid eye movement parasomnias: the role of cyclic alternating pattern as a measure of sleep instability. J Clin Neurophysiol off Publ Am Electroencephalogr Soc. 1995;12(2):147–154. - PubMed
    1. Kavey NB, Whyte J, Resor SR, Gidro-Frank S. Somnambulism in adults. Neurology. 1990;40(5):749–752. doi:10.1212/wnl.40.5.749 - DOI - PubMed
    1. Derry CP, Harvey AS, Walker MC, Duncan JS, Berkovic SF. NREM arousal parasomnias and their distinction from nocturnal frontal lobe epilepsy: a video EEG analysis. Sleep. 2009;32(12):1637–1644. doi:10.1093/sleep/32.12.1637 - DOI - PMC - PubMed