Functional divergence of the two Elongator subcomplexes during neurodevelopment
- PMID: 35698786
- PMCID: PMC9260213
- DOI: 10.15252/emmm.202115608
Functional divergence of the two Elongator subcomplexes during neurodevelopment
Abstract
The highly conserved Elongator complex is a translational regulator that plays a critical role in neurodevelopment, neurological diseases, and brain tumors. Numerous clinically relevant variants have been reported in the catalytic Elp123 subcomplex, while no missense mutations in the accessory subcomplex Elp456 have been described. Here, we identify ELP4 and ELP6 variants in patients with developmental delay, epilepsy, intellectual disability, and motor dysfunction. We determine the structures of human and murine Elp456 subcomplexes and locate the mutated residues. We show that patient-derived mutations in Elp456 affect the tRNA modification activity of Elongator in vitro as well as in human and murine cells. Modeling the pathogenic variants in mice recapitulates the clinical features of the patients and reveals neuropathology that differs from the one caused by previously characterized Elp123 mutations. Our study demonstrates a direct correlation between Elp4 and Elp6 mutations, reduced Elongator activity, and neurological defects. Foremost, our data indicate previously unrecognized differences of the Elp123 and Elp456 subcomplexes for individual tRNA species, in different cell types and in different key steps during the neurodevelopment of higher organisms.
Keywords: Elongator complex; Elp4; Elp6; neurodevelopment; tRNA modification.
© 2022 The Authors. Published under the terms of the CC BY 4.0 license.
Figures

Anterior and lateral photographs of two patients with ELP6 variants showing dysmorphic features at 20 (Patient 2) and 19 (Patient 3) years of age.
Mid‐sagittal (I), coronal (II) and transversal (III) MRI scans of Patient 1 with newly identified ELP4 variants and Patient 2 and Patient 3 with ELP6 variants. Atrophy of the cerebellum with prominence of the cerebellar folia is marked by circles. Arrows indicate thin corpus callosum, red arrowheads point to enlarged extra‐axial CSF spaces, and black arrowheads to cerebral sulci in keeping with cerebral and cerebellar volume loss.
EEG of Patient 3. Left panel: 1–2 Hz left fronto‐temporal spike and multi‐spike slow wave discharges (Fp1‐F7 and T3‐T5) spread to the homologous same hemisphere and opposite hemisphere, predominantly seen on bipolar montage EEG. Right panel: Spike‐ and multi‐spike slow wave activities together with fast rhythms originating from bilateral fronto‐temporal‐frontocentral regions indicate electrographic seizure activity. Described changes are marked by circles.

Bipolar EEG montage for Patient 1. Left panel: Frequent interictal epileptiform discharges (few examples circled) are seen in the bilateral hemispheres. These occur in non‐evolving runs lasting up to bilateral posterior head regions for seconds. Occasional to intermittent, low‐amplitude, attenuated cerebral activity of electrodecremental episodes (*) without clinical signs are captured. Right panel: A typical electroclinical seizure (*) consisting of arm and leg extension, is captured during the recording. One of the legs may be shaking, possibly due to vibration tonic posturing. Low to medium‐amplitude polyspikes (examples circled) over the bilateral frontal central region followed by high‐amplitude slow waves and low‐amplitude fast waves with muscle artifact (#). The initial polyspikes varied in length and locations. The seizures vary from 6 to 47 s.
EEG of Patient 2. Left panel: Bilateral centroparietal‐parietooccipital multispike‐wave activities and bilateral frontocentral‐frontotemporal sharp‐slow wave discharges occur asynchronously. Right panel: Centroparietal‐parietooccipital (indicated on left) and frontocentral‐frontotemporal (indicated on right) sharp and slow multifocal wave activities occur by forming phase encounters. Described changes are marked by circles.
Pedigree map of the patient with ELP4Y91C/L296I variants. Squares indicate male and circles female family members. Solid symbols mark the affected patient (arrowhead; Patient 1), half‐filled symbols the variant carriers and question marks unknown genotypes.
Pedigree map of the patients with Elp6L118W variants. Squares indicate male and circles female family members. Solid symbols mark the affected patients (arrowheads; Patients 2 and 3), half‐filled symbols the variant carriers and question marks unknown genotypes.

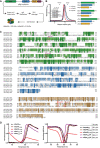
Workflow scheme for Elp456 protein production from insect cell expression system.
SDS–PAGE gel showing the purified human, murine and yeast Elp456 complexes with corresponding gel filtration profiles indicating the estimated elution volume of approximately 200 kDa on the Superose 6 Increase 10/300 GL column (left panel). The schematic overview of Elp4, Elp5, and Elp6 proteins from human, mouse, and yeast with the amino acid length indicated (right panel).
The multisequence alignments of Elp4 (green), Elp5 (blue), and Elp6 (brown) proteins show the evolutionary conservation of amino acid sequences.
Averaged melting curves from thermal shift assay for mElp456 variants with calculated melting temperatures (Tm) (mean ± SD) on the left and their respective first derivative (right panel), n = 3 independent measurements.

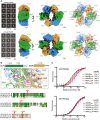
Cryo‐EM analyses of the reconstituted mammalian Elp456 (human—hElp456 and murine—mElp456) complexes. Reference‐free 2D class averages of the human (top) and murine (bottom) Elp456 subcomplexes (left panels, scale bar 100 Å), cryo‐EM maps (middle panels, scale bar 10 Å) and atomic models fit into the cryo‐EM density maps with marked localization of patient‐derived ELP4 and ELP6 mutations (right panels).
Close‐up view of Elp456 atomic models highlighting the positions of the Elp6 (L118—red and L126—brown) and Elp4 (L296/L294—magenta and Y91/Y90—violet) mutations. Elp4 is depicted in green, Elp5 in blue and Elp6 in brown. Mutations are marked on the respective sequence alignments of Elp6 and Elp4 with color‐coded arrows.
Microscale thermophoresis (MST) analysis of Elp456WT and Elp4/6 variants binding to murine (Mm—Mus musculus) tRNAAla UGC (top) or Mm tRNAArg UCU (bottom) with estimated dissociation constant values (Kd) and Kd fitting errors (mean ± SD), n = 3 independent measurements.

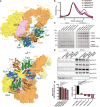
Model of the murine Elongator complex (Elp123456) prepared using cryo‐EM structure of the yeast Elp123456 (yElp123456; PDB:). The [4Fe4S] cluster of Elp3 subunit is indicated by the orange cube. Murine Elp123 (mElp123) domain organization scheme: WD40—beta‐transducin repeat domain; TPR—tetratricopeptide repeat domain; Elp1*—C‐teminal domain of second Elp1 subunit; DD—dimerization domain of two Elp1 subunits (top); CP1/CP2—predicted contact points between Elp123 and Elp456. Murine Elp123456 model with depicted ELP4/6 mutations (bottom). Color code for molecules: mElp1—orange, mElp2—yellow, mElp3—pink, mElp4—green, mElp5—blue, mElp6—brown, Elp4 mutations (L296/L294—magenta and Y91/Y90—violet), Elp6 mutations (L118—red and L126—brown).
Gel filtration profiles from Superose 6 Increase 10/300 GL column for all reconstituted Elp123456 variants.
Pull‐down experiments of the assembled mElp123456 complexes carrying patients‐derived mutations. The mElp123WT subcomplexes were immobilized on the Dynabeads (strep) via Elp3 protein and incubated with the Elp456 variants. The inputs and pull downs were loaded on the SDS–PAGE gels and visualized by Coomassie staining. The molecular mass marker is indicated on the left (M).
Co‐immunoprecipitation analyses of Elongator complexes in patient‐derived fibroblast cell. Whole cell lysates (left) and eluates after immunoprecipitation (right) are shown for control fibroblasts (ctrl) and cultured patient fibroblasts Elp4Y91C/L296I (patient 1); Elp6L118W/L118W (patient 2), Elp6L118W/L118W (patient 3). Used antibodies for immobilization (ELP1) and detection (ELP1, ELP3, ELP4, ELP5, and α‐tubulin) are indicated. n = 4 independent experiments.
Normalized acetyl‐CoA hydrolysis activity assay for mElp123456 variants incubated either without tRNA (left panel) or with human bulk tRNA (right panel). Statistical analysis: one‐way ANOVA (α = 0.05). Statistically significant differences are indicated (*P ≤ 0.05; ****P ≤ 0.0001; ns—not significant), n = 3 independent experiments. Data represent mean ± SD.

High‐performance liquid chromatography (HPLC) coupled to mass spectrometry (MS) used to quantify the Elongator‐dependent tRNA modification 5‐carbamoylmethyluridine (ncm5U) in human fibroblasts. Pseudouridine (Ψ) was used as an internal normalization standard. n = 3 technical repeats per genotype.
HPLC‐MS quantification of Elongator‐dependent tRNA modification 5‐methoxy‐carbonylmethyluridine (mcm5U). Pseudouridine (Ψ) was used as an internal normalization standard. n = 3 technical repeats per genotype.
HPLC‐MS quantification of Elongator‐dependent tRNA modification 5‐methoxycarbonylmethyl‐2‐thiouridine (mcm5s2U). Pseudouridine (Ψ) was used as an internal normalization standard. n = 3 technical repeats per genotype.
HPLC‐MS quantification of Elongator‐independent tRNA modification 1‐methyladenosine (m1A). Pseudouridine (Ψ) was used as an internal normalization standard. n = 3 technical repeats per genotype.
HPLC‐MS quantification of Elongator‐independent tRNA modification 7‐methylguanosine (m7G). Pseudouridine (Ψ) was used as an internal normalization standard. n = 3 technical repeats per genotype.
Differential expression (DE) of peptides in fibroblasts obtained from the individuals with ELP4 and ELP6 variants relative to control (n = 3 technical repeats per genotype). Down‐ (red) and upregulated (blue) peptides are depicted on volcano plots.
A network‐based clustering of enriched pathways in ELP4Y91C/L296I was constructed. Text mining was applied to extract the top terms representing each pathway cluster (left). Network interaction maps are shown (right) with the pathway clusters are marked.
A network‐based clustering of enriched pathways in ELP6L118W/L118W was constructed. Text mining was applied to extract the top terms representing each pathway cluster (left). Network interaction maps are shown (right) and the pathway clusters are marked.

Appearance and quantification of body size and weight of adult (2‐months‐old) heterozygous and homozygous Elp6L118W mice and littermate controls (n = 8 animals per genotype).
Abnormal hindlimb clasping of Elp6L118W animals. n = 6 for wild‐type and Elp6L118W mice; n = 7 for Elp6L118W/+ animals.
Significant effects of the Elp6 mutation on scores for behavioral tests, including body position, spontaneous activity, tremor, ledge test, and grip strength tests. n = 6 for wild‐type and Elp6L118W mice; n = 7 for Elp6L118W/+ animals.
Kaplan–Meier curve of mouse survival (n = 12 per genotype).

Body size of adult (2‐months‐old) Elp2 and Elp6 mutant mice and their littermate controls (n = 6 for wild‐type (DBA2/J and C57BL/6), Elp2H206R, Elp2H206R/R464W, and Elp6L118W animals; n = 5 for Elp6L126Q animals).
Brain weight relative to body weight of adult Elp2 and Elp6 mutant mice and their littermate controls (n = 6 for wild‐type (DBA2/J and C57BL/6), Elp2H206R, Elp2H206R/R464W, and Elp6L118W animals; n = 5 for Elp6L126Q animals).
Abnormal hindlimb clasping of Elp2 and Elp6 mutant animals (n = 6 for wild‐type (DBA2/J and C57BL/6), Elp2H206R, Elp2H206R/R464W, and Elp6L118W animals; n = 5 for Elp6L126Q animals).
Significant effects of Elp2 and Elp6 mutations on scores for behavioral tests, including body position, spontaneous activity, tremor, ledge test, and grip strength tests animals (n = 6 for wild‐type (DBA2/J and C57BL/6), Elp2H206R, Elp2H206R/R464W, and Elp6L118W animals; n = 5 for Elp6L126Q animals).
Kaplan–Meier curve of mouse survival (n = 12 per genotype).

Representative images of Golgi‐Cox‐stained coronal brain sections of adult (2‐months‐old) wild‐type and mutant mice. Rectangles represent somatosensory region containing pyramidal neurons selected for neuron reconstruction and subsequent analyses. Scale bar: 100 μm.
Representative pyramidal neuron basal dendritic tree reconstructions.
Quantification of total dendritic length from dendritic tree reconstructions shown in (B). n = 30; 10 neurons per animal and 3 animals per genotype.
Sholl analysis of the complexity of basal dendritic arbors. n = 30; 10 neurons per animal and 3 animals per genotype.
Representative images of dendritic spines on basal dendrites of the cortical neurons. Quantification of spine density per 10 μm on secondary dendrites is shown (n = 15; 5 neurons per animal and 3 animals per genotype). Scale bar: 10 μm.

Representative images of Golgi‐Cox‐stained brain sections in the hippocampal area of adult (2‐months‐old) wild‐type and mutant mice. Rectangles represent CA1 region containing pyramidal neurons selected for neuron reconstruction and subsequent analyses. Scale bar: 100 μm.
Representative pyramidal neuron basal dendritic tree reconstructions.
Quantification of total dendritic length from dendritic tree reconstructions shown in B. n = 15; 5 neurons per animal and 3 animals per genotype.
Sholl analysis of the complexity of basal dendritic arbors. n = 15; 5 neurons per animal and 3 animals per genotype.
Representative images of dendritic spines on basal dendrites of the cortical neurons. Quantification of spine density per 10 μm on secondary dendrites is shown. n = 15; 5 neurons per animal and 3 animals per genotype. Scale bar: 10 μm.
Representative field EPSP (fEPSP) of wild‐type (blue) and Elp6L118W (red) mice post high‐frequency stimulation (HFS) on hippocampal CA1 to CA3 regions.
Time‐course of long‐term potentiation (LTP) induced by a short tetanus (3 x 100 pulses at 100 Hz; arrow) at hippocampal Schaffer collaterals of mutant and control animals. n = 4 animals per genotype.
Pooled data of the effect of HFS on the fEPSP slope from (G). n = 4 animals per genotype.

High‐performance liquid chromatography (HPLC) coupled to mass spectrometry (MS) used to quantify the Elongator‐dependent tRNA modification 5‐carbamoylmethyluridine (ncm5U) in the brain tissue of adult (2‐months‐old) Elp6L118W relative to wild‐type animals. Pseudouridine (Ψ) was used as an internal normalization standard. n = 3 animals per genotype.
HPLC‐MS quantification of Elongator‐dependent tRNA modification 5‐methoxy‐carbonylmethyluridine (mcm5U). Pseudouridine (Ψ) was used as an internal normalization standard. n = 3 animals per genotype.
HPLC‐MS quantification of Elongator‐dependent tRNA modification 5‐methoxycarbonylmethyl‐2‐thiouridine (mcm5s2U). Pseudouridine (Ψ) was used as an internal normalization standard. n = 3 animals per genotype.
HPLC‐MS quantification of Elongator‐independent tRNA modification 1‐methyladenosine (m1A). Pseudouridine (Ψ) was used as an internal normalization standard. n = 3 animals per genotype.
HPLC‐MS quantification of Elongator‐independent tRNA modification 7‐methylguanosine (m7G). Pseudouridine (Ψ) was used as an internal normalization standard. n = 3 animals per genotype.
Table of comparison of ncm5U and mcm5U levels in the brain tissue of Elp6L126Q and Elp6L118W mice. n = 3 animals per genotype.
References
-
- Addis L, Ahn JW, Dobson R, Dixit A, Ogilvie CM, Pinto D, Vaags AK, Coon H, Chaste P, Wilson S (2015) Microdeletions of ELP4 are associated with language impairment, autism spectrum disorder, and mental retardation. Hum Mutat 36: 842–850 - PubMed
-
- Alizadeh N, Omran S, Birgani M, Mohammadiasl J, Hajjari M (2018) Whole exome sequencing reveals a mutation in ELP2 gene in Iranian family suffering from autosomal recessive mental retardation. J Mol Genet Med 12: 2
Publication types
MeSH terms
Substances
Associated data
- Actions
- Actions
- Actions
- Actions
Grants and funding
LinkOut - more resources
Full Text Sources
Other Literature Sources
Molecular Biology Databases

