Cooperative amyloid fibre binding and disassembly by the Hsp70 disaggregase
- PMID: 35698800
- PMCID: PMC9379549
- DOI: 10.15252/embj.2021110410
Cooperative amyloid fibre binding and disassembly by the Hsp70 disaggregase
Abstract
Although amyloid fibres are highly stable protein aggregates, a specific combination of human Hsp70 system chaperones can disassemble them, including fibres formed of α-synuclein, huntingtin, or Tau. Disaggregation requires the ATPase activity of the constitutively expressed Hsp70 family member, Hsc70, together with the J domain protein DNAJB1 and the nucleotide exchange factor Apg2. Clustering of Hsc70 on the fibrils appears to be necessary for disassembly. Here we use atomic force microscopy to show that segments of in vitro assembled α-synuclein fibrils are first coated with chaperones and then undergo bursts of rapid, unidirectional disassembly. Cryo-electron tomography and total internal reflection fluorescence microscopy reveal fibrils with regions of densely bound chaperones, preferentially at one end of the fibre. Sub-stoichiometric amounts of Apg2 relative to Hsc70 dramatically increase recruitment of Hsc70 to the fibres, creating localised active zones that then undergo rapid disassembly at a rate of ~ 4 subunits per second. The observed unidirectional bursts of Hsc70 loading and unravelling may be explained by differences between the two ends of the polar fibre structure.
Keywords: atomic force microscopy; cryo-electron tomography; disaggregation; molecular chaperones.
© 2022 The Authors. Published under the terms of the CC BY 4.0 license.
Figures

An example video series showing the disaggregation of an αSyn fibre. The time stamp is in hours:minutes:seconds, with the chaperone/ATP mixture added at time 0:00:00. Scale bar, 250 nm. The height (colour) scale is 0 (black) to 26 nm (white), see inset at bottom right, where 0 nm refers to the passivated mica substrate.
Video frames showing key stages of the disaggregation process. Time stamps and scale bar as in (A).
Frames from AFM movie series that show the polar disassembly of αSyn fibres. The white arrows indicate the direction of depolymerisation. Time stamps as above and scale bar 200 nm. The videos are provided as expanded view movies EV1 and EV2.

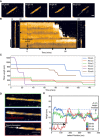
Example segment of an αSyn fibre depolymerised in a rapid “burst”, which removed 111 nm of this fibre (indicated with white marker) within two to three successive video frames (i.e. within 3–4 min). Height (colour) scale 26 nm, as in Fig 1. Scale bar: 50 nm.
A kymograph showing the disaggregation of a single αSyn fibre: (i) The first frame of an atomic force microscopy (AFM) video series of disaggregation. Scale bar: 50 nm. (ii) Kymograph showing a height profile that is aligned to the fibre shown in A (white dotted line) as a function of time (horizontal axis of kymograph). Zero minutes is defined as the first frame recorded after the chaperones were injected into the solution. The white arrows indicate depolymerisation events. (iii) The same, now largely disaggregated, αSyn fibre as shown in A, at the end of the movie.
Lengths of individual fibres plotted as a function of time through disaggregation reactions as imaged by AFM. Traces are shown for a subset of six fibres, each in a different colour, from four independent experiments.
Disaggregation videos that show that a local height increase of αSyn fibres precedes depolymerisation. Zero time here refers to the latest frame before changes to the fibre were observed. Height (colour) scale: 21 nm, see Fig 1. Scale bar: 50 nm.
Height profiles along the dashed lines in D showing the changes to αSyn fibres during disaggregation. The green trace was taken immediately before the increase in fibre height, and shows the undulations in fibre height due to its helical structure. The blue trace was recorded approximately 2 min after the change in fibre height (green trace), and it shows this height increase at the left‐hand end of the fibre. After about 17 min from the initial height change, the red trace shows the removal of the fibre over the same region that was previously elevated.
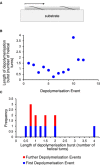
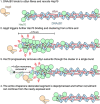
The chaperone binding sites are on the flexible αSyn termini, which are expected to follow the helical path of the fibre structure.
We examined whether local attachment to the substrate might arrest disaggregation and account for the burst‐like depolymerisation events observed by AFM. No such relationship is evident between the helical repeat and the positions where disaggregation is arrested.
The length of the first disaggregated segment is not less on average than that of subsequently disaggregated segments.

- A–C
The small and uniform height increase preceding a depolymerisation burst does not resemble local detachment from the mica. Local detachment from the mica would not result in a uniform height increase as in A, but would cause increasing mobility of the segment with distance from the detachment point, and a corresponding loss of imaging resolution (B). Dense chaperone binding over the elevated region (C) remains the only plausible explanation accounting for the AFM observations.
- A, B
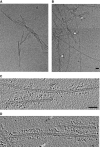
Representative cryo EM images of αSyn fibres alone (A), αSyn fibres incubated with Hsc70/DNAJB1/Apg2/ATP (B). White arrowheads show sites of decoration.
- C
Tomogram section of fibres incubated with Hsc70, DNAJB1 and ATP. Small clusters are interspersed with sparse decoration.
- D
Tomogram section of fibres incubated with Hsc70, DNAJB1, Apg2 and ATP, showing extended stretches of densely clustered chaperones. The two‐protofilament structure of the fibres is evident, but the flexible αSyn N‐ and C‐terminal tails that contain the chaperone binding sites are not discernible.

- A
Binding assay for Hsc70 binding in the presence of WT DNAJB1: control of DNAJB1/Hsc70, αSyn fibres + DNAJB1/Hsc70, αSyn fibres + DNAJB1/Hsc70/Apg2, control of DNAJB1/Hsc70/Apg2. The ‘*’ highlights the condition where an increase of Hsc70 in the bound fraction is observed. P, pellet; S, supernatant. The amount of Hsc70 recruited to the fibres is shown in the pellet fractions.
- B
Binding assay for Hsc70 binding in the presence of the truncated ΔJ‐DNAJB1, lacking the J domain. The gel layout is similar to the previous one with ΔJ‐DNAJB1 replacing WT DNAJB1. Both Apg2 and J domain are required for enhancement of Hsc70 binding.
- C
Histogram of Hsc70 bound fraction in each sample (N = 3 independent experiments, WT: WT DNAJB1, ΔJ: ΔJ‐DNAJB1 mutant, ‐Apg2: condition with fibres + DNAJB1/Hsc70, +Apg2: condition with fibres + DNAJB1/Hsc70/Apg2). A 2‐way ANOVA was performed with Tukey’s multiple comparisons test (**P = 0.003; ****P < 0.0001). Mean Hsc70 binding values with SD are shown.
- D
Total internal reflection fluorescence microscopy images of the labelled αSyn fibres and Hsc70 in the absence or in the presence of Apg2. Scale bar, 1 µm.
- E, F
Quantitation of fluorescence intensity of Hsc70 (E) and αSyn (F) in the two conditions (+/− Apg2, N = 3 independent experiments, n = 65 fibres). Mean Hsc70 and αSyn fluorescence intensities with SD are shown.
- G
Quantitation of differences in Hsc70 binding between the two ends of the fibres, normalised to the local αSyn intensity, in the absence and presence of Apg2 (N = 3 independent experiments, n = 54 fibres). Mean Hsc70 fluorescence intensities with SD are shown.

- A–C
In negative stain images, chaperone binding appeared as a pronounced increase in fibre thickness, visible when comparing images of αSyn samples alone to those incubated with Hsc70/DNAJB1/Apg2. (A) αSyn fibres alone; (B) fibres + Hsc70/DNAJB1/Apg2/ATP; (C) fibres + Hsc70/ΔJ‐DNAJB1/Apg2/ATP. Scale bar, 50 nm.
- A, B
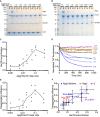
Binding assay with different dilutions of Apg2 incubated with DNAJB1/Hsc70 and (A) with αSyn fibres or (B) without αSyn fibres (control). 5‐mM ATP was present in the buffer throughout.
- C
Plot showing Hsc70 binding as a function of Apg2:Hsc70 molar ratio (N = 3 independent experiments). The action of Apg2 in recruiting Hsc70 to the fibres saturates at a molar ratio of Apg2:Hsc70 of 1:10. The curve indicates the mean Hsc70 binding values.
- D
Disaggregation activity measured by Thioflavin T fluorescence shows the same dependence on Apg2 as binding assays. High Apg2 (1:2 molar ratio) makes disaggregation less efficient, possibly by prematurely releasing Hsc70.
- E
Quantification of the disaggregation efficiency as a function of Apg2:Hsc70 molar ratio (N = 3 independent experiments). The disaggregation efficiency was determined by taking the values from the final hour of the assay curves in (D). The curve indicates the mean efficiency values.
- F
Plot showing the linear correlation between disaggregation activity and Hsc70 binding. Including the data point without Apg2 did not change the correlation coefficient, which remained at 0.967. In contrast, including the highest Apg2 concentration (Apg2:Hsc70 molar ratio of 1:2) reduced the correlation coefficient to 0.904. Mean values with SD are shown.


Similar articles
-
Stepwise recruitment of chaperone Hsc70 by DNAJB1 produces ordered arrays primed for bursts of amyloid fibril disassembly.Commun Biol. 2025 Mar 30;8(1):522. doi: 10.1038/s42003-025-07906-2. Commun Biol. 2025. PMID: 40159506 Free PMC article.
-
Human Hsp70 Disaggregase Reverses Parkinson's-Linked α-Synuclein Amyloid Fibrils.Mol Cell. 2015 Sep 3;59(5):781-93. doi: 10.1016/j.molcel.2015.07.012. Epub 2015 Aug 20. Mol Cell. 2015. PMID: 26300264 Free PMC article.
-
Truncation-Driven Lateral Association of α-Synuclein Hinders Amyloid Clearance by the Hsp70-Based Disaggregase.Int J Mol Sci. 2021 Nov 30;22(23):12983. doi: 10.3390/ijms222312983. Int J Mol Sci. 2021. PMID: 34884786 Free PMC article.
-
Unzipping the Secrets of Amyloid Disassembly by the Human Disaggregase.Cells. 2021 Oct 14;10(10):2745. doi: 10.3390/cells10102745. Cells. 2021. PMID: 34685723 Free PMC article. Review.
-
Structural-functional relevance of DNAJBs in protein aggregation and associated neurodegenerative diseases.Biochim Biophys Acta Proteins Proteom. 2025 Jul 1;1873(4):141074. doi: 10.1016/j.bbapap.2025.141074. Epub 2025 Apr 18. Biochim Biophys Acta Proteins Proteom. 2025. PMID: 40254275 Review.
Cited by
-
Early steps of protein disaggregation by Hsp70 chaperone and class B J-domain proteins are shaped by Hsp110.Elife. 2024 Oct 15;13:RP94795. doi: 10.7554/eLife.94795. Elife. 2024. PMID: 39404743 Free PMC article.
-
Stepwise recruitment of chaperone Hsc70 by DNAJB1 produces ordered arrays primed for bursts of amyloid fibril disassembly.Commun Biol. 2025 Mar 30;8(1):522. doi: 10.1038/s42003-025-07906-2. Commun Biol. 2025. PMID: 40159506 Free PMC article.
-
Spatiotemporal resolution in high-speed atomic force microscopy for studying biological macromolecules in action.Microscopy (Oxf). 2023 Apr 6;72(2):151-161. doi: 10.1093/jmicro/dfad011. Microscopy (Oxf). 2023. PMID: 36744614 Free PMC article. Review.
-
Simple model systems reveal conserved mechanisms of Alzheimer's disease and related tauopathies.Mol Neurodegener. 2023 Nov 10;18(1):82. doi: 10.1186/s13024-023-00664-x. Mol Neurodegener. 2023. PMID: 37950311 Free PMC article. Review.
-
Identification of a HTT-specific binding motif in DNAJB1 essential for suppression and disaggregation of HTT.Nat Commun. 2022 Aug 10;13(1):4692. doi: 10.1038/s41467-022-32370-5. Nat Commun. 2022. PMID: 35948542 Free PMC article.
References
-
- DePace AH, Weissman JS (2002) Origins and kinetic consequences of diversity in Sup35 yeast prion fibers. Nat Struct Biol 9: 389–396 - PubMed
-
- Faust O, Abayev‐Avraham M, Wentink AS, Maurer M, Nillegoda NB, London N, Bukau B, Rosenzweig R (2020) HSP40 proteins use class‐specific regulation to drive HSP70 functional diversity. Nature 587: 489–494 - PubMed
Publication types
MeSH terms
Substances
Grants and funding
LinkOut - more resources
Full Text Sources
Miscellaneous

