A multifunctional locus controls motor neuron differentiation through short and long noncoding RNAs
- PMID: 35698802
- PMCID: PMC9251839
- DOI: 10.15252/embj.2021108918
A multifunctional locus controls motor neuron differentiation through short and long noncoding RNAs
Abstract
The transition from dividing progenitors to postmitotic motor neurons (MNs) is orchestrated by a series of events, which are mainly studied at the transcriptional level by analyzing the activity of specific programming transcription factors. Here, we identify a post-transcriptional role of a MN-specific transcriptional unit (MN2) harboring a lncRNA (lncMN2-203) and two miRNAs (miR-325-3p and miR-384-5p) in this transition. Through the use of in vitro mESC differentiation and single-cell sequencing of CRISPR/Cas9 mutants, we demonstrate that lncMN2-203 affects MN differentiation by sponging miR-466i-5p and upregulating its targets, including several factors involved in neuronal differentiation and function. In parallel, miR-325-3p and miR-384-5p, co-transcribed with lncMN2-203, act by repressing proliferation-related factors. These findings indicate the functional relevance of the MN2 locus and exemplify additional layers of specificity regulation in MN differentiation.
Keywords: competing endogenous RNA; long noncoding RNAs; microRNAs; motor neuron differentiation; single-cell RNA sequencing.
© 2022 The Authors. Published under the terms of the CC BY NC ND 4.0 license.
Figures

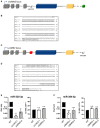
Directed MN differentiation of mESCs carrying a Hb9::GFP transgene. Timeline showing the days of treatment (green blocks) and the differentiation stages. Time‐points relevant in this study are highlighted: mESC (day0), MN‐committed EB (day6, EB6), and mature neural population cultured for 14 days after EB6 dissociation (DIV14).
qRT‐PCR analysis of cell type‐specific markers along MN differentiation: Nanog (mESC), Pax6 (MN progenitors), Hb9, and ChAT (postmitotic MNs). Differentiation stages (mESC and EB at specific maturation days) are indicated below. Expression peaks are set as 1. Expression levels (fold relative to the peak) are normalized over Atp5o mRNA.
5330434G04Rik locus (here renamed as lncMN2) as visualized by the Ensembl genome browser. The lncRNA splicing isoforms and the embedded miR‐325‐3p and miR‐384‐5p are shown.
qRT‐PCR analysis of lncMN2‐202/203/204 isoforms (left), miR‐325‐3p and miR‐384‐5p (right) along MN differentiation. Data are normalized over Atp5o mRNA levels (for lncRNA isoform quantification) or over snoRNA U25 (for miRNA quantification).
qRT‐PCR analysis of lncMN2‐203 and lncMN2‐202/204 isoform in nuclear and cytoplasmic RNA extracts from EB6. Gapdh and snoRNA U25 are used as fractionation controls. Normalizations were performed on the total amount of RNA. Data, which are expressed as mean (error bars represent SD), represent the subcellular fraction of each target RNA over its total expression level. N = 3 biological replicates., *P ≤ 0.05, **P ≤ 0.01, n.s. > 0.05 (two‐tailed, unpaired Student’s t‐test).
Block‐and‐line model of the genome‐editing strategy to inhibit lncMN2 transcription. Schematic representation of the donor vector is shown. Homology arms (HAL and HAR) poly(A)/2×MAZ cassette (PAS) selection cassette (RFP‐T2A‐Puro‐PolyA) and LoxP sites are indicated. Cells were transfected with Cre recombinase to remove the selection cassette.

Block‐and‐line model of lncMN2 gene structure. Exons specific for lncMN2‐202/204 isoforms are in yellow; lncMN2‐203‐specific exon is in blue. Shared exons are gray. miR‐325 and miR‐384 are represented as red and green blocks, respectively.
qRT‐PCR expression analysis of lncMN2 isoforms (left panel) and embedded miRNAs (right panel) in mESC and EBs differentiated for 6 days (EB6). Data, that are expressed as mean (error bars represent SD), were normalized over Atp50 mRNA (left) and snoRNA U25 (right) levels and reported as RNA fold over the control (mESC), set as 1. N = 3 biological replicates.
qRT‐PCR expression analysis of lncMN2‐202/203/204 isoforms (left panel), miR‐325‐3p (middle panel), and miR‐384‐5p (right panel) in WT, KO1, and KO2 EB6. Details as in B.
Cytofluorimetric analysis of cells from dissociated EB6. The left diagram reports the distribution of cells (percentage of the peak) according to GFP levels, from WT (gray), KO1 (orange), and KO2 (blue) EB. In the histogram aside, the percentage of GFP+ cells in WT, KO1, and KO2 is reported. Data are expressed as mean and error bars represent SD. N = 3 biological replicates.
Left: representative immunofluorescence of the MN marker Isl1 (red signals) in cells maintained in vitro for 14 days after EB6 dissociation (DIV14). DAPI counterstaining in blue. Scale bar = 100 µm. Right: box plot shows the distribution of Isl1+ nuclei with respect to the total cell number marked with DAPI staining in WT and in lncMN2 KO mutants (clone 1 and clone 2). Data are expressed as mean and error bars represent SD. The central band represents the median and the whiskers represent the distribution that goes from the minimum value to the lower quartile and from the upper quartile to the maximum value. N = 3 biological replicates and 10 fields were analyzed for each replicate.

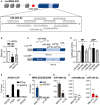
Block‐and‐line model of miR‐325 deletion in lncMN2 gene. The deleted region is indicated as ∆miR‐325. Further details as in Fig 1A.
Alignments of lncMN2‐203 WT (Seq_2) and ∆325 (Seq_1) sequences highlight a 124‐bp‐long genomic deletion.
Block‐and‐line model of miR‐384 deletion in lncMN2 gene. The deleted region is indicated as ∆miR‐384. Further details as in Fig 1A.
Alignments of lncMN2‐203 WT (Seq_2) and ∆384 (Seq_1) sequences highlight a 215‐bp‐long genomic deletion.
Left panel. qRT‐PCR expression analysis of miR‐325‐3p in ∆325 mESCs (clones 1 and 2) differentiated for 6 days (EB6). Data, which are expressed as mean (error bars represent SD), are normalized over snoRNA U25 levels and reported as RNA fold over the control (WT EBs), set as 1. Right panel. Percentage of GFP+ cells (MNs) in WT and ∆325 (clones 1 and 2) upon cytofluorimetric analysis of cells from dissociated EB6. N = 3 biological replicates.
Left panel. qRT‐PCR expression analysis of miR‐384‐5p in ∆384 mESCs (clones 1 and 2) differentiated for 6 days (EB6). Data, which are expressed as mean (error bars represent SD), are normalized over snoRNA U25 levels and reported as RNA fold over the control (WT EBs), set as 1. Right panel. Percentage of GFP+ cells (MNs) in WT and ∆384 (clones 1 and 2) upon cytofluorimetric analysis of cells from dissociated EB6. N = 3 biological replicates.

- A
Block‐and‐line model of the lncMN2‐203 structure. Details as in Fig 1A. The miRNA‐interacting region in exon5 (dark blue) is represented as a light blue block. Sequences of lncMN2‐203 predicted miRNA‐binding sites and of miR‐466i‐5p (above) or miR‐669a‐5p (below) are indicated in the textbox.
- B
qRT‐PCR expression analysis of miR‐466i‐5p and miR‐669a‐5p in mESC and EB6. Data, which are expressed as mean (error bars represent SD), are normalized over snoRNA U25 levels and reported as RNA fold over the control (mESC), set as 1. N = 3 biological replicates.
- C
Schematic representation of the luciferase‐based reporter constructs. 1,500 bps of WT lncMN2‐203 exon5 (dark blue) was cloned downstream to the Renilla luciferase ORF, represented in gray (Luc‐WT). The predicted miRNA‐binding region is light blue. In the ∆SP mutant (Luc‐∆SP), a 260 bp deletion was introduced. As indicated, each construct was co‐transfected with LNAs targeting miR‐466i‐5p or miR‐669a‐5p.
- D
Quantification of Renilla luciferase activity in NSC‐34 cells co‐transfected with the Luc‐WT or the Luc‐∆SP construct and LNA against miR‐466i‐5p or miR‐669a‐5p. The histogram represents the mean luciferase activities (error bars represent SD) folded over the control, set as 1 (basal activity from the Luc‐WT in the presence of scrambled LNA). N = 3 biological replicates.
- E
Ago2 cross‐linked RNA immunoprecipitation assay performed on total extracts from WT EB6. qRT‐PCR quantification of lncMN2 enrichments (isoform −203 or −202/204) in the IP and IgG samples, relative to the input is shown. Ptbp1 and Gapdh mRNAs were used as positive and negative controls, respectively. Values are expressed as input percentages and error bars represent SD. N = 3 technical replicates.
- F–I
RNA pull‐down assay performed on total extracts from differentiated WT EB6. qRT‐PCR quantification of lncMN2‐203 (F), miR‐466i‐5p (G), miR‐669a‐5p (H) or miR‐325‐3p (I) enrichments in the lncMN2‐203 specific (MN2) or in the control (U1) pull‐down samples. Values are expressed as input percentages and error bars represent SEM. N = 3 biological replicates.

Left: LncMN2‐203 secondary structure as predicted by the Mfold. Right: Magnification of the miRNA‐binding region.
Western blot analysis of Ago2 immunoprecipitation from CLIP assay performed on EB6 total extracts. Immunodetection of Ago2 in Input (Inp) and immunoprecipitated (IP) protein fractions is shown.
RNA pull‐down assay performed on total extracts from differentiated WT EB6. qRT‐PCR quantification of U1 enrichment in the lncMN2‐203‐specific (MN2) or in the control (U1) pull‐down samples. Values are expressed as input percentages, and error bars represent SEM. N = 3 biological replicates.

Block‐and‐line model of the lncMN2 edited locus. Details as in Figs 1A and 2A. Predicted miRNA‐binding site deletion is represented as ∆SP.
qRT‐PCR expression analysis of lncMN2‐203 isoform, lncMN2‐202/204, miR‐325‐3p, and miR‐384‐5p embedded miRNAs in WT, ∆SP1, and ∆SP2 EB6. Data, which are expressed as mean (error bars represent SD), are normalized over Atp5o mRNA levels (for lncRNA isoform quantification) or over snoRNA U25 levels (for miRNA quantification) and are reported as RNA fold over the control (mESC), set as 1. N = 3 biological replicates.
Cytofluorimetric analysis of cells from dissociated EB6. The right diagram reports the cell distribution (percentage of the peak) according to GFP levels, from WT (gray line), ∆SP1 (purple line), and ∆SP2 (blue line) EB6. In the histogram aside, the percentage of GFP+ cells in WT, ∆SP1, and ∆SP2 is reported. Data are expressed as mean, and error bars represent SD. N = 3 biological replicates.
Left: representative immunofluorescence of the MN marker Isl1 (red signals) in cells maintained in vitro for 14 days after EB6 dissociation (DIV14). DAPI counterstaining in blue. Scale bar = 100 µm. Right: box plot shows the distribution of Isl1+ nuclei with respect to the total cell number marked with DAPI staining in WT and in ∆SP mutants (clone 1 and clone 2). The central band represents the median, and the whiskers represent the distribution that goes from the minimum value to the lower quartile than from the upper quartile to the maximum value. N = 3 biological replicates and 10 fields were analyzed for each replicate.

Left: UMAP plot of the integrated dataset depicting cell identity assignment to NP (violet dots), MNP (green dots), EMN (orange dots), LMN (red dots), IN (light blue), or NA (gray dots) subpopulations; Right: UMAP plot of the integrated dataset depicting cell identity assignment to proliferating (blue dots) or postmitotic (red dots) subpopulations.
Single‐cell expression of marker genes over the UMAP representation of the integrated dataset.
UMAP and related cell density plot of the whole dataset with Monocle software trajectory. The WT, ∆SP, and KO samples are shown in red, green, and blue, respectively.
Dot plot generated by the Seurat DotPlot function represents the expression of cell identity markers (listed on the left) for each identified subpopulations in every condition (WT, ∆SP and KO). Genes used for the assignment of cluster identity are marked in red. Dataset conditions and cell types are indicated on the bottom.

UMAP visualization plots for WT2 (1,435 cells), ∆SP1 (2,039 cells), and KO1 (1,955 cells) produced by Monocle3 (Trapnell et al, 2014). The plots present the estimated trajectories (dark gray), and the colors correspond to the cell identity: neural precursors NP cells (purple), motor neurons progenitors (MNP, green), early motor neurons (EMN, orange), late motor neurons (LMN, red), and interneurons (IN, light blue). The cells not assigned to any of the previous groups (NA) are indicated in gray.
Histograms reporting the percentage of cells detected as proliferating and postmitotic (Dataset EV1). All percentages of cells were calculated, for each condition, on samples belonging to the same batch (WT2, ∆SP1, ∆SP2, KO1, and KO2) excluding not assigned cells. The significance of cell subpopulation differences between WT and mutants was calculated with the Fisher's exact test (see Materials and Methods). *P < 0.05, **P < 0.01, ***P < 0.001, n.s. > 0.05; N = 2 biological replicates.
Histograms reporting the percentage of cells assigned to NP, MNP, EMN, LMN, and IN (Dataset EV1). All percentages of cells were calculated, for each condition, on samples belonging to the same batch (WT2, ∆SP1, ∆SP2, KO1, and KO2) excluding not assigned cells. The significance of cell subpopulation differences between WT and mutants was calculated with the Fisher's exact test (see Materials and Methods). *P < 0.05, **P < 0.01, ***P < 0.001, n.s. > 0.05. N = 2 biological replicates.
Heatmap generated by the Seurat DoHeatmap function (Stuart et al, 2019) represents the expression of cell identity markers (listed on the left) for each cell of the identified subpopulations. Genes used for the assignment of cluster identity are marked in red. Dataset samples are indicated on the top. Red represents the maximum expression value, light blue the minimum.

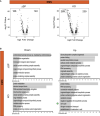
Volcano plots representing differentially expressed genes between WT MNP and ∆SP MNP (left) and WT MNP and KO MNP (right). Each dot represents a gene; −log10 P value is represented in y‐axis while average log2FC in x‐axis. Significantly deregulated genes are depicted as black dots.
Volcano plots representing differentially expressed genes between WT LMN and ∆SP LMN (left) and WT LMN and KO LMN (right). Each dot represents a gene. −log10 P‐value is represented in y‐axis while average log2FC in x‐axis. Significantly deregulated genes are depicted as black dots.
GO‐enriched categories in MNP related to downregulated (left) and upregulated (right) genes in ∆SP (top) and KO (bottom) mutants. Green dots indicate “cell cycle” category.
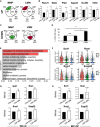
Bar plot representing the number of “cell cycle”‐related genes upregulated in both ∆SP and KO MNP (light green) or specifically in either one of the two mutants (dark green).
GO‐enriched categories in LMN cells related to downregulated (left) and upregulated (right) genes in ∆SP (top) and KO (bottom) mutants. Red dots indicate “nervous system development” category.
Bar plot representing the number of “nervous system development”‐related genes downregulated in both ∆SP and KO (dark red) or specifically in either one of the two mutants (light red).

Volcano plots representing differentially expressed genes between WT EMN and ∆SP EMN (left) and WT EMN and KO EMN (right). Each dot represents a gene. ‐log10 P‐value is represented in y‐axis while average log2FC in x‐axis. Significantly deregulated genes are depicted as black dots.
GO‐enriched categories in EMN related to downregulated (left) and upregulated (right) genes in ∆SP (top) and KO (bottom) mutants. Green dots indicate “cell cycle” category.

Venn diagram showing the relationships between genes upregulated in KO and ΔSP mutants. Gene numbers and percentages of overlap are shown below diagrams for both groups. The intersection between miR‐325‐3p and miR‐384‐5p predicted targets and genes specifically upregulated in KO mutants are indicated in green (MNP, left) or in red (LMN, right).
qRT‐PCR expression analysis of Fbxw11, H2afz, and Phb2 in NSC‐34 transfected with miR‐325‐3p LNA and Sapcd2, Suv39h, and Tdrkh in NSC‐34 transfected with miR‐384‐5p LNA. Data, which are expressed as mean (error bars represent SD), are normalized over Atp5o mRNA levels and reported as RNA fold over the control (scrambled LNA, CTRL), set as 1. N = 3 biological replicates.
Venn diagram showing the relationships between genes downregulated in KO and ∆SP mutants. Gene numbers and percentages of overlap are shown below diagrams for both groups. The intersection between miR‐466i‐5p‐predicted targets and genes downregulated in both mutants are indicated in the MNP (left) and LMN (right) subpopulations as the green and red area, respectively.
Bar plot depicting for each analyzed cell subpopulation (MNP, EMN, and LMN) the percentage of miR‐466i‐5p targets among genes downregulated in both ∆SP and KO mutants. Statistical significance was assessed using the Fisher's exact test. *P ≤ 0.05, **P ≤ 0.01, n.s. > 0.05.
Bar plot depicting the ratio of miR‐466i‐5p predicted targets (x‐axis) in GO‐enriched categories of genes downregulated in both ∆SP LMN and KO LMN. Neural categories (“modulation of chemical synaptic transmission” and "nervous system development”) are colored in red. GO enrichment analysis was performed using WebGestalt software.
Violin plots representing for each condition (WT, ∆SP, and KO) the expression of Scrt1, Ncan, Nrxn1, and Snap25 in LMN. Plots were produced by Seurat “VlnPlot” function. N = 2 biological replicates. Statistical significance was assessed using the Wilcoxon rank‐sum test (default Seurat FindMarkers function). ***P ≤ 0.001.
qRT‐PCR expression analysis of Scrt, Ncan (up) and Nrxn1, Snap25 (down) in NSC‐34 cells transfected with miR‐466i‐5p LNA. Data, which are expressed as mean (error bars represent SD), are normalized over Atp5o mRNA levels and reported as RNA fold over the control (scrambled LNA, CTRL), set as 1. N = 3 biological replicates.
qRT‐PCR expression analysis of Scrt, Ncan (up) and Nrxn1, Snap25 (down) in ∆SP mESCs transfected with miR‐466i‐5p LNA and differentiated to early EBs (day 3). Data, which are expressed as mean (error bars represent SD), are normalized over Atp5o mRNA levels and reported as RNA fold over the control (scrambled LNA, CTRL), set as 1. N = 3 biological replicates.

References
-
- Arber S, Han B, Mendelsohn M, Smith M, Jessell TM, Sockanathan S (1999) Requirement for the homeobox gene Hb9 in the consolidation of motor neuron identity. Neuron 23: 659–674 - PubMed
Publication types
MeSH terms
Substances
LinkOut - more resources
Full Text Sources

