. 2023 Jul;53(10):4569-4579.
doi: 10.1017/S0033291722001453. Epub 2022 Jun 14.

Self-evaluation of social-rank in socially anxious individuals associates with enhanced striatal reward function

Affiliations

Self-evaluation of social-rank in socially anxious individuals associates with enhanced striatal reward function

Ofir Shany et al. Psychol Med. 2023 Jul.

Abstract

Background: Negative self-views, especially in the domain of power (i.e. social-rank), characterize social anxiety (SA). Neuroimaging studies on self-evaluations in SA have mainly focused on subcortical threat processing systems. Yet, self-evaluation may concurrently invoke diverse affective processing, as motivational systems related to desired self-views may also be activated. To investigate the conflictual nature that may accompany self-evaluation of certain social domains in SA, we examined brain activity related to both threat and reward processing.

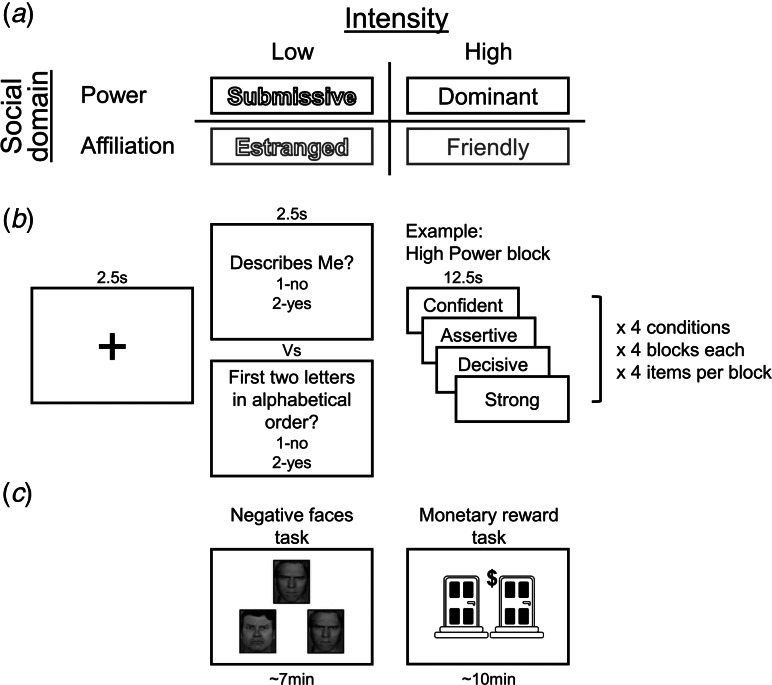
Methods: Participants (N = 74) differing in self-reported SA-severity underwent fMRI while completing a self-evaluation task, wherein they judged the self-descriptiveness of high- v. low-intensity traits in the domains of power and affiliation (i.e. social connectedness). Participants also completed two auxiliary fMRI tasks designated to evoke reward- and threat-related activations in the ventral striatum (VS) and amygdala, respectively. We hypothesized that self-evaluations in SA, particularly in the domain of power, involve aberrant brain activity related to both threat and reward processing.

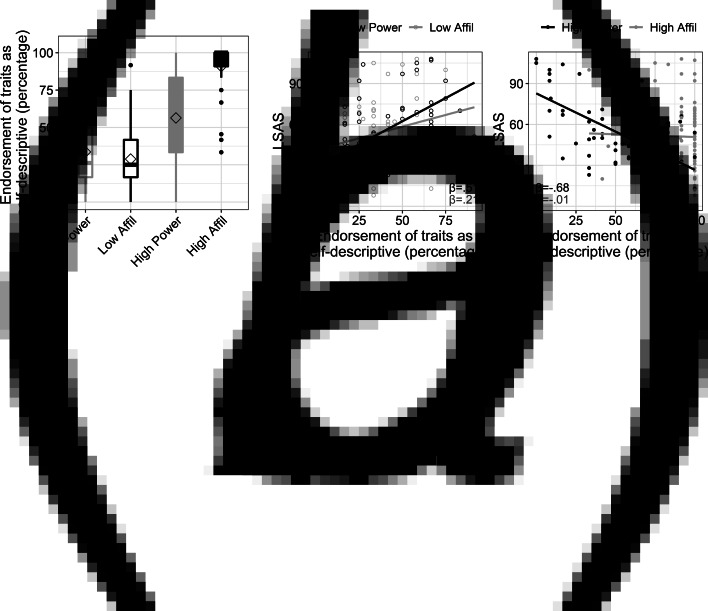
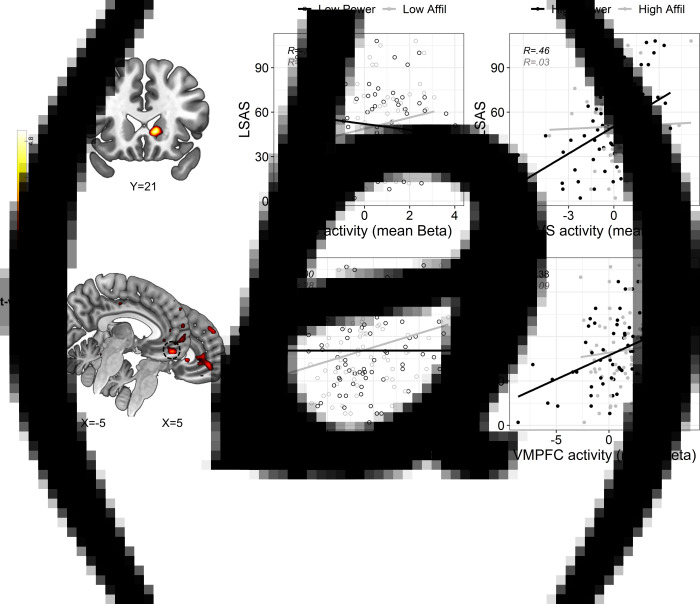
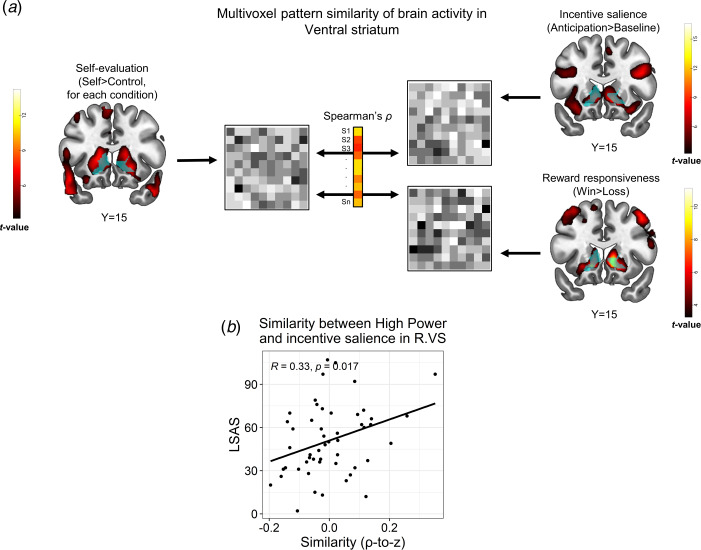
Results: SA-severity was more negatively associated with power than with affiliation self-evaluations. During self-evaluative judgment of high-power (e.g. dominant), SA-severity associated with increased activity in the VS and ventromedial prefrontal cortex. Moreover, SA-severity correlated with higher similarity between brain activity patterns activated by high-power traits and patterns activated by incentive salience (i.e. reward anticipation) in the VS during the reward task.

Conclusions: Our findings indicate that self-evaluation of high-power in SA involves excessive striatal reward-related activation, and pinpoint the downregulation of VS-VMPFC activity within such self-evaluative context as a potential neural outcome for therapeutic interventions.

Keywords: Emotion; Reward; Self-evaluation; Social anxiety; fMRI.


Conflict of interest statement

None.

Figures

Fig. 1.
Fig. 1.
Self-referential encoding task (SRET) and experimental design. (a). The traits in the SRET were classified into four experimental conditions according to their social domain (power v. affiliation; colored in black v. gray, respectively) and intensity (low v. high; without or with color fill, respectively), thus yielding a 2 × 2 within-subject factorial design. (b). Example of an experimental block in the high-power condition. (c). Following the SRET, the participants completed two auxiliary fMRI tasks assessing brain activity in response to reward- and threat-related processes. In the threat task, participants performed a simple matching task on negative facial expressions (angry and fearful) or geometrical shapes (control condition). On each block, participants were asked to select one of two faces/shapes (located at the bottom right or bottom left of the screen) that matched the target face/shape (located at the top of the screen). In the monetary reward task, on each trial participants were asked to select one of two doors, which, following an anticipatory phase, led to either monetary prizes or losses. More details on these tasks are presented in the online Supplementary Methods and in Figs S2 and S3. Note that administration order of the two auxiliary fMRI tasks was counter-balanced across participants.
Fig. 2.
Fig. 2.
Endorsement of traits according to their social domain and intensity, and its interaction with social anxiety. (a). Boxplots depicting the percentage of endorsing traits as self-descriptive (i.e. responding ‘yes’ to the question ‘does the trait describe me?’) in each of the four experimental conditions. The power v. affiliation (abbreviated as affil) social domains are colored in black and gray, respectively. High v. low intensity is denoted by color fill or empty fill, respectively. The horizontal line in each boxplot marks the median, and upper and lower bounds of the box denote the 75th (Q3) and 25th (Q1) percentiles, respectively. The line stretches between the minimum (Q1 − 1.5 × interquartile range) and maximum (Q3 + 1.5 × interquartile range) of the data. The diamond shape indicates the mean. (b). Exploration of the 3-way interaction of social anxiety level, as measured by the Liebowitz Social Anxiety Scale (LSAS), with intensity and social domain of traits. The interaction was explored by computing and comparing between simple slopes that quantified the association of LSAS (y-axis) with endorsing traits within each condition. The simple slopes for LSAS (β-value) within each of the traits' conditions are overlaid on each scatterplot and are colored according to the social domain.
Fig. 3.
Fig. 3.
Modulation of brain activity by the interaction between social anxiety, domain and trait intensity. (a). Statistical parametric maps resulting from a whole-brain analysis of the 3-way interaction. Significant interaction effects were revealed in clusters in the right VS (upper panel) and VMPFC (lower panel). Statistical threshold was set at a voxel-level p < 0.001 and cluster-level pFWE < 0.05. Approximate location of a peak activation in the VMPFC that was used for post-hoc analysis is circled in a dashed black line in the lower panel. (b). Scatterplots depicting the correlation between SA-severity and brain activity during self-evaluation of low-and high-intensity traits (presented on the left v. right panels, respectively, with empty v. color fill) pertaining to affiliation v. power domains (colored in black v. gray, respectively), in the right VS and VMPFC (upper and lower panel, respectively). The plotted Beta values represent brain activity that was extracted from contrasting each self condition against its matching control condition. Linear trend lines and correlation coefficients (Pearson's R) are presented in each scatterplot and are colored according to their social domain, solely for illustrative purposes. Abbreviations: Right ventral striatum (R.VS); ventromedial prefrontal cortex (VMPFC); affiliation (affil). Brain images are presented in neurological convention (i.e. right is right).
Fig. 4.
Fig. 4.
Representational similarity analysis (RSA) between the self-referential encoding task and an auxiliary task probing reward processes. (a). Schema of the between-task RSA pipeline. Multivoxel brain activity patterns in a VS ROI (light blue) were extracted from a relevant contrast in the SRET (self > control for a specific condition; left panel), as well as from contrasts in the reward task that represented incentive salience processing (anticipation > baseline) and reward responsiveness (win > loss). Next, these patterns were correlated for each subject, thus yielding a Spearman's correlation coefficient, which represented the between-task similarity for that subject. We then applied a Fischer r-to-z transformation on the correlation coefficients and correlated them with LSAS scores across participants. (b). Correlations between LSAS scores and similarity of self-evaluation of high-power with incentive salience in the VS (right). Pearson's correlation coefficient and its corresponding p values are overlaid on the scatterplot. Abbreviations: right (R); ventral striatum (VS); Liebowitz social anxiety scale (LSAS). The statistical parametric maps show the group-level effect (i.e. t values of a one sample t test) obtained for each contrast (note that the map from the SRET shows the self > control contrast across all conditions) and are thresholded at voxel-level p < 0.001. All brain images are displayed in neurological convention.

Similar articles

Cited by

References

    1. Aderka, I. M., Weisman, O., Shahar, G., & Gilboa-Schechtman, E. (2009). The roles of the social rank and attachment systems in social anxiety. Personality and Individual Differences, 47(4), 284–288. 10.1016/j.paid.2009.03.014. - DOI
    1. Axelrod, V., Rees, G., & Bar, M. (2017). The default network and the combination of cognitive processes that mediate self-generated thought. Nature Human Behaviour, 1(12), 896–910. 10.1038/s41562-017-0244-9. - DOI - PMC - PubMed
    1. Bartra, O., McGuire, J. T., & Kable, J. W. (2013). The valuation system: A coordinate-based meta-analysis of BOLD fMRI experiments examining neural correlates of subjective value. NeuroImage, 76, 412–427. 10.1016/j.neuroimage.2013.02.063. - DOI - PMC - PubMed
    1. Becker, M. P. I., Simon, D., Miltner, W. H. R., & Straube, T. (2017). Altered activation of the ventral striatum under performance-related observation in social anxiety disorder. Psychological Medicine, 47(14), 2502–2512. 10.1017/S0033291717001076. - DOI - PubMed
    1. Berger, U., Keshet, H., & Gilboa-Schechtman, E. (2017). Self-evaluations in social anxiety: The combined role of explicit and implicit social-rank. Personality and Individual Differences, 104, 368–373. 10.1016/j.paid.2016.08.023. - DOI

Publication types