

Soil Ecotoxicology Needs Robust Biomarkers: A Meta-Analysis Approach to Test the Robustness of Gene Expression-Based Biomarkers for Measuring Chemical Exposure Effects in Soil Invertebrates
- PMID: 35698918
- PMCID: PMC9543370
- DOI: 10.1002/etc.5402
Soil Ecotoxicology Needs Robust Biomarkers: A Meta-Analysis Approach to Test the Robustness of Gene Expression-Based Biomarkers for Measuring Chemical Exposure Effects in Soil Invertebrates
Abstract
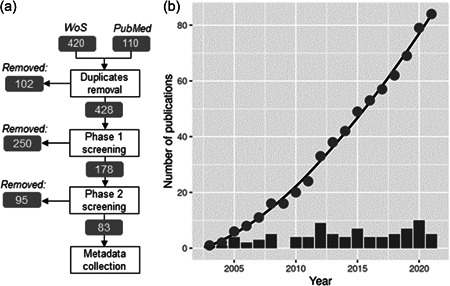
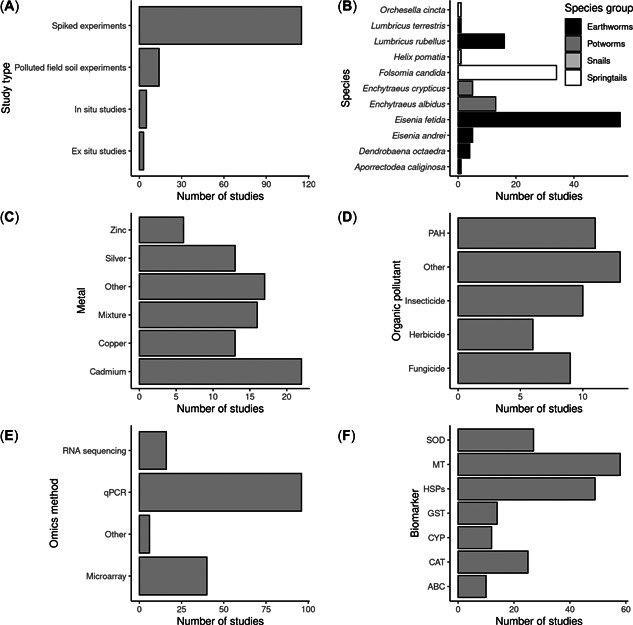
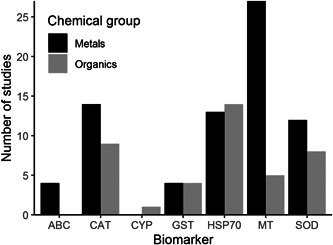
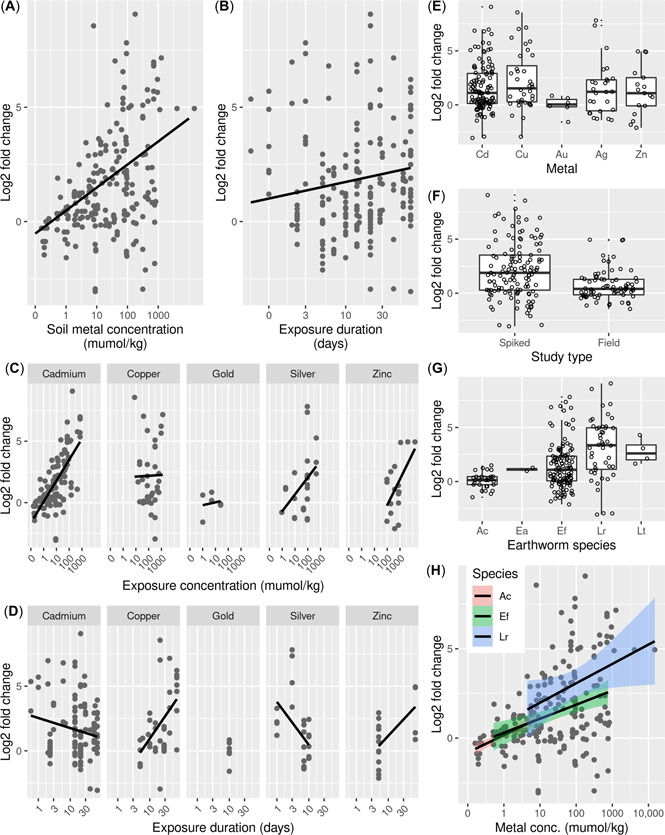
Gene expression-based biomarkers are regularly proposed as rapid, sensitive, and mechanistically informative tools to identify whether soil invertebrates experience adverse effects due to chemical exposure. However, before biomarkers could be deployed within diagnostic studies, systematic evidence of the robustness of such biomarkers to detect effects is needed. In our study, we present an approach for conducting a meta-analysis of the robustness of gene expression-based biomarkers in soil invertebrates. The approach was developed and trialed for two measurements of gene expression commonly proposed as biomarkers in soil ecotoxicology: earthworm metallothionein (MT) gene expression for metals and earthworm heat shock protein 70 (HSP70) gene expression for organic chemicals. We collected 294 unique gene expression data points from the literature and used linear mixed-effect models to assess concentration, exposure duration, and species effects on the quantified response. The meta-analysis showed that the expression of earthworm MT was strongly metal concentration dependent, stable over time and species independent. The metal concentration-dependent response was strongest for cadmium, indicating that this gene is a suitable biomarker for this metal. For copper, no clear concentration-dependent response of MT gene expression in earthworms was found, indicating MT is not a reliable biomarker for this metal. For HSP70, overall marginal up-regulation and lack of a concentration-dependent response indicated that this gene is not suitable as a biomarker for organic pollutant effects in earthworms. The present study demonstrates how meta-analysis can be used to assess the status of biomarkers. We encourage colleagues to apply this open-access approach to other biomarkers, as such quantitative assessment is a prerequisite to ensuring that the suitability and limitations of proposed biomarkers are known and stated. Environ Toxicol Chem 2022;41:2124-2138. © 2022 The Authors. Environmental Toxicology and Chemistry published by Wiley Periodicals LLC on behalf of SETAC.
Keywords: Biomarker; Gene expression; Heat shock protein; Meta-analysis; Metallothionein; Soil invertebrate.
© 2022 The Authors. Environmental Toxicology and Chemistry published by Wiley Periodicals LLC on behalf of SETAC.
Figures
Similar articles
-
Biomarkers in terrestrial invertebrates for ecotoxicological soil risk assessment.Rev Environ Contam Toxicol. 2000;164:93-147. Rev Environ Contam Toxicol. 2000. PMID: 12587835 Review.
-
Relationships between metal compartmentalization and biomarkers in earthworms exposed to field-contaminated soils.Environ Pollut. 2017 May;224:185-194. doi: 10.1016/j.envpol.2017.01.078. Epub 2017 Mar 9. Environ Pollut. 2017. PMID: 28284548
-
Metallothionein induction in the coelomic fluid of the earthworm Lumbricus terrestris following heavy metal exposure: a short report.Biomed Res Int. 2014;2014:109386. doi: 10.1155/2014/109386. Epub 2014 Apr 3. Biomed Res Int. 2014. PMID: 24804193 Free PMC article.
-
Rank-based biomarker index to assess cadmium ecotoxicity on the earthworm Eisenia andrei.Chemosphere. 2016 Feb;145:480-6. doi: 10.1016/j.chemosphere.2015.11.077. Epub 2015 Dec 13. Chemosphere. 2016. PMID: 26694799
-
Influence of soil organic matter content on the toxicity of pesticides to soil invertebrates: A review.Integr Environ Assess Manag. 2023 Nov;19(6):1457-1472. doi: 10.1002/ieam.4770. Epub 2023 Apr 28. Integr Environ Assess Manag. 2023. PMID: 37039034 Review.
Cited by
-
Responses of biomarkers, joint effect and drilosphere bacterial communities to antimony (III and/or V) contamination.Heliyon. 2024 Sep 10;10(18):e37734. doi: 10.1016/j.heliyon.2024.e37734. eCollection 2024 Sep 30. Heliyon. 2024. PMID: 39309772 Free PMC article.
-
Pesticides have negative effects on non-target organisms.Nat Commun. 2025 Feb 13;16(1):1360. doi: 10.1038/s41467-025-56732-x. Nat Commun. 2025. PMID: 39948065 Free PMC article.
References
-
- Amiard‐Triquet, C. , & Amiard, J. C. (2013). Ecological biomarkers: Indicators of ecotoxicological effects. 53, 1689–1699.
-
- Bahrndorff, S. , Mariën, J. , Loeschcke, V. , & Ellers, J. (2009). Dynamics of heat‐induced thermal stress resistance and hsp70 expression in the springtail, Orchesella cincta . Functional Ecology, 23(2), 233–239. 10.1111/j.1365-2435.2009.01541.x - DOI
-
- Ballabio, C. , Panagos, P. , Lugato, E. , Huang, J.‐H. , Orgiazzi, A. , Jones, A. , Fernández‐Ugalde, O. , Borrelli, P. , & Montanarella, L. (2018). Copper distribution in European topsoils: An assessment based on {LUCAS} soil survey. Science of the Total Environment, 636, 282–298. 10.1016/j.scitotenv.2018.04.268 - DOI - PubMed
-
- Barton, K. (2020). MuMIn: Multi‐Model Inference. R package version 1.43.17. https://cran.r-project.org/package=MuMIn
Publication types
MeSH terms
Substances
LinkOut - more resources
Full Text Sources
