. 2022 Jul 5;56(13):9623-9631.
doi: 10.1021/acs.est.2c00927. Epub 2022 Jun 14.

Hydrocarbon Tracers Suggest Methane Emissions from Fossil Sources Occur Predominately Before Gas Processing and That Petroleum Plays Are a Significant Source

Affiliations

Hydrocarbon Tracers Suggest Methane Emissions from Fossil Sources Occur Predominately Before Gas Processing and That Petroleum Plays Are a Significant Source

Ariana L Tribby et al. Environ Sci Technol. .

Abstract

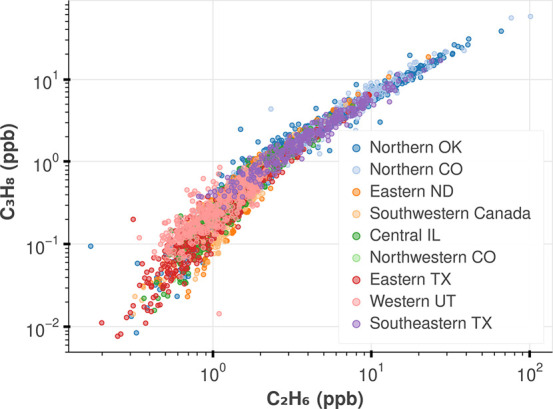
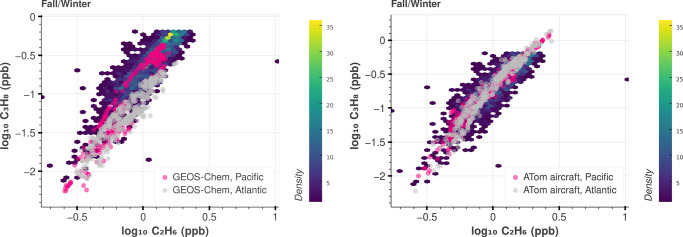
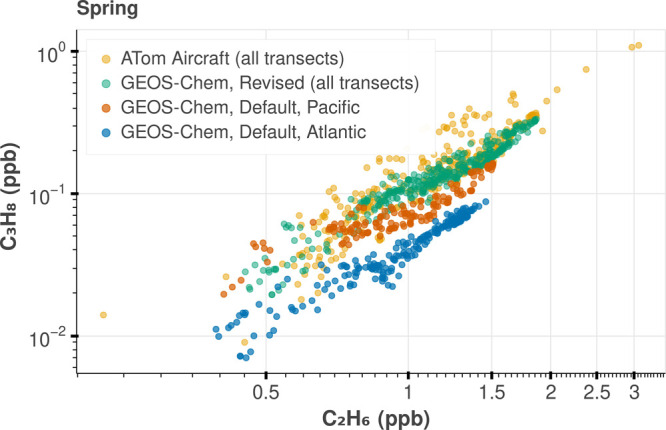
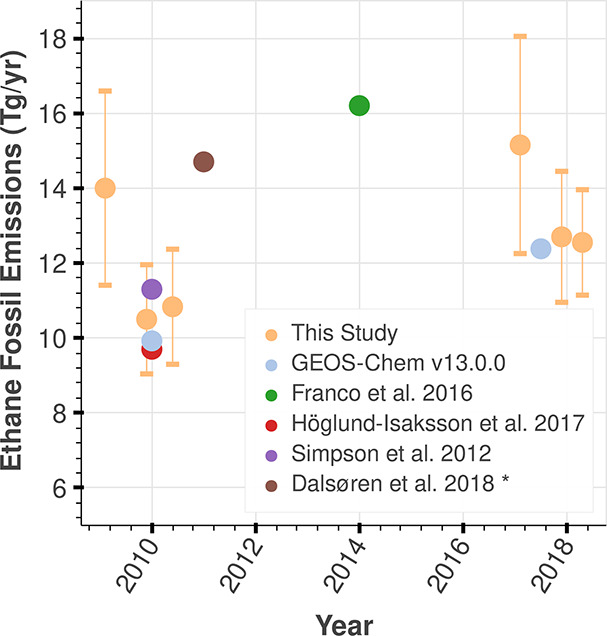
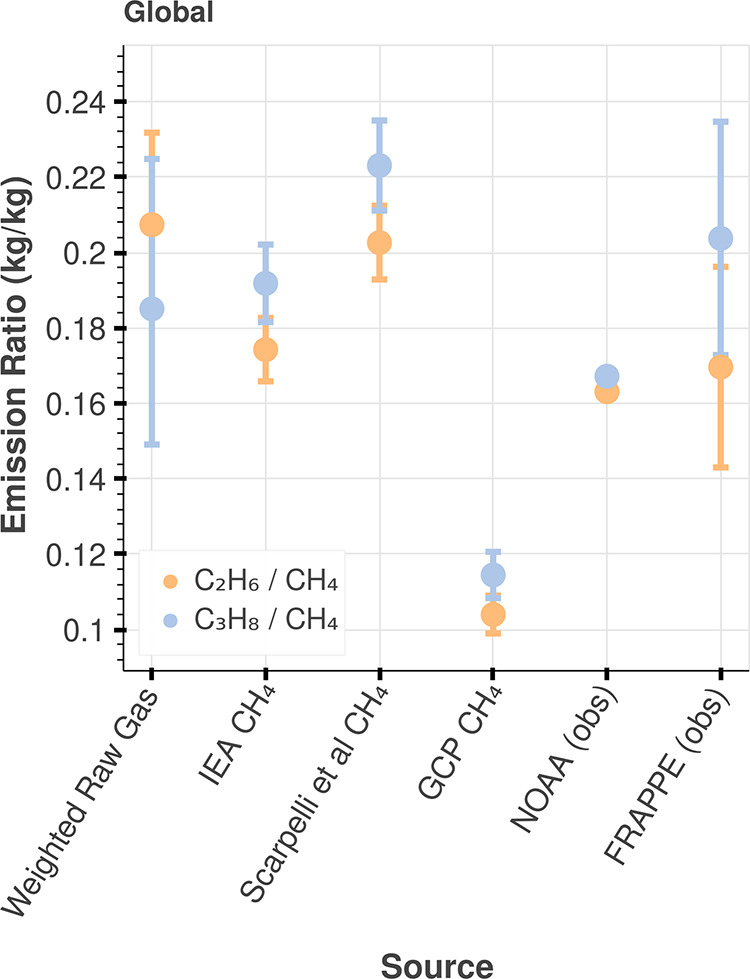
We use global airborne observations of propane (C3H8) and ethane (C2H6) from the Atmospheric Tomography (ATom) and HIAPER Pole-to-Pole Observations (HIPPO), as well as U.S.-based aircraft and tower observations by NOAA and from the NCAR FRAPPE campaign as tracers for emissions from oil and gas operations. To simulate global mole fraction fields for these gases, we update the default emissions' configuration of C3H8 used by the global chemical transport model, GEOS-Chem v13.0.0, using a scaled C2H6 spatial proxy. With the updated emissions, simulations of both C3H8 and C2H6 using GEOS-Chem are in reasonable agreement with ATom and HIPPO observations, though the updated emission fields underestimate C3H8 accumulation in the arctic wintertime, pointing to additional sources of this gas in the high latitudes (e.g., Europe). Using a Bayesian hierarchical model, we estimate global emissions of C2H6 and C3H8 from fossil fuel production in 2016-2018 to be 13.3 ± 0.7 (95% CI) and 14.7 ± 0.8 (95% CI) Tg/year, respectively. We calculate bottom-up hydrocarbon emission ratios using basin composition measurements weighted by gas production and find their magnitude is higher than expected and is similar to ratios informed by our revised alkane emissions. This suggests that emissions are dominated by pre-processing activities in oil-producing basins.

Keywords: energy; ethane; methane; natural gas; propane.


Conflict of interest statement

The authors declare no competing financial interest.

Figures

Figure 1
Figure 1
Measurements of C2H6 and C3H8 from ongoing NOAA GML tower and aircraft sites (Table S1) from 2005 to 2018. The data follow the photochemical aging distribution described in Parrish et al., where the data below 1 ppb C3H8 are affected by photochemically aged emissions and mixing processes. As such, we only study the ratio of these gases in the 50th highest percentile (everything above 1 ppb C3H8) that would indicate fresh emissions. After this filtering, two sites, Northwestern CO and Western UT (site codes NWR and UTA), did not have any data in the fresh emission regime and are not included in further analysis (more detail in Figure S8).
Figure 2
Figure 2
Yearly correlation between NOAA hydrocarbon versus CH4 anomaly in Oklahoma. We show the percent change of anomalies/year with respect to the mean hydrocarbon and methane anomalies. The trend for C3H8/CH4 is 7.13 ± 1.44% with an R2 of 0.71. The trend for C2H6/CH4 is 5.87 ± 1.26% with an R2 = 0.69. The variability in the trend comes from the standard error of a linear regression. The variability in the individual points comes from the 95% confidence interval of a pairs bootstrap of the alkanes and CH4 anomalies. (We ran a pairs bootstrap for co-measurements of C3H8 and ΔCH4 and compute the slope of the correlation for each bootstrap sample and repeated this for every year in the data; please see the Materials and Methods section.) This trend in units of ppt/ppb/year is shown in Figure S21.
Figure 3
Figure 3
Comparison of C3H8 versus C2H6 for NOAA, ATom aircraft, and GEOS-Chem simulations during fall/winter seasons. NOAA photochemically aged measurements (all sites, 2005–2018), as explained in the text, are shown on the heat map (colored by the number density of data). The spring/summer seasons are included in Figures S29, S30, and S33. HIPPO is shown in Figure S34.
Figure 4
Figure 4
Impact of revised C3H8 emissions on GEOS-Chem simulation. Combined Pacific and Atlantic transects for ATom 4 aircraft campaign, which took place during Spring 2018, are shown in gold. The GEOS-Chem simulation using default C3H8 emissions are shown in blue and orange, referring to the Pacific and Atlantic transects, respectively. The GEOS-Chem simulation after implementing the revised C3H8 emissions is shown in green. The rest of the ATom and HIPPO campaigns are shown in Figures S35 and S36.
Figure 5
Figure 5
Global revised ethane anthropogenic fossil emissions compared to other studies. Our emissions estimate in 2016–2018 (during ATom) and 2009–2011 (during HIPPO) includes our revised emissions for winter, fall, and spring seasons that we determined with our Bayesian model during each season. As discussed in the text, fewer samples were obtained during HIPPO, resulting in a sampling bias that we test by restricting observations and simulations to ±300 K potential temperature (Figures S56 and S57). This test affects the estimate about ±1 Tg during 2010–2011 but affects our estimate by up to 12 Tg in 2009. We compare our revised emissions to the default emissions from GEOS-Chem v13.0.0. The studies included here,− represent anthropogenic fossil emissions, except for the work by Dalsøren et al., which also includes biofuel, agriculture, and waste. We obtained the CEDS CMIP6 estimate from Dalsøren et al. Our emissions estimates do not include biomass burning or biofuels. Propane emissions are included in Figure S62.
Figure 6
Figure 6
Global literature and observationally informed emission ratios (OIER) C3H8/CH4 and C2H6/CH4. The “weighted raw gas ratio” in the figure represents the “literature ratio” described in the text, calculated using eq 2. OIER, ratios between our revised C2H6 and C3H8 emissions and literature CH4 emission estimates, are shown for several literature CH4 estimates, including IEA (76.4 Tg/year), Scarpelli et al. (65.7 Tg/year), and Global Carbon Project bottom-up estimate (128 Tg/year, 2008–2017 average). The variability in the literature ratio is attributed to the 95% CI of pairs bootstrap samples of hydrocarbon composition measurements (see text for more detail). The variability in the OIER is attributed to the 95% CI of our revised C3H8 and C2H6 emission estimates. We also compare C3H8/CH4 and C2H6/CH4 correlations from in situ observations, including NOAA observations from Northern Oklahoma (2017 average from Figure S21, units of kg/kg) and FRAPPE observations from Northern Colorado (2014 from Figure S9, units of kg/kg). The variability in the NOAA ratio is relatively low because it is calculated from a multiyear average slope, and the error in the slope is low (see Figure S21, left). The variability in the FRAPPE ratio is relatively high because we use the 95% CI derived directly from our bootstrap samples, as described in the Materials and Methods section.

References

    1. U.S. Energy Information Administration . Where our natural gas comes from; https://www.eia.gov/energyexplained/natural-gas/where-our-natural-gas-co... (accessed 2022-03-18).
    1. Lan X.; Tans P.; Sweeney C.; Andrews A.; Dlugokencky E.; Schwietzke S.; Kofler J.; McKain K.; Thoning K.; Crotwell M.; Montzka S.; Miller B. R.; Biraud S. C. Long-Term Measurements Show Little Evidence for Large Increases in Total U.S. Methane Emissions Over the Past Decade. Geophys. Res. Lett. 2019, 46 (9), 4991–4999. 10.1029/2018GL081731. - DOI
    1. Turner A. J.; Frankenberg C.; Wennberg P. O.; Jacob D. J. Ambiguity in the Causes for Decadal Trends in Atmospheric Methane and Hydroxyl. Proc. Natl. Acad. Sci. U. S. A. 2017, 114 (21), 5367–5372. 10.1073/pnas.1616020114. - DOI - PMC - PubMed
    1. Kort E. A.; Smith M. L.; Murray L. T.; Gvakharia A.; Brandt A. R.; Peischl J.; Ryerson T. B.; Sweeney C.; Travis K. Fugitive Emissions from the Bakken Shale Illustrate Role of Shale Production in Global Ethane Shift: Ethane Emissions From the Bakken Shale. Geophys. Res. Lett. 2016, 43 (9), 4617–4623. 10.1002/2016GL068703. - DOI
    1. U.S. Energy Information Administration . Hydrocarbon gas liquids explained; https://www.eia.gov/energyexplained/hydrocarbon-gas-liquids/prices-for-h... (accessed 2022-01-31).

Publication types

LinkOut - more resources