. 2022 Jun 14:11:e77195.
doi: 10.7554/eLife.77195.

Niche-specific genome degradation and convergent evolution shaping Staphylococcus aureus adaptation during severe infections

Affiliations

Niche-specific genome degradation and convergent evolution shaping Staphylococcus aureus adaptation during severe infections

Stefano G Giulieri et al. Elife. .

Abstract

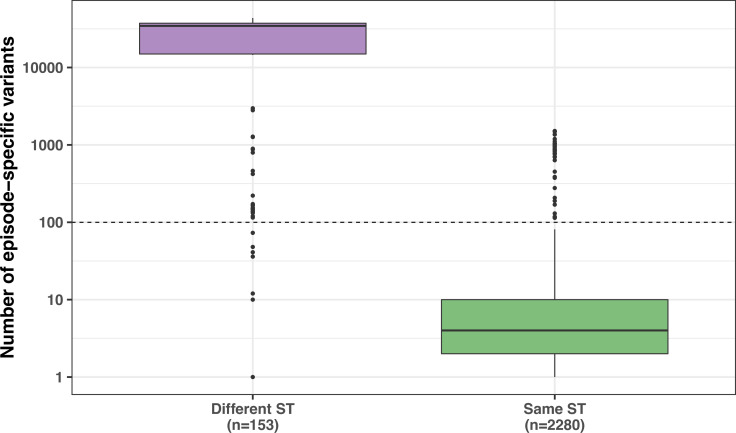
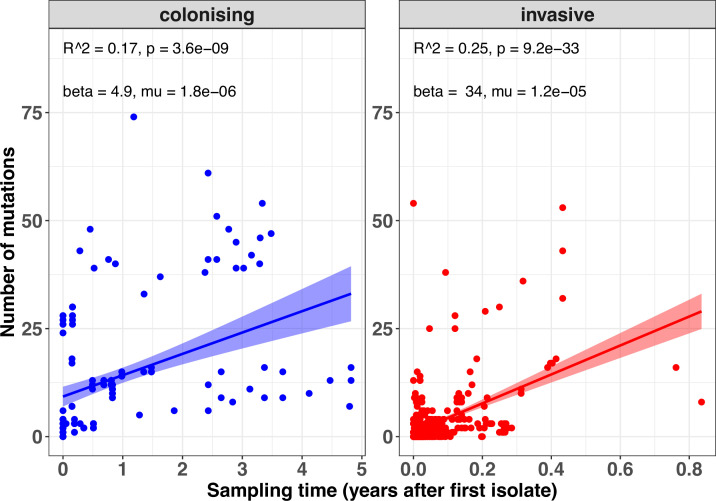
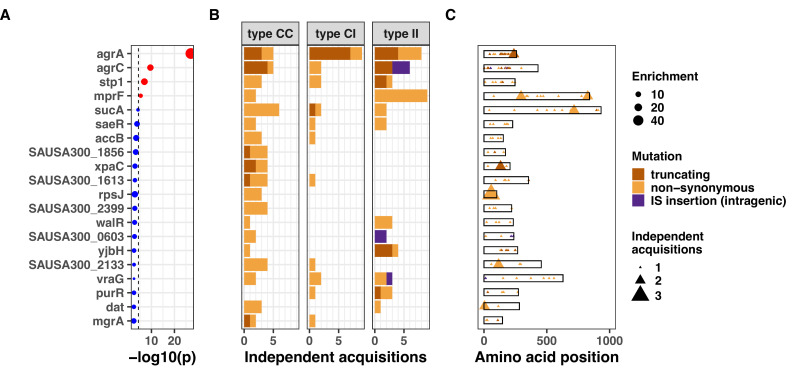
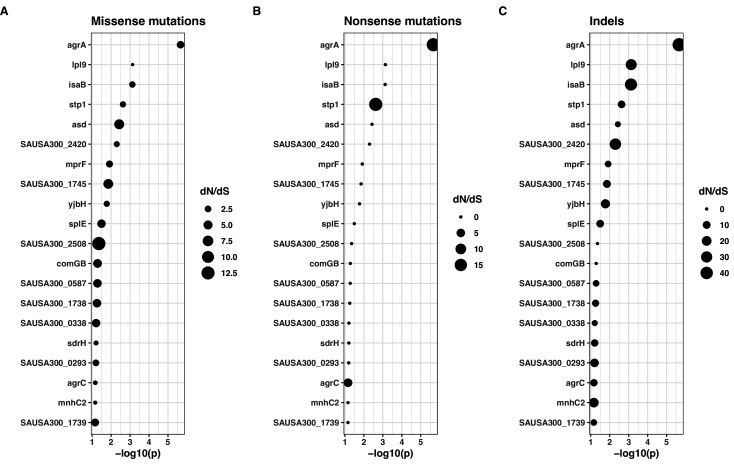
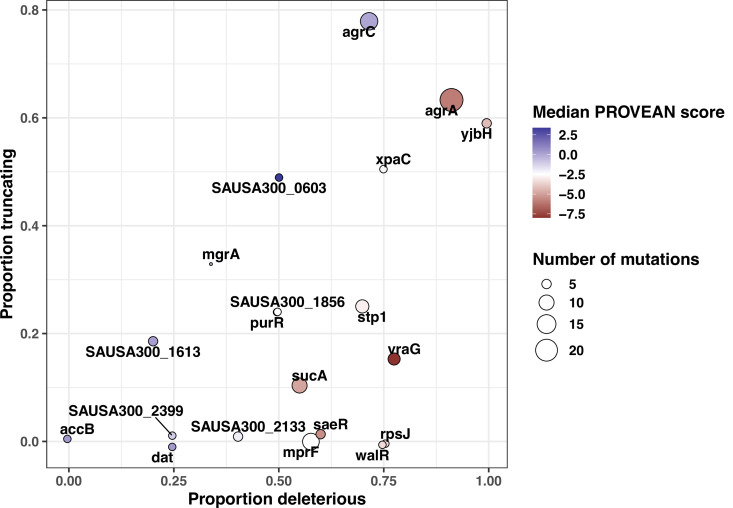
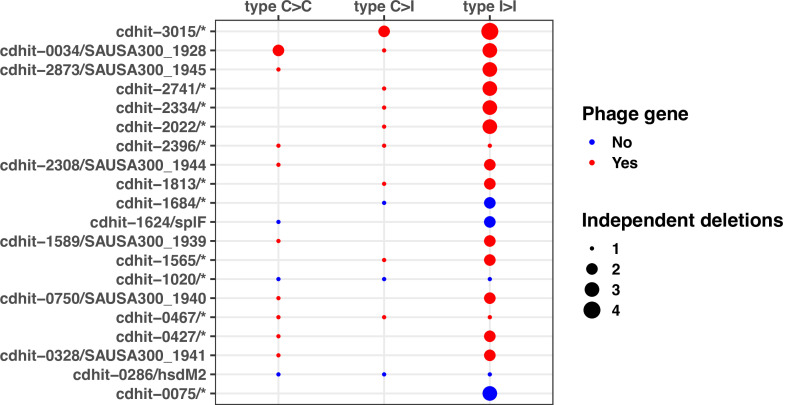
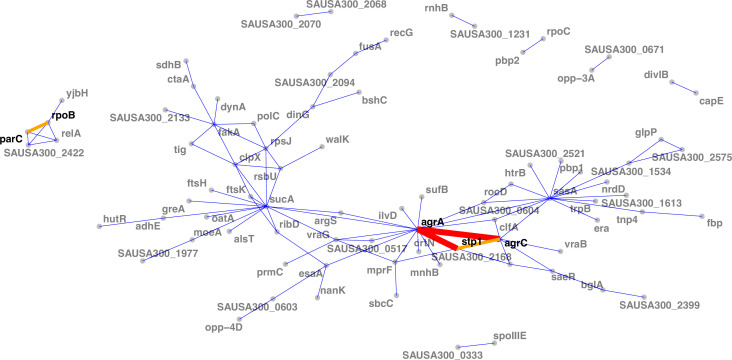
During severe infections, Staphylococcus aureus moves from its colonising sites to blood and tissues and is exposed to new selective pressures, thus, potentially driving adaptive evolution. Previous studies have shown the key role of the agr locus in S. aureus pathoadaptation; however, a more comprehensive characterisation of genetic signatures of bacterial adaptation may enable prediction of clinical outcomes and reveal new targets for treatment and prevention of these infections. Here, we measured adaptation using within-host evolution analysis of 2590 S. aureus genomes from 396 independent episodes of infection. By capturing a comprehensive repertoire of single nucleotide and structural genome variations, we found evidence of a distinctive evolutionary pattern within the infecting populations compared to colonising bacteria. These invasive strains had up to 20-fold enrichments for genome degradation signatures and displayed significantly convergent mutations in a distinctive set of genes, linked to antibiotic response and pathogenesis. In addition to agr-mediated adaptation, we identified non-canonical, genome-wide significant loci including sucA-sucB and stp1. The prevalence of adaptive changes increased with infection extent, emphasising the clinical significance of these signatures. These findings provide a high-resolution picture of the molecular changes when S. aureus transitions from colonisation to severe infection and may inform correlation of infection outcomes with adaptation signatures.

Keywords: Staphylococcus aureus; adaptation; genetics; genomics; infectious disease; microbiology; within-host evolution.

Plain language summary

The bacterium Staphylococcus aureus lives harmlessly on our skin and noses. However, occasionally, it gets into our blood and internal organs, such as our bones and joints, where it causes severe, long-lasting infections that are difficult to treat. Over time, S. aureus acquire characteristics that help them to adapt to different locations, such as transitioning from the nose to the blood, and avoid being killed by antibiotics. Previous studies have identified changes, or ‘mutations’, in genes that are likely to play an important role in this evolutionary process. One of these genes, called accessory gene regulator (or agr for short), has been shown to control the mechanisms S. aureus use to infect cells and disseminate in the body. However, it is unclear if there are changes in other genes that also help S. aureus adapt to life inside the human body. To help resolve this mystery, Giulieri et al. collected 2,500 samples of S. aureus from almost 400 people. This included bacteria harmlessly living on the skin or in the nose, as well as strains that caused an infection. Gene sequencing revealed a small number of genes, referred to as ‘adaptive genes’, that often acquire mutations during infection. Of these, agr was the most commonly altered. However, mutations in less well-known genes were also identified: some of these genes are related to resistance to antibiotics, while others are involved in chemical processes that help the bacteria to process nutrients. Most mutations were caused by random errors being introduced in to the bacteria’s genetic code which stopped genes from working. However, in some cases, genes were turned off by small fragments of DNA moving around and inserting themselves into different parts of the genome. This study highlights a group of genes that help S. aureus to thrive inside the body and cause severe and prolonged infections. If these results can be confirmed, it may help to guide which antibiotics are used to treat different infections. Furthermore, understanding which genes are important for infection could lead to new strategies for eliminating this dangerous bacterium.


Conflict of interest statement

SG, RG, SD, AH, DD, TS, JD, ST, BY, DW, TS, BH No competing interests declared

Figures

Figure 1.
Figure 1.. Overview of the S. aureus within-host evolution analysis framework.
(A) Simulated phylogenetic tree illustrating within-host evolution of S. aureus colonisation and infection. This model assumes two genetic bottlenecks (dotted lines); upon transmission and upon transition from colonisation to invasive infection. (B) Sites and timing of within-host samples and number of genomes per sample define five prototypes of within-host evolution studies, each with colonising-colonising (C>C), colonising-invasive (C>I), or invasive-invasive (I>I) comparisons in different combinations: from top to the bottom: multiple colonising samples and one invasive samples; one colonising and one invasive sample; multiple colonising samples; multiple invasive samples; multiple colonising and invasive samples. (C) Approach to capture signals of adaptation across multiple independent episodes of colonisation/infection through detection of multiple genetic mechanisms of adaptation from short reads data and multi-layered functional annotation of the genetic variants using multiple databases including characterisation of intergenic regions (promoters), operon prediction, and gene ontology (GO). Statistical framework for the gene, operon, and gene set enrichment anlaysis (GSEA). Counts of independent mutations with likely impact on the protein sequence (non-synonymous substitutions, frameshifts, stop codon mutations, and insertion sequences [IS] insertions) were computed for each genes with a FPR3757 homologue. Gene counts (with the addition of intergenic mutations in promoter regions) were aggregated in operons and GOs. Gene and operon counts were used to fit Poisson regression models to infer mutation enrichment and significance of the enrichment. GOs counts and gene enrichment significance were used to run a gene-set-enrichment analysis. To illustrate the approach, the example of the gene walR is provided in italic.
Figure 2.
Figure 2.. (A) Maximum-likelihood phylogenetic tree of 2590 S. aureus sequences included in the study.
The tree is annotated (starting from the inner circle) with the most prevalent sequence types (ST), presence/absence of the mecA gene, compartment of isolation (colonising or invasive), and year of publication. (B) Summary of 396 independent episodes of S. aureus colonisation or infection categorised according to whether they allowed comparing colonising-colonising (C>C), colonising-invasive (C>I), or invasive-invasive (I>I) strains, or a combination of them. (C) Evidence of a distinctive pattern of adaptation in late infection-adapted strains (type I>I variants). For each type of comparison (type C>C, colonising-colonising; type C>I, colonising-invasive; type I>I, invasive-invasive), the cumulative curves display the accrued number of intergenic mutations, truncating mutations, insertion sequences (IS) insertions, and large deletions as a function of the total number of mutations. Genetic events were counted once per episode, regardless of the number of strains with the mutation. The sequence of mutations events in the cumulative curves is random.
Figure 2—figure supplement 1.
Figure 2—figure supplement 1.. Number of episode-specific variants in same-episode strains having the same sequence type (ST) as the internal reference vs. isolates with a different ST.
The dashed line represents the mutation threshold used to remove genetically unrelated strains with the same episode.
Figure 2—figure supplement 2.
Figure 2—figure supplement 2.. Correlation between number of samples per episode and mean mutation counts.
Figure 2—figure supplement 3.
Figure 2—figure supplement 3.. Within-host mutation rates within the colonising and invasive populations.
The scatter plots display the linear relationship between sampling time after the internal reference and number of mutations. Only episodes with at least two strains collected at at least 1 day apart were included. The shaded area around the fitted regression shows the 95% confidence interval (CI). The parameters shown on the top of each plot are the r-squared, p value, regression coefficient β, and the mutation rate μ (mutations site–1 year–1).
Figure 2—figure supplement 4.
Figure 2—figure supplement 4.. Regression diagnostics to assess linear regressions sampling time after the internal reference and number of mutations.
Figure 2—figure supplement 5.
Figure 2—figure supplement 5.. Distribution of new IS insertions by classification of the transposase and by major sequence types (ST).
(A) Distribution of the nine major ST among 2590 strains. (B) Number of independent insertion sequences (IS) insertions by ST group and type of transposase.
Figure 3.
Figure 3.. Top 20 genes with the most significant mutation enrichment across the entire dataset.
(A) Significance of the enrichment for protein-altering mutations. The dashed line depicts the Bonferroni-corrected significance threshold, and red circles and blue circles represent genes with p values below and above the Bonferroni threshold, respectively. (B) Bar plots of independent mutations separated in three panels according to the type of variant (type C>C: colonising-colonising; type C>I: colonising-invasive; type I>I: invasive-invasive) and coloured according to the class of mutation. (C) Gene maps with type and positions of mutations.
Figure 3—figure supplement 1.
Figure 3—figure supplement 1.. Mapping of mutations in the 10 most significantly enriched mutated genes across the entire dataset.
The maximum-likelihood phylogenetic tree was inferred from the core genome alignment of 2590 isolates. The variants are annotated based on SnpEff (*: stop codon; fs: frameshift; ext*?: stop lost).
Figure 3—figure supplement 2.
Figure 3—figure supplement 2.. dN/dS values for non-synonymous mutations (A), indels (B), and non-sense mutations (stop codons) (B) for FPR3757 genes.
Only the 20 most significant genes with positive selection (dN/dS for missense mutations >1) are shown.
Figure 3—figure supplement 3.
Figure 3—figure supplement 3.. Scatter plot representing in silico inferred functional impact of variants in the 20 most convergent loci.
On the x-axis are shown proportions of predicted deleterious mutations (protein-truncating substitutions with PROVEAN score <–2.5, insertion sequences [IS] insertions), the y-axis shows protein-truncating mutations, the colour of the dots is based on the median PROVEAN score, and the size represents the total number of aggregated mutations.
Figure 3—figure supplement 4.
Figure 3—figure supplement 4.. Most frequently deleted genes in large deletions.
Figure 3—figure supplement 5.
Figure 3—figure supplement 5.. Most frequently enriched genes in copy number variations.
Figure 3—figure supplement 6.
Figure 3—figure supplement 6.. Gene convergence analysis of all mutated genes (i.e. including both genes with FPR3757 homologue and no FPR3757 homologue).
Top 20 genes with the most significant mutation enrichment across the entire dataset. (A) Significance of the enrichment for protein-altering mutations. The dashed line depicts the Bonferroni-corrected significance threshold, and red circles and blue circles represent genes with and without FPR3757 homologue, respectively. (B) Bar plots of independent mutations separated in three panels according to the type of variant (type C>C: colonising-colonising; type C>I: colonising-invasive; type I>I: invasive-invasive) and coloured according to the class of mutation. (C) Gene maps with type and positions of mutations.
Figure 3—figure supplement 7.
Figure 3—figure supplement 7.. Gene convergence analysis after removing variants in strains included in Young et al., 2017, the largest collection of this analysis (1078 strains and 105 episodes).
Top 20 genes with the most significant mutation enrichment across the entire dataset. (A) Significance of the enrichment for protein-altering mutations. The dashed line depicts the Bonferroni-corrected significance threshold, and red circles and blue circles represent genes with p values below and above the Bonferroni threshold, respectively. (B) Bar plots of independent mutations separated in three panels according to the type of variant (type C>C: colonising-colonising; type C>I: colonising-invasive; type I>I: invasive-invasive) and coloured according to the class of mutation. (C) Gene maps with type and positions of mutations.
Figure 4.
Figure 4.. Top 20 operons with the most significant mutation enrichment across all dataset.
(A) Significance of the enrichment for protein-altering mutations. The dashed line depicts the Bonferroni-corrected significance threshold, and red circles and blue circles represent operons with p values below and above the Bonferroni threshold, respectively. (B) Bar plots of independent mutations separated in three panels according to the type of variant (type C>C: colonising-colonising; type C>I: colonising-invasive; type I>I: invasive-invasive) and coloured according to the class of mutation. Mutations were considered independent if they occurred in separate episodes of either colonisation or invasive infection. (C) Operon maps with positions of the mutations (relative to the start of the first gene of the operon). Operons are labelled with the names of the genes included, and longer labels were shorted for clarity (see Supplementary file 5 for details).
Figure 5.
Figure 5.. Modified volcano plot displaying enrichment (x-axis) and significance of enrichment (y-axis) within colonising-colonising (type C>C), colonising-invasive (type C>I), and invasive-invasive (type I>I) variants.
The horizontal dashed line depicts the Bonferroni-corrected significance threshold and dotted line shows the suggestive significance threshold. Labels indicate genes with significance of enrichment below the suggestive threshold. Genes are coloured in red if the p value is below the Bonferroni-corrected threshold and in blue otherwise.
Figure 5—figure supplement 1.
Figure 5—figure supplement 1.. Modified volcano plot displaying enrichment (x-axis) and significance of enrichment (y-axis) for FPR3757 operons across the entire dataset, colonising-colonising (type CC), colonising-invasive (type CI), and invasive-invasive (type II) variants.
The horizontal line depicts the Bonferroni-corrected significance threshold. Genes are coloured in red if the p value is below the Bonferroni-corrected threshold and in blue otherwise. Operons are labelled if they were significantly enriched or reached near significance.
Figure 5—figure supplement 2.
Figure 5—figure supplement 2.. Gene set enrichment analysis (GSEA) for protein-modifying mutations in colonising-colonising (type CC), colonising-invasive (type CI), and invasive-invasive (type II) variants.
(A) Gene ontologies (minimum set size 10 for a total of 110 categories) ordered by normalised enrichment score (NES). Ontologies with negative enrichment were excluded. Dark blue bars indicate a significant p value after false discovery rate correction (B) Dot plot of nine significantly enriched ontologies among type II variants.
Figure 6.
Figure 6.. Network of mutations co-occurrence.
The width and colour of the edges represent the strength of the co-occurrence of mutated genes on the same strain (thin and blue, two independent co-occurrences; thick and orange, three independent co-occurrences).
Figure 7.
Figure 7.. Clinical correlates of adaptive signatures within colonising (colonising-colonising [type C>C,] panels A–C) and invasive (invasive-invasive [type I>I], panels D–F) bacterial populations.
Adaptation was inferred by computing the Jaccard index of shared mutated genes between independent episodes, followed by network analysis of infection episodes pairs. The node centrality measure was used as an indicator of adaptation. To avoid overinflation of mutated genes, the calculation was limited to the 20 most significantly enriched genes within each group of mutations. (A, D) Density of centrality values across colonisation (panel A) and infection categories (panel D). (B, E) Number and proportion of adaptive episodes. An adaptive episode was defined by a centrality >0. (C, F) Distribution of mutations in the 20 most significantly enriched genes across categories of colonisation (panel C) and infection (panel F).
Figure 7—figure supplement 1.
Figure 7—figure supplement 1.. Clinical manifestations and infection sites of invasive episodes, grouped by the infection syndromes classification used for the adaptation analysis.
Figure 7—figure supplement 2.
Figure 7—figure supplement 2.. Network of colonisation/infection episodes for colonising-colonising (type CC) (panel A), colonising-invasive (type CI) (panel B), and invasive-invasive (type II) variants (panel C).
Nodes indicate independent episodes, coloured based on the clinical syndrome, edges show connections based on shared mutated genes (the width of the connection is proportional to the Jaccard index).

References

    1. Abbosh C, Birkbak NJ, Wilson GA, Jamal-Hanjani M, Constantin T, Salari R. Phylogenetic ctDNA analysis depicts early-stage lung cancer evolution. Nature. 2017;545:446–451. doi: 10.1038/nature22364. - DOI - PMC - PubMed
    1. Abel S, Abel zur Wiesch P, Davis BM, Waldor MK. Analysis of Bottlenecks in Experimental Models of Infection. PLOS Pathogens. 2015;11:e1004823. doi: 10.1371/journal.ppat.1004823. - DOI - PMC - PubMed
    1. Altman DR, Sullivan MJ, Chacko KI, Balasubramanian D, Pak TR, Sause WE, Kumar K, Sebra R, Deikus G, Attie O, Rose H, Lewis M, Fulmer Y, Bashir A, Kasarskis A, Schadt EE, Richardson AR, Torres VJ, Shopsin B, van Bakel H. Genome Plasticity of agr-Defective Staphylococcus aureus during Clinical Infection. Infection and Immunity. 2018;86:e00331-18. doi: 10.1128/IAI.00331-18. - DOI - PMC - PubMed
    1. Aseev LV, Boni IV. Extraribosomal functions of bacterial ribosomal proteins. Molekuliarnaia Biologiia. 2011;45:805–816. doi: 10.1134/S0026893311050025. - DOI - PubMed
    1. Austin CM, Garabaglu S, Krute CN, Ridder MJ, Seawell NA, Markiewicz MA. Contribution of YjbIH to Virulence Factor Expression and Host Colonization in Staphylococcus aureus. Infection and Immunity. 2019;87:e00155-19. doi: 10.1128/IAI.00155-19. - DOI - PMC - PubMed

Publication types

MeSH terms

Associated data