Review
. 2022 Jul 13;122(13):11778-11829.
doi: 10.1021/acs.chemrev.1c00971. Epub 2022 Jun 14.

Polymer Photoelectrodes for Solar Fuel Production: Progress and Challenges

Affiliations
Review

Polymer Photoelectrodes for Solar Fuel Production: Progress and Challenges

Madasamy Thangamuthu et al. Chem Rev. .

Abstract

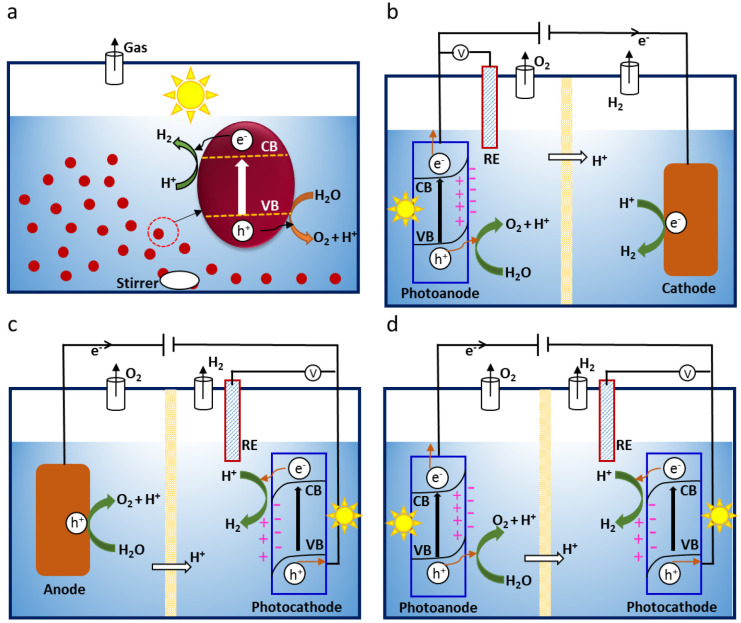
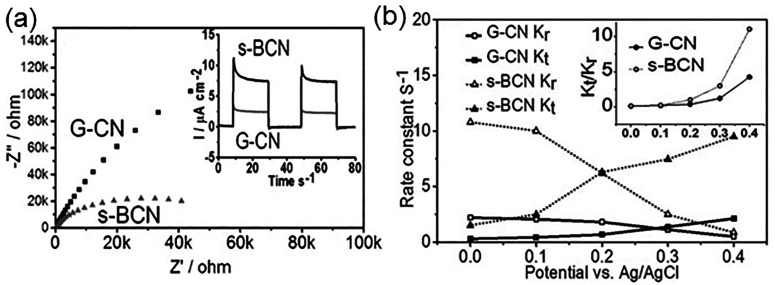
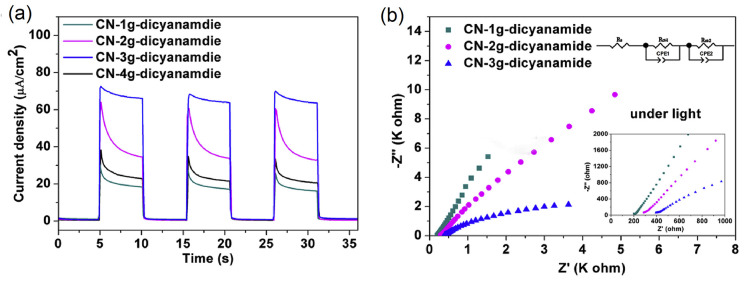
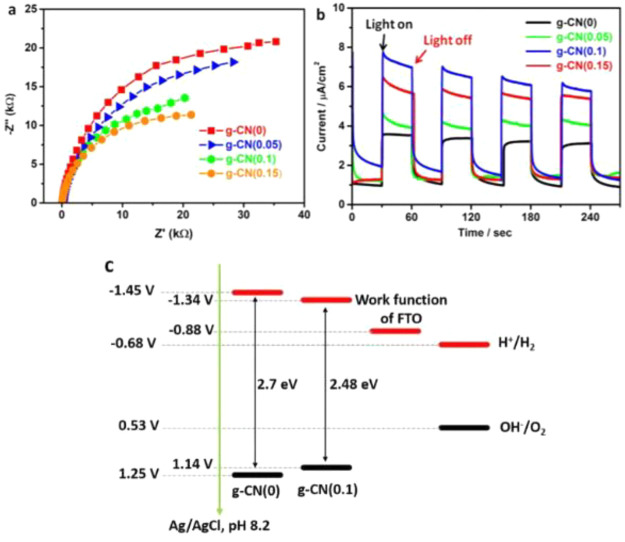
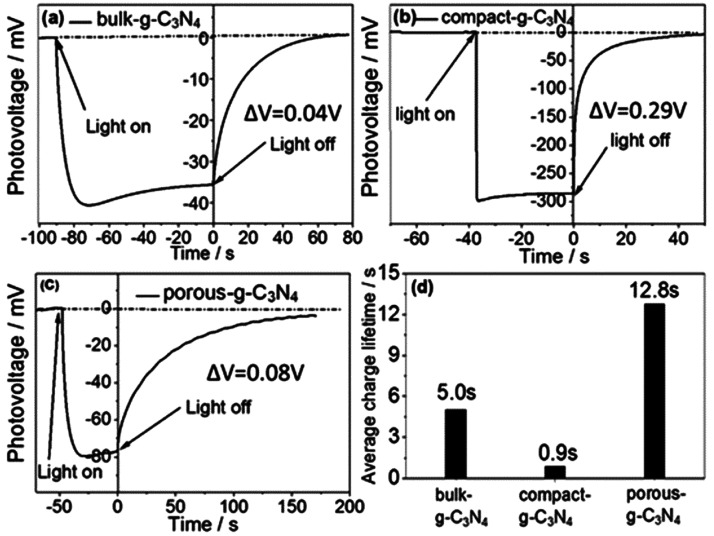
Converting solar energy to fuels has attracted substantial interest over the past decades because it has the potential to sustainably meet the increasing global energy demand. However, achieving this potential requires significant technological advances. Polymer photoelectrodes are composed of earth-abundant elements, e.g. carbon, nitrogen, oxygen, hydrogen, which promise to be more economically sustainable than their inorganic counterparts. Furthermore, the electronic structure of polymer photoelectrodes can be more easily tuned to fit the solar spectrum than inorganic counterparts, promising a feasible practical application. As a fast-moving area, in particular, over the past ten years, we have witnessed an explosion of reports on polymer materials, including photoelectrodes, cocatalysts, device architectures, and fundamental understanding experimentally and theoretically, all of which have been detailed in this review. Furthermore, the prospects of this field are discussed to highlight the future development of polymer photoelectrodes.


Conflict of interest statement

The authors declare no competing financial interest.

Figures

Figure 1
Figure 1
Solar fuel production approaches. (a) Suspension-based photocatalysis. (b) Photoanode|dark cathode. (c) Photocathode|dark anode. (d) Photoanode|Photocathode. Note: For CO2 reduction, the same design is applied with the exception of CO2 reduction rather than proton reduction on the cathodes. The bias in Figure 1d could be omitted if two photoelectrodes can form a Z-scheme.
Figure 2
Figure 2
Schematic representation of the synthesis of CNx using (a) a thermal vapor condensation method. Adapted with permission from ref (86). Copyright 2015 Elsevier. (b) Two-step vapor deposition method. Adapted with permission from ref (87). Copyright 2017 Elsevier.
Figure 3
Figure 3
(a) Side view of compact CNx film. Adapted with permission from ref (94). Copyright 2019 Royal Society of Chemistry. (b) Cross-section SEM image of the CNx film. Adapted with permission from ref (95). Copyright 2018 John Wiley & Sons, Inc.
Figure 4
Figure 4
Top (a,c) and side (b,d) views of porous CNx film. Adapted with permission from ref (98). Copyright 2020 Nature Springer.
Figure 5
Figure 5
(a) Band diagram for the ITO/PMPDI/CoOx system. Adapted from ref (107). Copyright 2014 American Chemical Society. (b) Currents with and without illumination, by PTTh-2/ITO glass in 0.1 M Na2SO4 at 0.9 V vs Ag/AgCl. Stars signify “light on”. Stars with crosses through them indicate, “light off”. Adapted with permission from ref (109). Copyright 2012 Wiley-VCH.
Figure 6
Figure 6
Schematic representation of the formation of the hexagonal C60-ZnP(Py)4 rod and the distorted polygonal C60tBu-ZnP(Py)4 rod. Adapted from ref (113). Copyright 2009 American Chemical Society.
Figure 7
Figure 7
Schematic illustration for the construction of 2D/2D CNx/graphdiyne heterojunction on a 3D GDY nanosheet array. Adapted with permission from ref (123). Copyright 2018 Wiley-Blackwell.
Figure 8
Figure 8
(a) Current density vs time of the three electrodes under chopped light illumination in 0.10 M Na2SO4 solution at a bias potential of 0 V vs RHE. (b) The mechanism of PEC H2 generation using the g-C3N4/NiO electrode. Adapted with permission from ref (126). Copyright 2016 Royal Society of Chemistry. (c) Hydrogen production and faradic efficiency of 3D urchin-like ZnO/Au/g-C3N4 and Pt-loaded 3D urchin-like ZnO/Au/g-C3N4 photocathodes. Adapted with permission from ref (127). Copyright 2020 Elsevier. (d) H2 and O2 evolution of the Cu-CN-W photocathode at 0.42 V vs RHE using Pt as the counter electrode. Adapted with permission from ref (128). Copyright 2019 Wiley-VCH.
Figure 9
Figure 9
(a) Hydrogen evolution on a BDT-ETTA COF electrode was quantified with a hydrogen microsensor (Unisense A/S H2-NPLR) with a selective silicone membrane at a static potential of 0.4 V vs RHE. Illumination of the sample with AM1.5 simulated sunlight results in a photocurrent (black) and the production of hydrogen (red). Adapted from ref (132). Copyright 2018 American Chemical Society. (b) Schematic presentation of the EPD setup with a typical COF film SEM cross-section. (c) Dynamic hydrogen evolution measurement under chopped AM1.5G illumination of a BDT-ETTA COF electrode at 0.2 V vs RHE. Adapted from ref (133). Copyright 2019 American Chemical Society. (d) Time course hydrogen evolution using g-C18N3-COF and g-C33N3-COF as catalysts under visible light (λ > 420 nm) irradiation, monitored over 16 h with evacuation every 4 h (dashed line). Adapted from ref (134). Copyright 2019 American Chemical Society.
Figure 10
Figure 10
(a) Transient photocurrent responses of TFBB-TAB and TFBB-TAT under dark and light. Adapted with permission from ref (135). Copyright 2020 Zenodo. (b) Hybrid DFT calculated potentials of frontier orbitals and electronic bandgaps in model TAPB-TTB COF and TTA-TTB COF. Adapted with permission from ref (136). Copyright 2021 Wiley-VCH. (c) Photocurrent–time plots for 2D CCP-Th (red line), 2D CCP-BD (blue line), and 2D C=N COF-B (black line) at 0.3 V versus RHE. On: illumination on; off: illumination off. Adapted with permission from ref (137). Copyright 2021 Wiley-VCH.
Figure 11
Figure 11
(a) Schematic representation of the MOF surface coating on p-Si. EVB and ECB are the energetic positions of the valence and conduction band, respectively, EF,p, and EF,n are the quasi-Fermi levels of the holes and electrons, respectively, Vph is the semiconductor photovoltage, and Efilm is the electrochemical potential of the MOF film. The molecular structure of the linker is pictured on the right. (b) Cyclic voltammograms of Zr(NDI)@FTO (black dashed) and an illuminated Zr(NDI)|TiO2@GaP working electrode (red) at a scan rate of 100 mV s–1 with 0.5 M LiClO4 in DMF as the supporting electrolyte. The red solid data were collected under AM 1.5 illumination. Adapted with permission from ref (139). Copyright 2020 Nature Springer. (c) Schematic showing the photocathode role of csiMOF-6 in a CO2 photoelectrochemical reduction system employing a rhenium electrocatalyst. A green arrow indicates photoexcitation, the purple arrow indicates CT, and the black arrow signifies CO2 reduction to CO. Adapted with permission from ref (140). Copyright 2021 Royal Society of Chemistry.
Figure 12
Figure 12
(a) Electrolysis at a bias potential of +0.16 V vs RHE, with chopped visible light, in H2SO4 (0.5 M). Photocathode: black, P3HT:PCBM; blue, MoS3/P3HT:PCBM; red, TiO2:MoS3/P3HT:PCBM photocathode. Electrode area: 0.5 cm2. Adapted with permission from ref (144). Copyright 2013 Royal Society of Chemistry. (b) Energy level diagram of the device in contact with the electrolyte. Electrons and holes are represented by black and white dots, respectively. Adapted from ref (145). Copyright 2015 American Chemical Society. (c) Hydrogen evolution of the OPEC measured under continuous 1 sun irradiation at 0 V versus RHE registered experimentally (square points) and theoretically calculated from the measured current by Faraday’s law. (d) Device architecture of the optimized organic photoelectrochemical cell (OPEC), showing the electronic process during device operation. Adapted from ref (146). Copyright 2015 American Chemical Society.
Figure 13
Figure 13
(a) Chemical structure of OER1. (b) Light-driven PEC water splitting device, consisting of TiO2-RuP/Nafion-OER1, a Pt cathode, and an aqueous electrolyte. (c) Transient short-circuit current responses to on–off cycles of illumination. The illumination is provided by a light-emitting diode operated in a 0.1 M Na2SO4 aqueous solution in PEC devices without applying any bias. Nafion pH 7.0 represents the related Nafion film prepared using a pH 7.0 Nafion solution, respectively. (d) Oxygen evolution in PEC devices without applying any bias, operated in a pH 7.0 phosphate buffer solution, detected by a Clark electrode, and illuminated by a 500 W xenon lamp through a 400 nm cut-off filter. Complex 1+ indicates the OER1. Adapted with permission from ref (180). Copyright 2010 Royal Society of Chemistry.
Figure 14
Figure 14
(a) Chemical structure and synthesis route of the OER2. (b) Photocurrent of three photoanodes (TiO2+PS, TiO2+PS+OER2, and TiO2+OER2) with a 0.2 V vs NHE external bias in pH 6.8 phosphate buffer solution upon visible light irradiation (λ > 400 nm, 300 mW cm–2). Adapted with permission from ref (184). Copyright 2015 Wiley-VCH. (c) Chemical structures of OER3, RuP, and RuPdvb2+. (d) Schematic diagram of the surface structure following reductive electropolymerization of OER3 on TiO2-RuPdvb2+. (e) Photocurrents of nTiO2-RuPdvb2+ (dashed) and nTiO2-RuPdvb2+-polyOER3 (solid) at a bias of 0.2 V versus SCE. Adapted with permission from ref (186). Copyright 2015 Wiley-VCH.
Figure 15
Figure 15
(a) Structure of OER4. (b) Photocurrent densities of the OER4@Fe2O3 and pristine Fe2O3 in the phosphate buffer (pH 7) with a bias of 0.8 V vs NHE, and under AM 1.5 G illumination (100 mW cm–2). Adapted with permission from ref (189). Copyright 2017 Elsevier. (c) Structures of an OER5 (RuOH22+). (d) Schematic diagram of the surface structure following reductive electropolymerization of RuOH22+ on nTiO2-RuPdvb2+. (e) Variation of surface coverage as a function of irradiation time at 475 mW cm–2 at 455 nm over a 16 h photolysis period in aqueous 0.1 M HClO4. Adapted with permission from ref (190). Copyright 2014 American Chemical Society.
Figure 16
Figure 16
(a) Molecular structures of polystyrene-based PS-Ru and OER6 (RuC). (b) Schematic illustration for fabrication of (b-top) FTO//(SnO2/TiO2)//(PAA/PS-Ru)n and (b-down) FTO//(SnO2/TiO2)//(PAA/PS-Ru)n/(PAA/RuC)m multilayer films. (c) Current–time trace with illumination (1 sun, 100 mW cm–2, 400 nm cutoff filter) of FTO//(SnO2/TiO2)//(PAA/PS-Ru)5/(PAA/RuC)5 photoanode (red) and in the dark (black) in a 0.1 M phosphate buffer at pH 7 with an applied bias of 0.44 V vs NHE. Adapted from ref (193). Copyright 2016 American Chemical Society.
Figure 17
Figure 17
(a) Chemical structure of OER7 (poly-2). (b) Schematic illustration for fabrication of OER7 onto mesoporous substrates. Adapted from ref (195). Copyright 2017 American Chemical Society. (c) Chemical structure of OER8 (Ru4POM) (light blue: W; orange: Ru; gray: Si; and red: O). (d) Schematic representation of the SnO2|KuQ(O)3OH|Ru4POM photoanode for water oxidation (the energy levels are shown for the system at pH = 5.8). Adapted with permission from ref (197). Copyright 2020 Royal Society of Chemistry.
Figure 18
Figure 18
Chemical structures of (a) OER9 (Mn4O4). (b) Charge transfer route. (c) Photocurrent response of the corresponding photoanode. Representative data from conductive FTO coated glass (black), OER9+-Nafion/TiO2 (gray), Nafion/photosensitizer-TiO2 (red), and OER9+-Nafion/photosensitizer-TiO2 (blue), illuminated at 100 mW/cm2 through a series of long-pass light filters as labeled. Adapted from ref (200). Copyright 2010 American Chemical Society. (d) OER10 (Mn porphyrin; Ar = 4-tBuC6H4, 2,4,6-Me3C6H2, or C6F5). Adapted with permission from ref (109). Copyright 2012 Wiley-VCH. (e) OER11 (Co4O4). Adapted with permission from ref (202). Copyright 2017 Royal Society of Chemistry.
Figure 19
Figure 19
(a) Schematic of TiO2-PH hybrid photoanode. (b) Simplified potential scheme illustrating the TiO2-PH photoanode under visible light with a cocatalyst. (c) O2 evolution of the TiO2-PH photoanode without a cocatalyst, with CoO(OH)x or Co-Pi cocatalysts. Adapted from ref (211). Copyright 2017 American Chemical Society.
Figure 20
Figure 20
Chemical structure (marked by red circle) of (a) cobaloxime (HER1, Co(dmgH2)(dmgH)Cl2). (b) Boron difluoride modified HER1 (HER2). (c) Linear sweep voltammograms (LSVs) of GaP (blue dash), HER1 loaded GaP (red), and HER2 loaded GaP (green) recorded at pH 7. (d) Recorded at pH 4.5 under simulated AM 1.5 illumination. Adapted from ref (223). Copyright 2014 American Chemical Society. (e) Cobalt porphyrin (HER3, CoTTP). (f) LSV of HER3 loaded GaP at pH 7 under simulated AM 1.5 illumination. Adapted from ref (226). Copyright 2017 American Chemical Society.
Figure 21
Figure 21
(a, top) Preparation of the OPV-based PEC electrode with a Co catalyst by “click” chemistry. (a, down) The energy level diagram depicts the relevant energy levels under flat band conditions of all materials used in the photocathode. (b) Chemical structure of Co-N3 (HER4). (c) Transient photocurrent response curves of the OPV photocathodes with and without the Co catalyst. Adapted with permission from ref (231). Copyright 2015 Royal Society of Chemistry.
Figure 22
Figure 22
(a) Molecular structures of PilT, poly(diallyldimethylammonium chloride) (PDDA), and polyacrylatestabilized Pt nanoparticles (PAA-Pt). (b) Schematic illustration of fabrication of FTO//IOnITO//(PDDA/PilT)10//(PDDA/PAAPt)10. (c) Current–time traces with illumination on FTO//IO nITO//(PDDA/PiIT)10 (black) and FTO//IO nITO//(PDDA/PiIT)10//(PDDA/PAA-Pt)10 (red) in 0.1 M acetate buffer, 0.4 M NaClO4, at pH 4.5 with an applied bias of −0.4 V versus Ag/AgCl. (d) H2 production versus time. (e) Proposed mechanism for charge generation/separation in PiIT/PAA-Pt films. Adapted with permission from ref (233). Copyright 2018 American Chemical Society.
Figure 23
Figure 23
(a) Photocurrent density of the photocathodes vs the applied voltage. (b) Prolonged Jt curves of the photocathodes at a bias potential of 0 V vs RHE. Adapted with permission from ref (234). Copyright 2018 Royal Society of Chemistry. (c) Chopped photocurrent density comparison of photoanodes with or without a TiO2 layer. Adapted with permission from ref (148). Copyright 2016 Royal Society of Chemistry.
Figure 24
Figure 24
(a) Chemical structure of CRR1. (b) Schematic energy diagram of an RCP/p-InP-Zn electrode under visible-light irradiation. Adapted with permission from ref (253). Copyright 2010 Royal Society of Chemistry. (c) Chemical structure of CRR2. Adapted with permission from ref (256). Copyright 2016 Royal Society of Chemistry.
Figure 25
Figure 25
(a) Chemical structure of CRR3. (b) Preparation of the poly-RuRe/NiO electrode by electropolymerization. (c) Photoelectrochemical CO2 reduction system using H2O as a reductant. (d) Time courses of CO (red ▲), H2 (blue ●), HCOOH (green ■), and half amounts of electrons (black line) passed through the poly-RuRe/NiO (2.5 cm–2) at E = −0.7 V vs Ag/AgCl under irradiation at λex > 460 nm. CO2 purged 50 mM NaHCO3 (aq) (pH 6.6) was used as an electrolyte. Adapted from ref (159). Copyright 2019 American Chemical Society.
Figure 26
Figure 26
(a) Molecular structures for the surface bridge (Si), the chromophore (RuII), and the catalyst (ReI). (b–d) Possible surface assembly structures on NiO|Si–poly(RuII)–poly(ReI). Adapted from ref (160). Copyright 2019 American Chemical Society.
Figure 27
Figure 27
(a) EC-Raman spectra of pDET/Cu under 647 nm laser excitation. (b) EC-Raman spectra of pDET under 594 nm laser excitation. (c) Potential-dependent currents for HER as a function of excitation wavelength. (d) Photoelectrocatalytic reaction scheme for photoinduced hydrogen evolution. Adapted with permission from ref (308). Copyright 2021 Royal Society of Chemistry.
Figure 28
Figure 28
(a) Photoluminescence spectra of RR-P3HT films (a spectrum of the dry film in red and a spectrum of the film in contact with 0.1 M H2SO4 in black) at 550 nm excitation wavelength. (b) Proposed mechanism of RR-P3HT photocathodic activity in an aqueous solution. Adapted with permission from ref (143). Copyright 2013 Royal Society of Chemistry.
Figure 29
Figure 29
(a) Nyquist plots of G-CN and s-BCN obtained by applying a sine wave with amplitude of 5.0 mV over the frequency range from 10 kHz to 0.1 Hz. Inset: Periodic on/off photocurrent response of G-CN and s-BCN electrodes in 0.1m Na2SO4 with 0 V bias versus Ag/AgCl. (b) Potential dependence of the rate constant kt and kr for s-BCN and G-CN samples. Illumination: 365 nm UV light. Adapted with permission from ref (104). Copyright 2017 Wiley-VCH.
Figure 30
Figure 30
(a) Transient photocurrent density and (b) EIS spectra measured at 1.23 V versus RHE under light illumination of the CN films prepared using different amounts of dicyanamide. Adapted with permission from ref (87). Copyright 2017 Elsevier.
Figure 31
Figure 31
(a) Nyquist plot of the CN films at 1.23 V vs RHE in dark condition. (b) Photocurrent of the CN films at 1.23 V vs RHE in 0.1 M KOH aqueous solution under one sun. (c) Energy diagram of the g-CN(0)/g-CN(0.1)/FTO junction. Adapted with permission from ref (96). Copyright 2018 Wiley-VCH.
Figure 32
Figure 32
Open circuit voltage decay (OCVD) plots of (a) bulk CNx, (b) compact CNx, and (c) porous CNx with 150 W xenon lamp illumination from the electrolyte–electrode (EE) side. (d) Calculated average charge lifetimes in the g-C3N4 films. (Generated photovoltage ΔV is the difference in voltage between dark and illumination conditions). Adapted with permission from ref (94). Copyright 2019 Royal Society of Chemistry.
Figure 33
Figure 33
TAS kinetics of ref-g-C3N4, def-g-C3N4-1, def-g-C3N4-2, and def-g-C3N4-5 samples under N2 atmosphere after 355 nm excitation (200 Hz, 850 μJ/cm2/pulse), monitored with a 660 nm probe. Adapted from ref (122). Copyright 2020 American Chemical Society.
Figure 34
Figure 34
(a) TAS spectra (delay time unspecified) of a CNx film soaked in different aqueous solutions. (b) TAS decay of a CNx film soaked in 0.1 M KOH, and 0.1 M KOH containing a 10% TEOA aqueous solution monitored at 850 nm. Adapted with permission from ref (95). Copyright 2018 Wiley-VCH.
Figure 35
Figure 35
Relaxation of an injected charge carrier as a function of time in Gaussian DOS (left). Adapted with permission from ref (351). Copyright 1993 Wiley-VCH. Hopping transport of injected charge carrier via the states at thermal energy in Gaussian DOS (middle) and space (right). Adapted with permission from ref (354). Copyright 2021 IOP Publishing, Ltd.
Figure 36
Figure 36
Simulated and experimental average mobilities of the diketopyrrolopyrrole-naphthalene copolymer (PDPP-TNT) for various temperatures. Adapted with permission from. Copyright 2020 American Institute of Physics.

References

    1. Hall D. O.; Rao K.. Photosynthesis; Cambridge University Press, 1999.
    1. Ahmad T.; Zhang D. A Critical Review of Comparative Global Historical Energy Consumption and Future Demand: The Story Told so Far. Energy Rep. 2020, 6, 1973–1991. 10.1016/j.egyr.2020.07.020. - DOI
    1. Saunders N.; Chapman S.. Fossil Fuel; Raintree, 2005.
    1. Lewis N. S. Research Opportunities to Advance Solar Energy Utilization. Science 2016, 351 (6271), aad1920. 10.1126/science.aad1920. - DOI - PubMed
    1. Global Energy Transformation: A Roadmap to 2050; IRENA, 2019.