. 2022 Sep 1;206(5):608-624.
doi: 10.1164/rccm.202110-2274OC.

Macrophage-NLRP3 Activation Promotes Right Ventricle Failure in Pulmonary Arterial Hypertension

Affiliations

Macrophage-NLRP3 Activation Promotes Right Ventricle Failure in Pulmonary Arterial Hypertension

Ruaa Al-Qazazi et al. Am J Respir Crit Care Med. .

Abstract

Rationale: Pulmonary arterial hypertension (PAH) often results in death from right ventricular failure (RVF). NLRP3 (nucleotide-binding domain, leucine-rich-containing family, pyrin domain-containing-3)-macrophage activation may promote RVF in PAH. Objectives: Evaluating the contribution of the NLRP3 inflammasome in RV macrophages to PAH RVF. Methods: Rats with decompensated RV hypertrophy (monocrotaline [MCT] and Sugen-5416 hypoxia [SuHx]) were compared with compensated RV hypertrophy rats (pulmonary artery banding). Echocardiography and right heart catheterization were performed. Macrophages, atrial natriuretic peptides, and fibrosis were evaluated by microscopy or flow cytometry. NLRP3 inflammasome activation and cardiotoxicity were confirmed by immunoblot and in vitro strategies. MCT rats were treated with SC-144 (a GP130 antagonist) or MCC950 (an NLRP3 inhibitor). Macrophage-NLRP3 activity was evaluated in patients with PAH RVF. Measurements and Main Results: Macrophages, fibrosis, and atrial natriuretic peptides were increased in MCT and SuHx RVs but not in left ventricles or pulmonary artery banding rats. Although MCT RV macrophages were inflammatory, lung macrophages were antiinflammatory. CCR2+ macrophages (monocyte-derived) were increased in MCT and SuHx RVs and highly expressed NLRP3. The macrophage-NLRP3 pathway was upregulated in patients with PAH with decompensated RVs. Cultured MCT monocytes showed NLRP3 activation, and in coculture experiments resulted in cardiomyocyte mitochondrial damage, which MCC950 prevented. In vivo, MCC950 reduced NLRP3 activation and regressed pulmonary vascular disease and RVF. SC-144 reduced RV macrophages and NLRP3 content, prevented STAT3 (signal transducer and activator of transcription 3) activation, and improved RV function without regressing pulmonary vascular disease. Conclusions: NLRP3-macrophage activation occurs in the decompensated RV in preclinical PAH models and patients with PAH. Inhibiting GP130 or NLRP3 signaling improves RV function. The concept that PAH RVF results from RV inflammation rather than solely from elevated RV afterload suggests a new therapeutic paradigm.

Keywords: CCR2; IL-1β; MCC950; SC-144; mitochondrial fission.


Figures
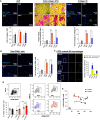
Figure 1.
Figure 1.
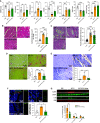
An increase in right ventricle (RV) macrophages is associated with worsening RV function and increased RV fibrosis in pulmonary arterial hypertension. (A) The mean fluorescence intensity of atrial natriuretic peptide (ANP; Alexa-fluor 647; red) was measured per cardiomyocyte via confocal microscopy, and a fold of change analysis shows that it is significantly high in 4-week monocrotaline (MCT) RV compared with control samples (n = 5/group; P = 0.003). The fold of change of total collagen deposition [Picrosirius red stain (PS)] was higher in the RV of 4-week MCT and SuHx (Sugen-5416 hypoxia) (n = 5/group; P = 0.0001 and P = 0.0078) compared with control samples. The total collagen deposition was significantly higher in MCT and SuHx compared with pulmonary artery banding (PAB) rats (P = 0.0001 and P = 0.008, respectively). Collagen-III (Alexa-fluor 488; green) expression was higher in 4-week MCT RVs and SuHx RVs compared with control samples (n = 5/group; P = 0.0001 and P = 0.0078). PAB RVs had a significantly lower collagen-III signal compared with MCT (P = 0.0004) and SuHx (P = 0.02) rats. Two-way ANOVA test was used to compare treatment (control vs. treated groups) and type of treatment (PAB vs. MCT vs. SuHx). (B) In situ quantification of macrophages (CD68+ cells) via confocal microscope showed a fivefold increase in 4-week MCT RVs compared with PBS RVs (P = 0.0001). A similar increase in RV macrophages was observed in SuHx rats (fourfold increase; P = 0.004), whereas the number of CD68+ cells in the PAB RVs did not significantly differ from control samples. The incidence of RV macrophages in MCT RVs (P = 0.0001) and SuHx RVs (P = 0.0014) was significantly higher than in PAB RVs. No significant differences were found when MCT and SuHx were compared regarding the number of RV CD68+ cells. Scale bars, 40 μm. (C) Quantification of monocyte-derived (CCR2+CD68+) and tissue-resident (CCR2+D68+) macrophages in RVs from MCT and SuHx rats. Compared with control samples [PBS and Vehicle-normoxia (VeNx)], both MCT and SuHx RVs had a significant increase in monocyte-derived (MCT vs. PBS, P = 0.035; SuHx vs. VeNx, P = 0.007) and tissue-resident macrophages (MCT vs. PBS, P = 0.035; SuHx vs. VeNx, P = 0.007). Monocyte-derived macrophage was the predominant subset in MCT RVs (CCR2+: 57.77±27.56 vs. CCR2+: 33.93±10.66 macrophages per 0.3025 mm2), whereas in SuHx RVs, monocyte-derived and tissue-resident macrophages had similar incidence (CCR21: 17.4±2.48 vs. CCR22: 22.39±2.74). Two-way ANOVA test was used to compare treatment (control vs. treated groups) and type of treatment (PAB vs. MCT vs. SuHx). Scale bars, 50 μm. (D) Flow cytometric analysis of live MCT and PAB RV macrophages (CD45+CD68+ cells) collected from RV single-cell suspension (PAB, 3 weeks: n = 4/group; 4 weeks: n = 6/group MCT rats) also confirmed the increase of RV macrophages in both 3- and 4-week MCT rats (P = 0.0286 and P = 0.0022), but not in the PAB rats compared with control samples. The incidence of macrophages in the RV increased as the MCT-induced disease progressed from 3 to 4 weeks (P = 0.0095). Two-way ANOVA test was used to compare treatment (control vs. treated groups) and type of treatment (3 weeks vs. 4 weeks MCT vs. PAB). (E) Correlation analysis of cardiac output and the number of RV macrophages shows an inverse correlation between the two variables, stronger at Week 4 than at Week 3 (3 weeks: r2 = 0.293; P = 0.165; 4 weeks: r2 = 0.483; P = 0.017). ANP = atrial natriuretic peptide; FSC = forward scatter; PS = Picrosirius stain; SSC = side scatter; SuHx = Sugen-5416 hypoxia; VeNx = vehicle-normoxia. *P ⩽ 0.05, **P ⩽ 0.01, and ***P ⩽ 0.001.
Figure 2.
Figure 2.
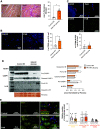
Increased number of RV macrophages in PAH-rat models is marked by an increase in NLRP3 inflammasome activity. (A) Baseline flow cytometric assessment of NLRP3 content (n = 4 rats) showing higher relative expression [staining index (SI)] of NLRP3 in rat RV-macrophages (CD45+CD68+) compared to all other cell types, including: other immune cells (CD45+CD68; p = 0.017), endothelial cells (CD45-CD31+; P = 0.005) and fibroblast (CD45CD90+; P = 0.008). (B) Double immunofluorescence detecting CD68 (Alexa Fluor 555; red) and NLRP3 (Alexa Fluor 488; green) in RV tissue of MCT, SuHx and control rats [PBS and Vehicle-normoxia (VeNx)]. The quantification of the relative incidence of CD68+NLRP3+ cells (normalized by total CD68+ cells) revealed an increased number of macrophages expressing NLRP3 in the RV of MCT and SuHx rats compared to controls (P = 0.011, 0.0073). No differences in the incidence of these cells were found when MCT and SuHx rats were compared. Scale bars, 40 μm. (C) Western blot analysis (n = 8 MCT, 9 PBS, 4 PAB and 4 Sham) showed activation of the NLRP3 pathway in MCT but not PAB RVs. NLRP3, cleaved CASP1 and cleaved IL-1β content were significantly higher in MCT-RVs compared to the control group (p = 0.036, 0.028, 0.028, respectively). No significant differences in NLRP3 and cleaved CASP1 were found when comparing PAB-RVs to their controls (sham) (P = 0.281 and P = 0.111 respectively), while cleaved-IL1B was undetectable (red box). The content of target proteins was normalized to vinculin. (D) In vitro culture of blood monocytes isolated from PBMCs of MCT and control rats; (n = 3 rats/group) were challenged with nigericin (10 min) in the presence or absence of MCC950. The NLRP3 and ASC interaction (which indicates inflammasome assembly) was measured using antibodies against NLRP3 (yellow) and ASC (Apoptosis-associated speck-like protein containing a CARD) (red) and imaged via super-resolution microscopy. NLRP3:ASC interaction was significantly higher in monocytes from MCT (P = 0.0197) vs. PBS rats after nigericin treatment. MCC950 significantly reduced the NLRP3:ASC interaction (P = 0.0403). Scale bars, 5 μm. Contra-stain: phalloidin (green) and DAPI (blue). SI = staining index; VeNx = vehicle-normoxia. *P ⩽ 0.05 and **P ⩽ 0.01.
Figure 3.
Figure 3.
SC-144 improves cardiac function, reduces RV macrophage number, and suppresses NLRP3 inflammasome and STAT3 activation. (A) GP130 Antagonism improves indicators of RV function in MCT rats when compared to MCT rats treated with vehicle (MCT-V): TAPSE, cardiac output, RVFWT, end-systolic elastance (Ees) to effective arterial elastance (Ea) (Ees/Ea) (P = 0.004, 0.030, and 0.0001, respectively; n = 8–10/group). While cardiac function was preserved with the GP130 antagonist, there was no difference in Ees, PAAT, and RVSP when comparing the MCT-GP130 Antagonist treated group with the MCT-V group. (B) Histological assessment of RV cardiomyocyte hypertrophy using H&E staining (cardiomyocyte area μm2; n = 3 rats/group and >94 cardiomyocytes/rat). GP130 antagonist treatment reversed RV cardiomyocyte hypertrophy in MCT rats (MCT-V vs. MCT-Antagonist P < 0.0001; average area per image; 15 images per rat). Scale bars, 20 μm. (C) Histological Assessment of the median wall thickness of pulmonary arterioles using H&E staining (n = 3 rats/group and >20 arterioles/rat). The GP130 antagonist SC-144 failed to ameliorate the arteries’ thickness in MCT-rats (Control vs. MCT-V P = 0.013; MCT-V vs. MCT-GP130 P > 0.999). Scale bars, 20 μm. (D) Fibrosis assessment using Picrosirius red staining showed a reduction in the percentage of collagen deposition in an area (n = 9 rats/group) in the GP130 antagonist (MCT-GP130 Antagonist) compared to the vehicle group (MCT-V; P = 0.0183). Scale bars, 100 μm. (E) Macrophages (CD68+cells per 0.09 mm2) in the RVs of PBS, MCT-V and MCT-GP130 Antagonist groups were identified using a light microscope (n = 9 rats/group). The quantification revealed a significant reduction in the number of CD68+ cells in MCT-RV when the rats were treated with a GP130 antagonist compared to the vehicle control (P = 0.0183). Scale bars, 50 μm. (F) Identification and quantification of p-STAT3+ (Alexa Fluor 488; green) and macrophages (CD68+; Alexa Fluor 555; red) using immunofluorescence. The GP130 antagonist treatment significantly decreased the number of p-STAT3+CD68+ relative to the total number of CD68+ macrophages in MCT rats compared to vehicle control (P = 0.0499). Scale bars, 40 μm. (G) Western blot assay showed a significantly lower content of NLRP3 and pro-CASP1 (P = 0.0286 and 0.0571) in the RVs of MCT rats treated with GP130 antagonist compared to vehicle controls (n = 4 rats/group). The content of target proteins was normalized to the intensity of Coomassie Brilliant Blue (CBB; total protein). The cleaved forms of CASP1 and IL-1β were not detected in this experiment. Antag = antagonist; CBB = Coomassie Brilliant Blue; CO = cardiac output; Ea = effective arterial elastance; Ees = end-systolic elastance; ns = not significant; PAAT = pulmonary artery acceleration time; RVFWT-diast = right ventricular free wall thickness in diastole; RVSP = right ventricular systolic pressure; TAPSE = tricuspid annular plane systolic excursion. *P ⩽ 0.05, **P ⩽ 0.01, ***P ⩽ 0.001, and ****P ⩽ 0.0001.
Figure 4.
Figure 4.
MCC950 inhibits NLRP3 (nucleotide-binding domain, leucine-rich-containing family, pyrin domain-containing-3) inflammasome activation, reduces mitochondrial damage in cardiomyocytes, and improves right ventricle (RV) function in pulmonary arterial hypertension. (A) The cardiac function in MCC950-treated group, assessed by cardiac ultrasound, was improved in the MCT-MCC950 group compared with monocrotaline (MCT) rats treated with vehicle (MCT-V) (n = 8 PBS, 8 MCT-V, and 11 MCT-MCC950), as demonstrated by increased tricuspid annular plane systolic excursion (P = 0.016), cardiac output (P = 0.042), and cardiac index (P = 0.025). A reduction of the Fulton index and RV free wall thickness is shown but is not significant (P = 0.076 and P = 0.125). Ventricular-to-arterial coupling was also improved and assessed by measuring the ratio of tricuspid annular plane systolic excursion to RV systolic pressure (P= 0.0146). There was also a significant improvement in RV systolic pressure (P = 0.043) and pulmonary artery acceleration time (P = 0.022). (B) Histological assessment of the pulmonary arterioles using hematoxylin and eosin staining (n = 3 rats/group and more than 20 arterioles/rat). The percent median wall thickness of the pulmonary arteries was measured, and MCC950 treatment reduced the percentage of medial thickness it in MCT rats compared with control samples (P < 0.0001 comparing rats or arterioles). Scale bars, 20 μm. (C) Western blot assay showing a significantly lower expression of NLRP3 (P = 0.035) and cleaved IL-1β (P = 0.0082) in the RVs of MCT rats treated with MCC950 compared with vehicle control samples (n = 5 PBS, 6 MCT-V, and 7 MCT-MCC950 rats). The content of target proteins was normalized with vinculin. (D) Fibrosis assessment using picrosirius red staining showed a nonsignificant reduction in collagen deposition (percentage per image) in the MCC950 group compared with vehicle control samples (P = 0.1611). Scale bars, 100 μm. (E) Identification and quantification of macrophages (CD68+ cells per 0.3025 mm2) in the RVs of PBS, MCT-V, and MCT-MCC950 groups. No differences were found between MCT-V– and MCT-MCC950–treated groups (P = 0.843), whereas there was a difference between PBS versus MCT-V (P = 0.0264). Scale bars, 40 μm. (F) Assessment of neonatal cardiomyocyte number and degree of hypertrophy when cocultured with enriched monocytes from PBS, MCT-V, and MCT-MCC950 rats. The number of cardiomyocytes cocultured with MCT monocytes was significantly reduced after 48 hours of coculture (P = 0.019), whereas the cell number in cardiomyocytes cocultured with MCT-MCC950–derived monocytes were comparable to PBS-derived monocytes (MCT vs. MCT-MCC950, P < 0.0001 at 48 hours; PBS vs. MCT-MCC950, no significant difference). A significant increase in area was observed in cardiomyocytes cocultured with MCT-derived monocytes groups compared with PBS (P < 0.0001 at 24 hours and P < 0.0001 at 48 hours) and MCT-MCC950 (P = 0.0026 at 24 hours and P < 0.0001 at 48 hours). Scale bars, 150 μm. (G) Mitochondrial dysfunction was induced in cardiomyocytes cocultured with MCT-derived monocytes, evidenced by reduced membrane potential using tetramethylrhodamine methyl ester (TMRM) (PBS vs. MCT, P = 0.005) and pathological mitochondria fragmentation (PBS vs. MCT, increased punctate morphology, P < 0.0001; and decreased filamentous morphology, P < 0.0001). These adverse effects were prevented by in vivo treatment of rats with MCC950 (MCT vs. MCT-MCC950 punctate morphology, P = 0.0007; and filamentous morphology, P < 0.013). CO = cardiac output; MFI = mean fluorescence intensity; PAAT = pulmonary artery acceleration time; RVFWT-diast = right ventricular free wall thickness in diastole; RVSP = right ventricular systolic pressure; TAPSE = tricuspid annular plane systolic excursion; TMRM = tetramethylrhodamine methyl ester. *P ⩽ 0.05, **P ⩽ 0.01, ***P ⩽ 0.001, and ****P ⩽ 0.0001.
Figure 5.
Figure 5.
Increased incidence of macrophages and NLRP3 (nucleotide-binding domain, leucine-rich-containing family, pyrin domain-containing-3) inflammasome activation in the right ventricle (RV) from patients with pulmonary arterial hypertension (PAH) with decompensated (decomp) RVs. (A) Collagen deposition assessment of PAH RV tissue using picrosirius red staining (n = 8 PAH and 4 control samples) demonstrated that PAH RV tissue was significantly richer in collagen compared with control RV tissue (P = 0.002). Scale bars, 100 μm. (B) Identification and quantification of human RV macrophages (CD68+ cells per 0.18 mm2) showing a significantly higher incidence of macrophages in the PAH group compared with control samples (P = 0.029; n = 8 PAH and 4 control samples). Scale bars, 50 μm. (C) Identification and quantification of human RV macrophages expressing NLRP3 (CD68+, red; NLRP3+, green). A nonsignificant increase in the number of RV macrophages expressing NLRP3 was detected (P = 0.713). Scale bars, 20 μm. (D) Assessment of NLRP3, CASP1, and IL-1β content of human PAH RV using Western blot. Pro- and cleaved IL-1β are significantly increased in PAH RV compared with control samples (P = 0.012 and P= 0.040; n = 3/group). The content of target proteins was normalized using the Ponceau stain (total protein). (E) Immunofluorescence staining was used to detect p-STAT3 (signal transducer and activator of transcription 3) (green), GP130 (yellow), and macrophages (CD68, red). The macrophages subsets: GP130+p-STAT3+CD68+, GP130+p-STAT3CD68+, and GP130 p-STAT3+CD68+ were quantified, but no subset differences were detected when comparing control and PAH RV tissue. Scale bars, 40 μm. Decomp = decompensated. *P ⩽ 0.05, **P ⩽ 0.01, and ***P ⩽ 0.001.
Figure 6.
Figure 6.
Distinctive M2 polarization of lung macrophages is consistent with regional heterogeneity in macrophage polarization between the right ventricle (RV) and the lung in pulmonary arterial hypertension. (A) Flow cytometric assessment of live lung macrophages (CD45+CD68+) of monocrotaline (MCT)-treated and pulmonary arterial banding rats (n = 4/group). The incidence of macrophages was at its highest degree in the lungs of MCT-treated rats at Week 3 after receiving MCT versus PBS control samples (a fold of change, P = 0.033), MCT at 4 weeks (P = 0.068), and pulmonary arterial banding rats (P = 0.092). The comparison between 3 and 4 weeks of MCT showed no significant differences. Two-way ANOVA test was used to compare treatment (control vs. treated groups) and type of treatment (3 weeks vs. 4 weeks MCT). (B) The polarization of lung macrophages was determined on the basis of the degree of expression [staining index (SI)] of the M2-like macrophage markers ARG1 (Alexa-fluor 405) and CD163 [allophycocyanin (APC)], and the M1-like macrophage marker NOS2 [phycoerythrin (PE)]. There was an increase in the expression of CD163 (P= 0.039) and ARG1 (P = 0.002) at 4 weeks after MCT injection, whereas the percentage of NOS2 expressing macrophages in the MCT lung was reduced at 3 weeks (P = 0.014). (C) Classical (CD3/B220/His48lo/CD43hi) and nonclassical (CD3/B220/His48lo/CD43lo) blood monocytes incidence were measured using flow cytometry (n = 5/group). MCT significantly increased the incidence of both monocyte subsets (P = 0.004 and P = 0.021, respectively). APC = allophycocyanin; FITC = fluorescein isothiocyanate; FSC = forward scatter; PAB = pulmonary artery banding; PE = phycoerythrin; SI = staining index; SSC = side scatter. *P ⩽ 0.05, **P ⩽ 0.01, and ***P ⩽ 0.001.
Figure 7.
Figure 7.
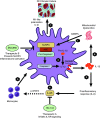
Pulmonary arterial hypertension (PAH) right ventricle failure (RVF) is triggered by macrophage–NLRP3 (nucleotide-binding domain, leucine-rich-containing family, pyrin domain-containing-3) activation and can be targeted by GP130 antagonism or NLRP3 inhibition. Proposed mechanism of NLRP3 activation in RVF in PAH: the activation of the NLRP3 inflammasome pathway in RV macrophages is triggered by mitochondrial dysfunction in cardiomyocytes [source of damage-associated molecular patterns (DAMPs)] (1) leading to NLRP3 inflammasome assembling with Apoptosis-associated speck-like protein containing a CARD (ASC), (2) the activation of gasdermin (GSDMD) pore formation and release of IL-1β. IL-1β induces RV proinflammatory response, including the secretion of other inflammatory cytokines such as IL-6 (3). The IL-6 downstream signaling via p-STAT3 (signal transducer and activator of transcription 3) in monocytes (4) participates in the recruitment of new monocytes/macrophages to the RV (5). The chronic secretion of RV IL-1β contributes to mitochondria dysfunction (6), fibrosis, and RVF (7). This study proposed two therapeutic approaches to cease the inflammatory process: SC-144, an inhibitor of GP130 (a signal-transducing component of the IL-6 cytokine family; therapeutic A), and MCC950 (a specific inhibitor of the NLRP3 inflammasome; therapeutic B). ASC = apoptosis-associated speck-like protein; DAMP = damage-associated molecular patterns; GSDMD = gasdermin D.

Comment in

References

    1. Simonneau G, Hoeper MM. The revised definition of pulmonary hypertension: exploring the impact on patient management. Eur Heart J Suppl . 2019;21:K4–K8. - PMC - PubMed
    1. Vonk-Noordegraaf A, Haddad F, Chin KM, Forfia PR, Kawut SM, Lumens J, et al. Right heart adaptation to pulmonary arterial hypertension: physiology and pathobiology. J Am Coll Cardiol . 2013;62:D22–D33. - PubMed
    1. Ryan JJ, Huston J, Kutty S, Hatton ND, Bowman L, Tian L, et al. Right ventricular adaptation and failure in pulmonary arterial hypertension. Can J Cardiol . 2015;31:391–406. - PMC - PubMed
    1. Tian L, Wu D, Dasgupta A, Chen KH, Mewburn J, Potus F, et al. Epigenetic metabolic reprogramming of right ventricular fibroblasts in pulmonary arterial hypertension: a pyruvate dehydrogenase kinase-dependent shift in mitochondrial metabolism promotes right ventricular fibrosis. Circ Res . 2020;126:1723–1745. - PMC - PubMed
    1. Potus F, Pauciulo MW, Cook EK, Zhu N, Hsieh A, Welch CL, et al. Novel mutations and decreased expression of the epigenetic regulator TET2 in pulmonary arterial hypertension. Circulation . 2020;141:1986–2000. - PMC - PubMed

Publication types