

Ecological Sustainability Assessment of Water Distribution for the Maintenance of Ecosystems, their Services and Biodiversity
- PMID: 35699739
- PMCID: PMC9252940
- DOI: 10.1007/s00267-022-01662-3
Ecological Sustainability Assessment of Water Distribution for the Maintenance of Ecosystems, their Services and Biodiversity
Abstract
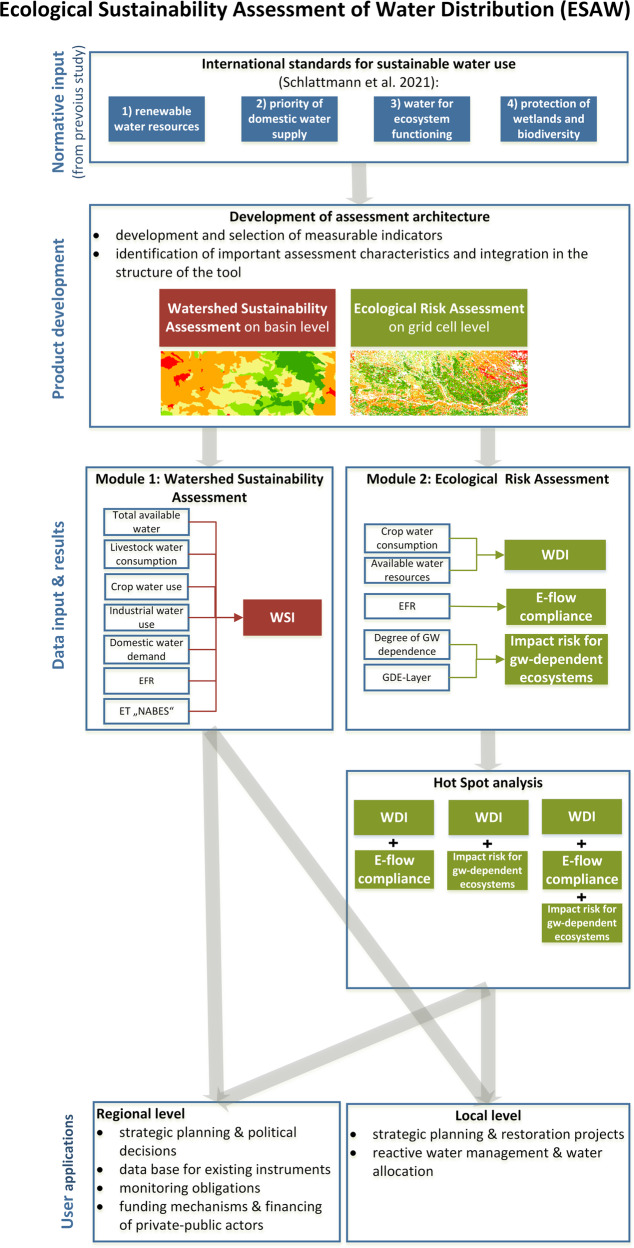
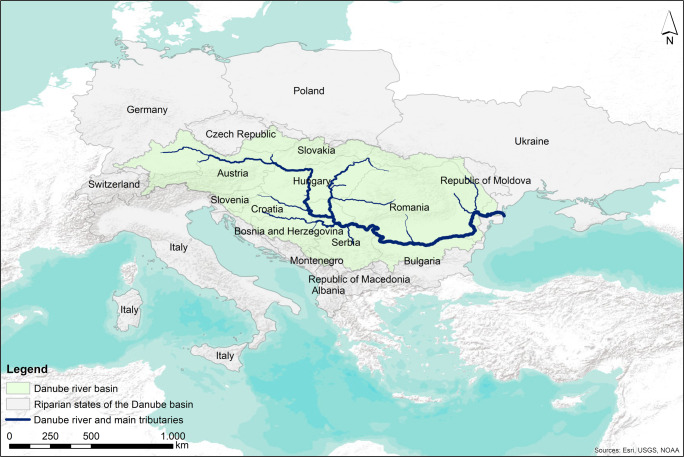
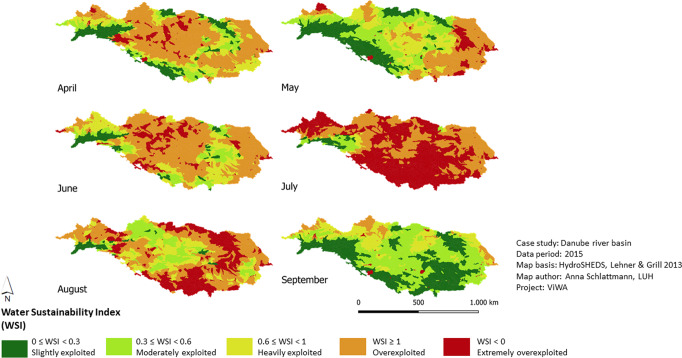
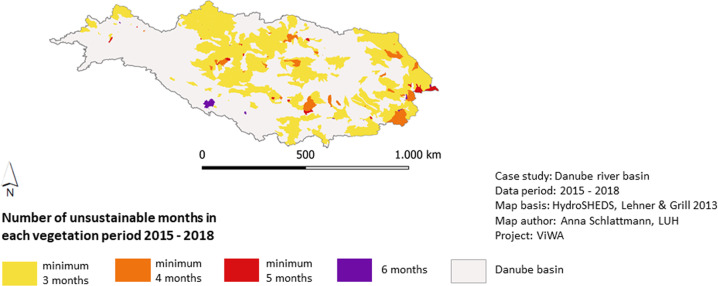
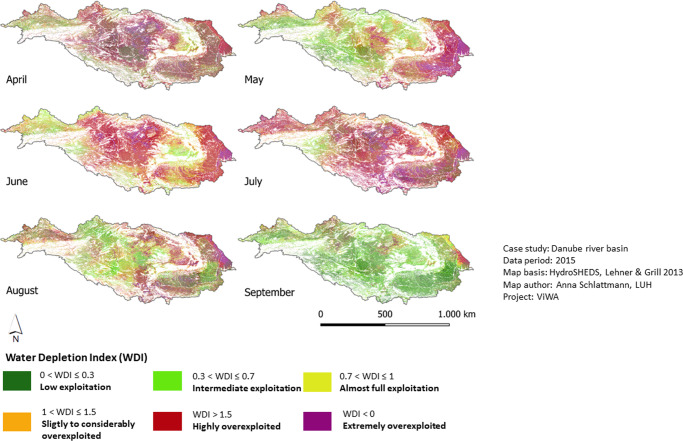
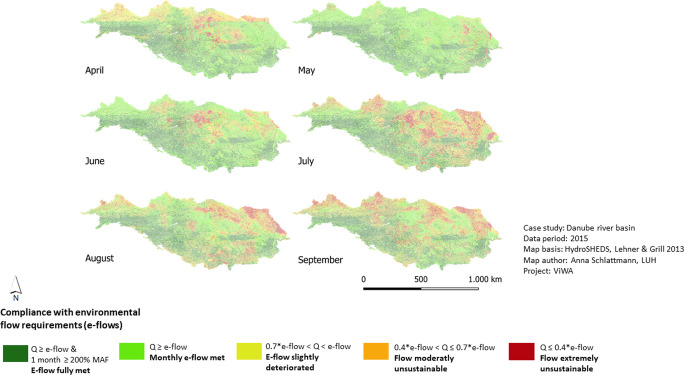
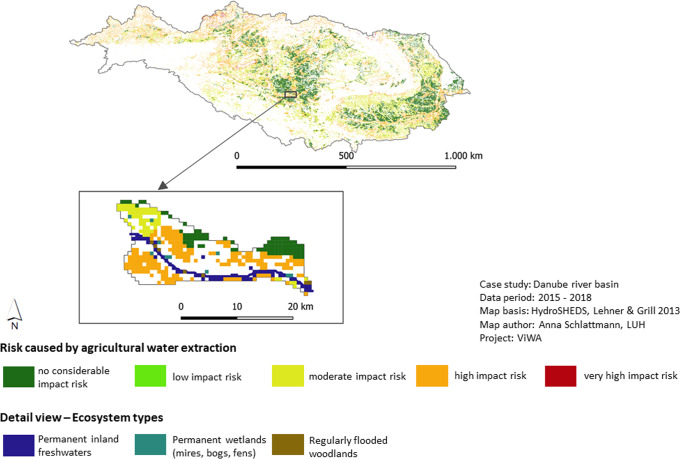
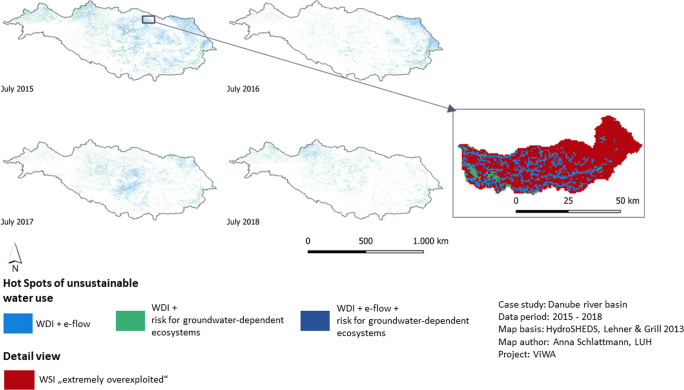
Water provision and distribution are subject to conflicts between users worldwide, with agriculture as a major driver of discords. Water sensitive ecosystems and their services are often impaired by man-made water shortage. Nevertheless, they are not sufficiently included in sustainability or risk assessments and neglected when it comes to distribution of available water resources. The herein presented contribution to the Sustainable Development Goals Clean Water and Sanitation (SDG 6) and Life on Land (SDG 15) is the Ecological Sustainability Assessment of Water distribution (ESAW-tool). The ESAW-tool introduces a watershed sustainability assessment that evaluates the sustainability of the water supply-demand ratio on basin level, where domestic water use and the water requirements of ecosystems are considered as most important water users. An ecological risk assessment estimates potential impacts of agricultural depletion of renewable water resources on (ground)water-dependent ecosystems. The ESAW-tool works in standard GIS applications and is applicable in basins worldwide with a set of broadly available input data. The ESAW-tool is tested in the Danube river basin through combination of high-resolution hydro-agroecological model data (hydrological land surface process model PROMET and groundwater model OpenGeoSys) and further freely available data (water use, biodiversity and wetlands maps). Based on the results, measures for more sustainable water management can be deduced, such as increase of rainfed agriculture near vulnerable ecosystems or change of certain crops. The tool can support decision making of authorities from local to national level as well as private enterprises who want to improve the sustainability of their supply chains.
Keywords: Biodiversity; Ecosystem Services; GIS; SDGs; Sustainability assessment; Water distribution.
© 2022. The Author(s).
Conflict of interest statement
The authors declare no competing interests.
Figures
References
-
- Albert C, Galler C, Hermes J, Neuendorf F, von Haaren C, Lovett A. Applying ecosystem services indicators in landscape planning and management, The ES-in-Planning framework. Ecol Indic. 2016;61:100–113. doi: 10.1016/j.ecolind.2015.03.029. - DOI
-
- Beaumont P. The 1997 UN Convention on the Law of Non-navigational Uses of International Watercourses: Its Strengths and Weaknesses from a Water Management Perspective and the Need for New Workable Guidelines. Int J Water Resour Dev. 2000;16:475–495. doi: 10.1080/713672536. - DOI
-
- Bell S, Driscoll C (2006) Vegetation of the Tomago and Tomaree Sandbeds. Port Stephens, New South Wales, https://www.researchgate.net/publication/274329074_Vegetation_of_the_Tom.... Accessed 05 Nov 2020
-
- BfN (2006) Wasserrahmenrichtlinie, wasserabhängige Lebensraumtypen nach Anhang I der FFH-Richtlinie. https://www.bfn.de/themen/natura-2000/management/kooperation-mit-nutzern.... Accessed 11 Nov 2020
-
- BGR (2019) Extended vector data of the International Hydrological Map of Europe 1:1,500,000 (Version IHME 1500 v1.2). https://www.bgr.bund.de/ihme1500. Accessed 10 Nov 2020
MeSH terms
Substances
LinkOut - more resources
Full Text Sources
