. 2022 Jul;414(17):4919-4933.
doi: 10.1007/s00216-022-04118-z. Epub 2022 Jun 14.

Uncertainty estimation strategies for quantitative non-targeted analysis

Affiliations

Uncertainty estimation strategies for quantitative non-targeted analysis

Louis C Groff 2nd et al. Anal Bioanal Chem. 2022 Jul.

Abstract

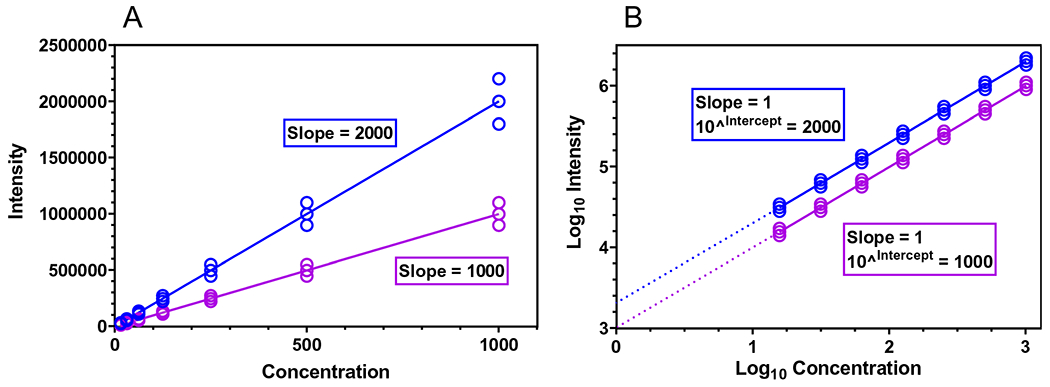
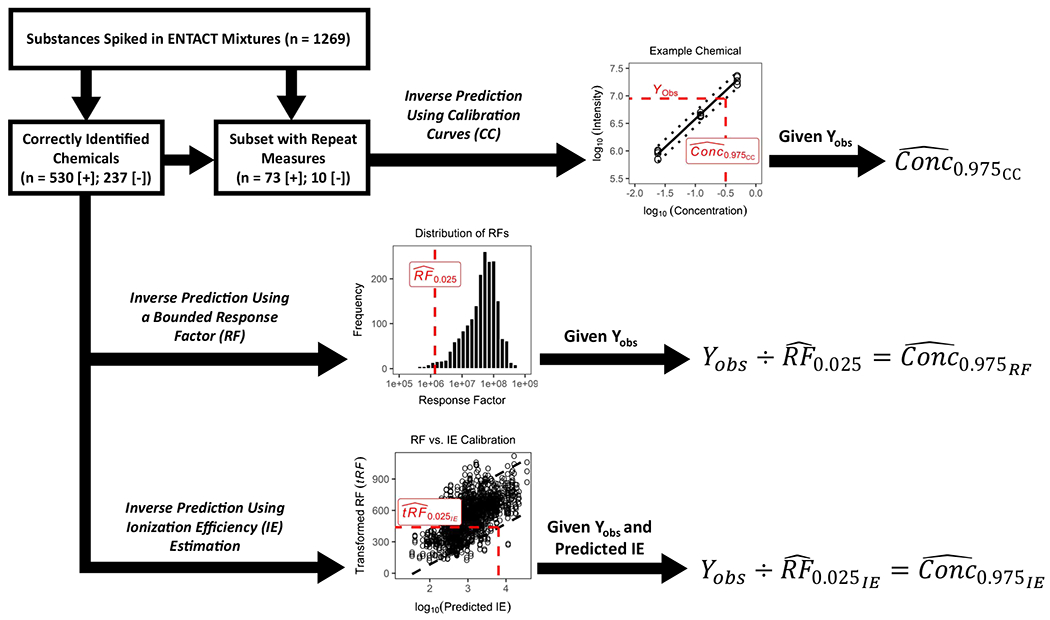
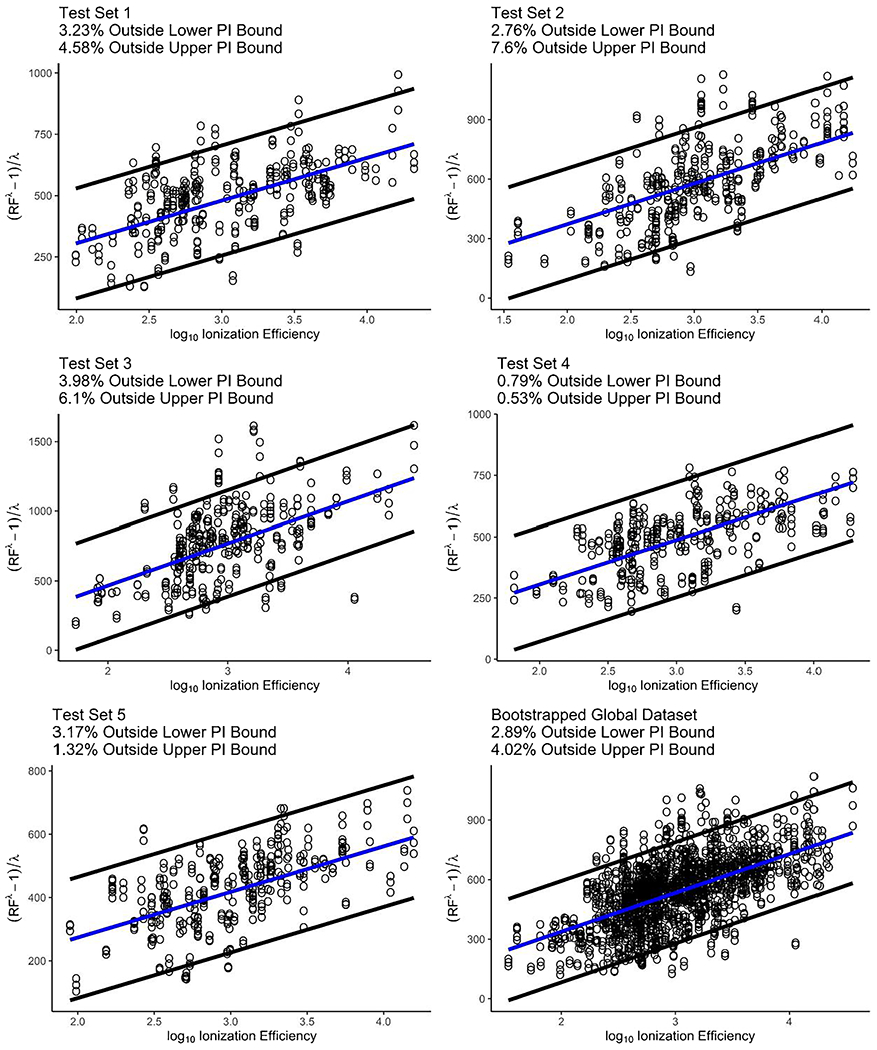
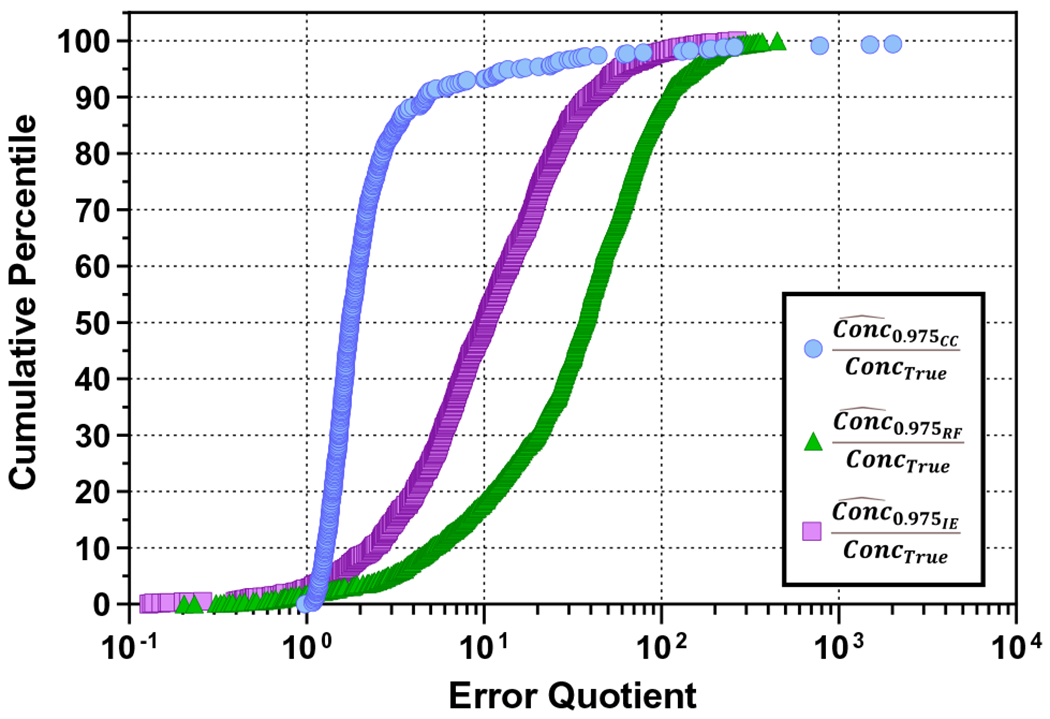
Non-targeted analysis (NTA) methods are widely used for chemical discovery but seldom employed for quantitation due to a lack of robust methods to estimate chemical concentrations with confidence limits. Herein, we present and evaluate new statistical methods for quantitative NTA (qNTA) using high-resolution mass spectrometry (HRMS) data from EPA's Non-Targeted Analysis Collaborative Trial (ENTACT). Experimental intensities of ENTACT analytes were observed at multiple concentrations using a semi-automated NTA workflow. Chemical concentrations and corresponding confidence limits were first estimated using traditional calibration curves. Two qNTA estimation methods were then implemented using experimental response factor (RF) data (where RF = intensity/concentration). The bounded response factor method used a non-parametric bootstrap procedure to estimate select quantiles of training set RF distributions. Quantile estimates then were applied to test set HRMS intensities to inversely estimate concentrations with confidence limits. The ionization efficiency estimation method restricted the distribution of likely RFs for each analyte using ionization efficiency predictions. Given the intended future use for chemical risk characterization, predicted upper confidence limits (protective values) were compared to known chemical concentrations. Using traditional calibration curves, 95% of upper confidence limits were within ~tenfold of the true concentrations. The error increased to ~60-fold (ESI+) and ~120-fold (ESI-) for the ionization efficiency estimation method and to ~150-fold (ESI+) and ~130-fold (ESI-) for the bounded response factor method. This work demonstrates successful implementation of confidence limit estimation strategies to support qNTA studies and marks a crucial step towards translating NTA data in a risk-based context.

Keywords: ENTACT; Exposure; HRMS; NTA; Quantitative; Uncertainty.


Conflict of interest statement

Conflict of Interest The authors declare no competing interests.

Figures

Fig. 1
Fig. 1
A Two theoretical calibration curves with unequal point spacing on the X axis and heteroscedastic measurement errors (Y axis) about the regression lines. Here, the regression slopes are equal to the chemical-specific response factors (RF = intensity/concentration). B Two theoretical calibration curves, based on the exact data from (A) after base 10 logarithmic transformation. Here, point spacing is equal along the X axis, and measurement error (Y axis) is homoscedastic about the regression line. Furthermore, the slope of each regression line equals one (indicating a perfectly proportional relationship between concentration and intensity), and the intercept equals the chemical-specific RF, after exponentiation
Fig. 2
Fig. 2
A workflow illustrating the use of ENTACT mixtures data to evaluate concentration estimation methods. The first approach, inverse prediction using calibration curves, follows traditional quantitative procedures and was relevant for only a subset of ENTACT chemicals measured across multiple mixtures. Here, upper-bound concentration estimates (Conc^0.975CC) were calculated using observed intensities (Yobs) and compound-specific calibration curves with 95% prediction intervals. The second approach, inverse prediction using a bounded response factor, was applied to all measured ENTACT chemicals, with upper-bound concentration estimates (Conc^0.975RF) calculated using the 2.5th percentile estimate of a response factor distribution (RF^0.025). The third approach, inverse prediction using ionization efficiency estimation, was also applied to all measured ENTACT chemicals. Here, IE was first predicted for each ENTACT chemical using an existing machine learning model. A calibration of RF vs. predicted IE (with appropriate data transformations) then enabled estimation of the upper-bound concentration (Conc^0.975IE) for each measured ENTACT chemical given Yobs and predicted IE
Fig. 3
Fig. 3
Linear mixed-effects model regressions of Box–Cox-transformed response factors (RF) on log-transformed predicted ionization efficiencies for ENTACT chemicals measures in ESI+ mode. The blue line represents the least-squares regression line from the mean bootstrap coefficients, and the region within the black lines represents the approximate 95% prediction interval about the regression line. Each figure panel shows the annotated percentage of data outside of the prediction interval bounds for a specific CV fold. The final plot shows the regression line and approximate 95% prediction interval for the full ESI+ dataset (Box–Cox lambda = 0.285)
Fig. 4
Fig. 4
Cumulative percentile plot for error quotients based on three concentration estimation methods. Conc^0.975CC represents the upper-bound concentration prediction using chemical-specific calibration curves. Conc^0.975RF represents the upper-bound concentration prediction using the bounded response factor method. Conc^0.975IE represents the upper-bound concentration prediction using the ionization efficiency estimation method. ConcTrue represents the true (known) analyte concentration. Three extreme outlier error quotients are not pictured (Conc^0.975CC/ConcTrue=1.62×108,2.30×108,and4.25×1020), resulting from inverse predictions on three of the six data points for 1,3-diphenylguanidine

References

    1. Egeghy PP, Judson R, Gangwal S, Mosher S, Smith D, Vail J, et al. The exposure data landscape for manufactured chemicals. Sci Total Environ. 2012:414:159–66. - PubMed
    1. Weinberg N, Nelson D, Sellers K, Byrd J. Insights from TSCA reform: a case for identifying new emerging contaminants. Curr Pollut Rep. 2019;5(4):215–27.
    1. Risk assessment in the federal government: managing the process. National Research Council (US). Washington (DC): National Academies Press (US); 1983. - PubMed
    1. Newton SR, McMahen RL, Sobus JR, Mansouri K, Williams AJ, McEachran AD, et al. Suspect screening and non-targeted analysis of drinking water using point-of-use filters. Environ Pollut. 2018;234:297–306. - PMC - PubMed
    1. Postigo C, Andersson A, Harir M, Bastviken D, Gonsior M, Schmitt-Kopplin P, et al. Unraveling the chemodiversity of halogenated disinfection by-products formed during drinking water treatment using target and non-target screening tools. J Hazard Mater. 2021;401. - PubMed