

Climate variability and Aedes vector indices in the southern Philippines: An empirical analysis
- PMID: 35700164
- PMCID: PMC9197058
- DOI: 10.1371/journal.pntd.0010478
Climate variability and Aedes vector indices in the southern Philippines: An empirical analysis
Abstract
Background: Vector surveillance is an essential public health tool to aid in the prediction and prevention of mosquito borne diseases. This study compared spatial and temporal trends of vector surveillance indices for Aedes vectors in the southern Philippines, and assessed potential links between vector indices and climate factors.
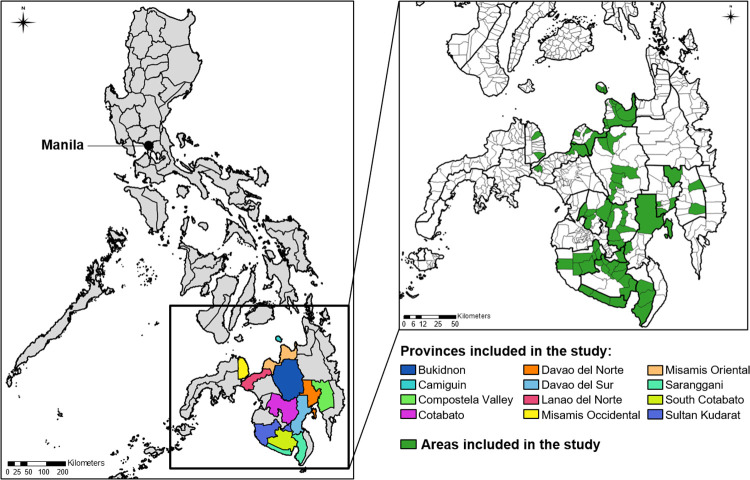
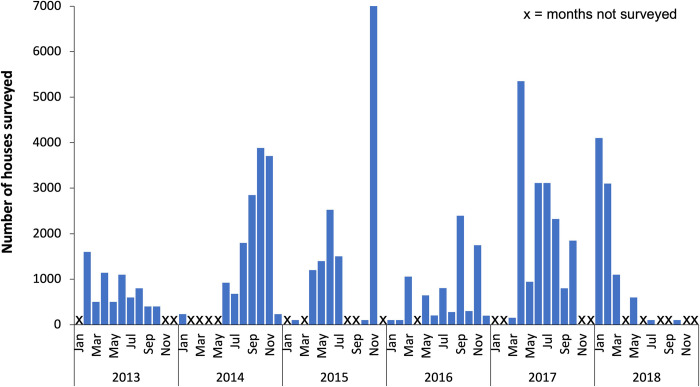
Methods: We analysed routinely collected larval and pupal surveillance data from residential areas of 14 cities and 51 municipalities during 2013-2018 (House, Container, Breteau and Pupal Indices), and used linear regression to explore potential relationships between vector indices and climate variables (minimum temperature, maximum temperature and precipitation).
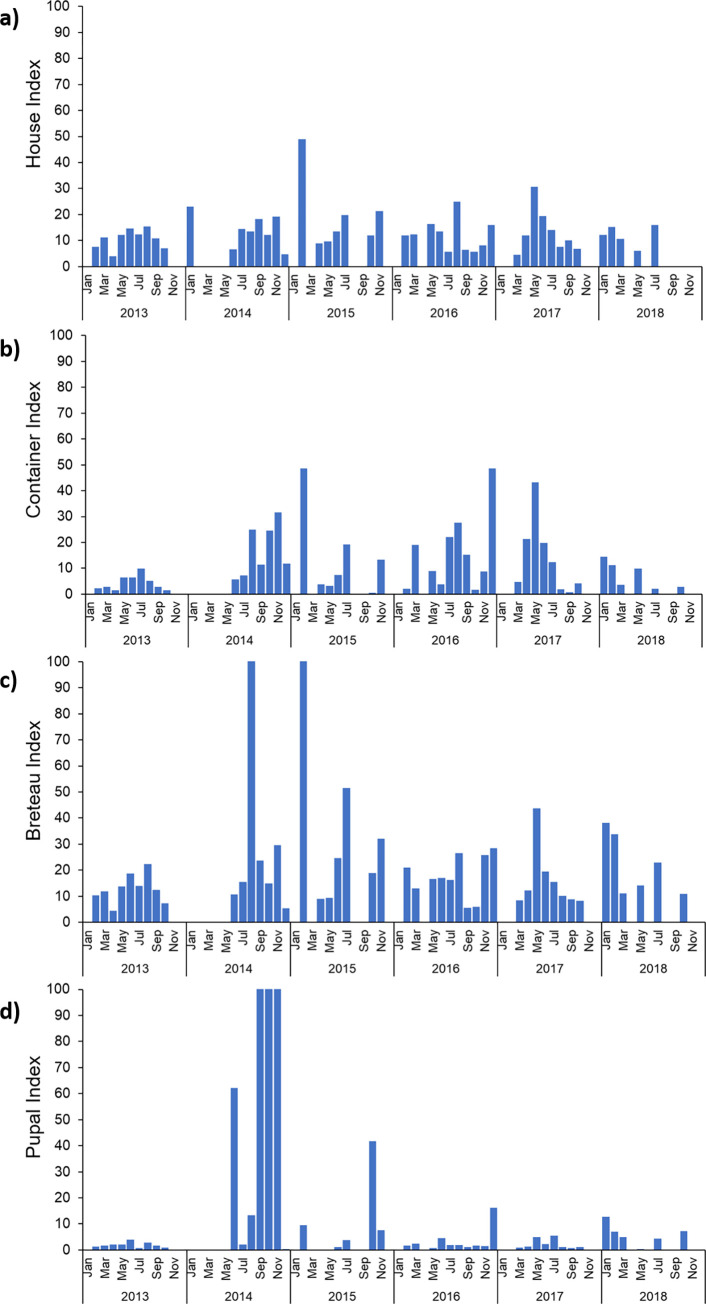
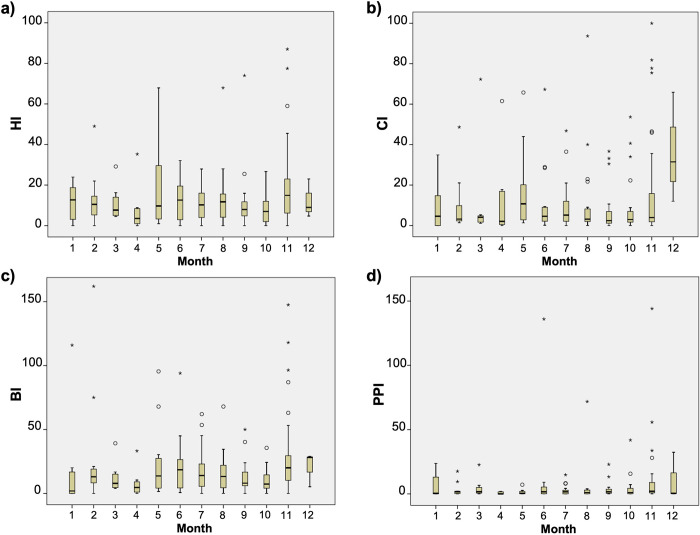
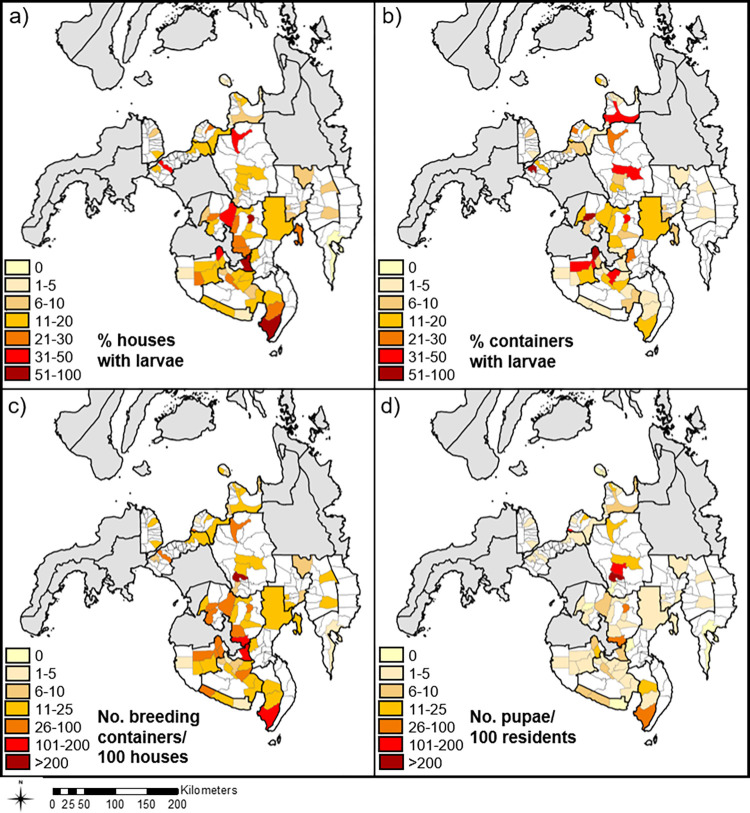
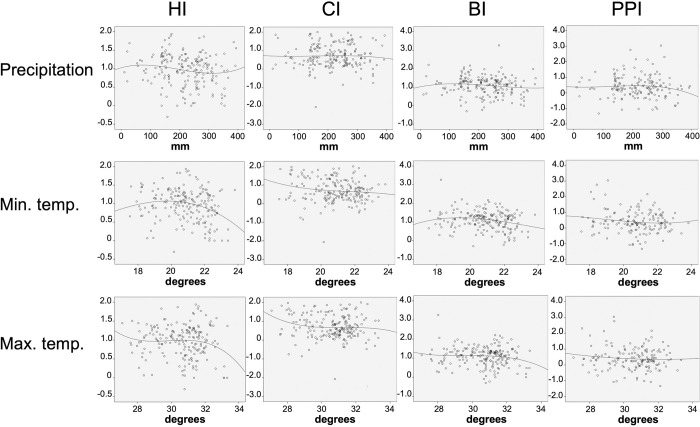
Results: We found substantial spatial and temporal variation in monthly Aedes vector indices between cities during the study period, and no seasonal trend apparent. The House (HI), Container (CI) and Breteau (BI) Indices remained at comparable levels across most surveys (mean HI = 15, mean CI = 16, mean BI = 24), while the Pupal Productivity Index (PPI) was relatively lower in most months (usually below 5) except for two main peak periods (mean = 49 overall). A small proportion of locations recorded high values across all entomological indices in multiple surveys. Each of the vector indices were significantly correlated with one or more climate variables when matched to data from the same month or the previous 1 or 2 months, although the effect sizes were small. Significant associations were identified between minimum temperature and HI, CI and BI in the same month (R2 = 0.038, p = 0.007; R2 = 0.029, p = 0.018; and R2 = 0.034, p = 0.011, respectively), maximum temperature and PPI with a 2-month lag (R2 = 0.031, p = 0.032), and precipitation and HI in the same month (R2 = 0.023, p = 0.04).
Conclusions: Our findings indicated that larval and pupal surveillance indices were highly variable, were regularly above the threshold for triggering vector control responses, and that vector indices based on household surveys were weakly yet significantly correlated with city-level climate variables. We suggest that more detailed spatial and temporal analyses of entomological, climate, socio-environmental and Aedes-borne disease incidence data are necessary to ascertain the most effective use of entomological indices in guiding vector control responses, and reduction of human disease risk.
Conflict of interest statement
The authors have declared that no competing interests exist.
Figures
Similar articles
-
Larval Indices of Vector Mosquitoes as Predictors of Dengue Epidemics: An Approach to Manage Dengue Outbreaks Based on Entomological Parameters in the Districts of Colombo and Kandy, Sri Lanka.Biomed Res Int. 2020 Jun 16;2020:6386952. doi: 10.1155/2020/6386952. eCollection 2020. Biomed Res Int. 2020. PMID: 32685511 Free PMC article.
-
Empirical optimization of risk thresholds for dengue: an approach towards entomological management of Aedes mosquitoes based on larval indices in the Kandy District of Sri Lanka.Parasit Vectors. 2018 Jun 28;11(1):368. doi: 10.1186/s13071-018-2961-y. Parasit Vectors. 2018. PMID: 29954443 Free PMC article.
-
Ecological, Social, and Other Environmental Determinants of Dengue Vector Abundance in Urban and Rural Areas of Northeastern Thailand.Int J Environ Res Public Health. 2021 Jun 2;18(11):5971. doi: 10.3390/ijerph18115971. Int J Environ Res Public Health. 2021. PMID: 34199508 Free PMC article.
-
Environmental methods for dengue vector control - A systematic review and meta-analysis.PLoS Negl Trop Dis. 2019 Jul 11;13(7):e0007420. doi: 10.1371/journal.pntd.0007420. eCollection 2019 Jul. PLoS Negl Trop Dis. 2019. PMID: 31295250 Free PMC article.
-
Interventions against Aedes/dengue at the household level: a systematic review and meta-analysis.EBioMedicine. 2023 Jul;93:104660. doi: 10.1016/j.ebiom.2023.104660. Epub 2023 Jun 21. EBioMedicine. 2023. PMID: 37352828 Free PMC article.
Cited by
-
Climate change, environmental extremes, and human health in Australia: challenges, adaptation strategies, and policy gaps.Lancet Reg Health West Pac. 2023 Nov 15;40:100936. doi: 10.1016/j.lanwpc.2023.100936. eCollection 2023 Nov. Lancet Reg Health West Pac. 2023. PMID: 38116505 Free PMC article. Review.
-
School and home-based educational intervention in urban Kenya: Sustained improvements in knowledge, attitudes, and practices for Aedes aegypti control.PLOS Glob Public Health. 2025 Jun 4;5(6):e0004567. doi: 10.1371/journal.pgph.0004567. eCollection 2025. PLOS Glob Public Health. 2025. PMID: 40465671 Free PMC article.
-
Assessing and correcting neighborhood socioeconomic spatial sampling biases in citizen science mosquito data collection.Sci Rep. 2024 Sep 28;14(1):22462. doi: 10.1038/s41598-024-73416-6. Sci Rep. 2024. PMID: 39341898 Free PMC article.
-
Dengue in Cebu City, Philippines: A Pilot Study of Predictive Models and Visualizations for Public Health.Am J Trop Med Hyg. 2023 Dec 11;110(1):179-187. doi: 10.4269/ajtmh.23-0250. Print 2024 Jan 3. Am J Trop Med Hyg. 2023. PMID: 38081048 Free PMC article.
-
The relative importance of key meteorological factors affecting numbers of mosquito vectors of dengue fever.PLoS Negl Trop Dis. 2023 Apr 13;17(4):e0011247. doi: 10.1371/journal.pntd.0011247. eCollection 2023 Apr. PLoS Negl Trop Dis. 2023. PMID: 37053307 Free PMC article.
References
-
- Dengue guidelines for diagnosis, treatment, prevention and control: new edition. Geneva: World Health Organization; World Health Organization; 2009. Report No.: 9789241547871 Contract No.: WHO/HTM/NTD/DEN/2009.1. - PubMed
-
- Focks DA, Research UNWBWSPf, Training in Tropical D. A review of entomological sampling methods and indicators for dengue vectors. Geneva: World Health Organization; 2004.
Publication types
MeSH terms
LinkOut - more resources
Full Text Sources
Medical
