. 2022 Jun 14;17(6):e0269590.
doi: 10.1371/journal.pone.0269590. eCollection 2022.

Gardnerella vaginalis clades in pregnancy: New insights into the interactions with the vaginal microbiome

Affiliations

Gardnerella vaginalis clades in pregnancy: New insights into the interactions with the vaginal microbiome

Marco Severgnini et al. PLoS One. .

Abstract

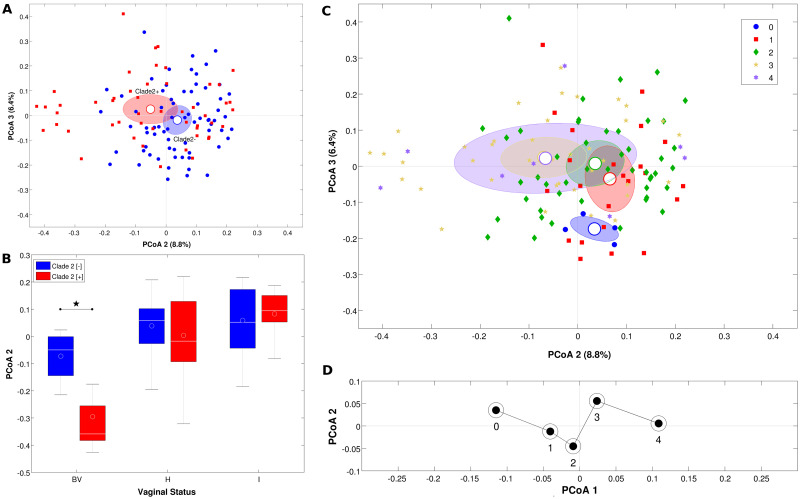
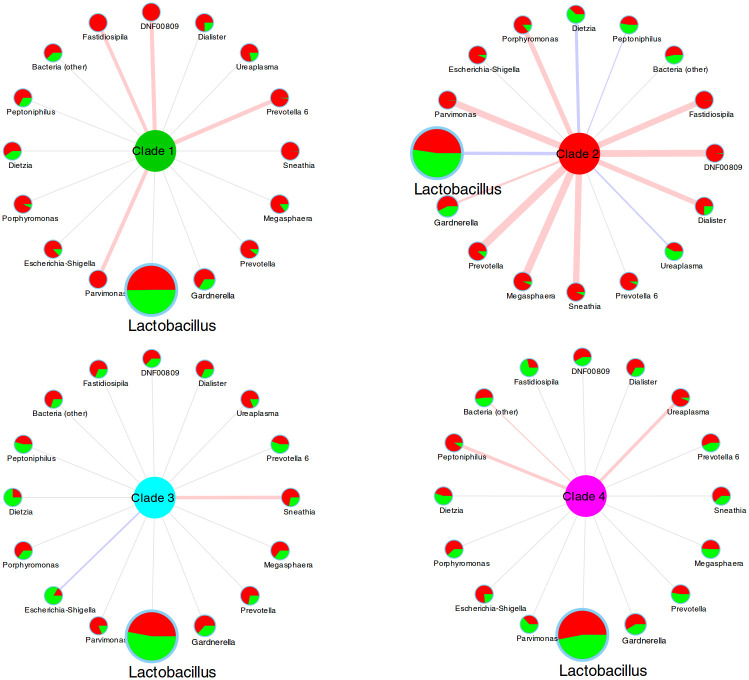
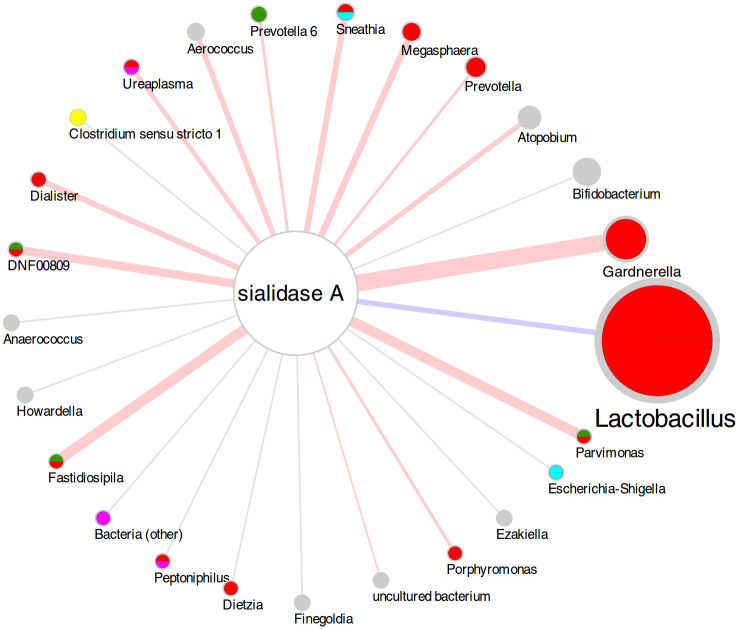
Gardnerella vaginalis (GV) is an anaerobic bacterial species involved in the pathogenesis of bacterial vaginosis (BV), a condition of vaginal dysbiosis associated with adverse pregnancy outcomes. GV strains are categorized into four clades, characterized by a different ability to produce virulence factors, such as sialidase. We investigated the distribution of GV clades and sialidase genes in the vaginal ecosystem of a cohort of pregnant women, assessing the correlations between GV clades and the whole vaginal microbiome. A total of 61 Caucasian pregnant women were enrolled. Their vaginal swabs, collected both at the first and third trimester of pregnancy, were used for (i) evaluation of the vaginal status by Nugent score, (ii) vaginal microbiome profiling by 16S rRNA sequencing, (iii) detection and quantification of GV clades and sialidase A gene by qPCR assays. DNA of at least one GV clade was detected in most vaginal swabs, with clade 4 being the most common one. GV clade 2, together with the presence of multiple clades (>2 simultaneously), were significantly associated with a BV condition. Significantly higher GV loads and sialidase gene levels were found in BV cases, compared to the healthy status. Clade 2 was related to the major shifts in the vaginal microbial composition, with a decrease in Lactobacillus and an increase in several BV-related taxa. As the number of GV clades detected simultaneously increased, a group of BV-associated bacteria tended to increase as well, while Bifidobacterium tended to decrease. A negative correlation between sialidase gene levels and Lactobacillus, and a positive correlation with Gardnerella, Atopobium, Prevotella, Megasphaera, and Sneathia were observed. Our results added knowledge about the interactions of GV clades with the inhabitants of the vaginal microbiome, possibly helping to predict the severity of BV and opening new perspectives for the prevention of pregnancy-related complications.


Conflict of interest statement

The authors have declared that no competing interests exist.

Figures

Fig 1
Fig 1
A) Principal Coordinate Analysis (PCoA) plots based on the unweighted Unifrac distance among samples clustered on the presence of GV clade 2. Each point represents a sample, colored according to the experimental category (blue: Negative, red: Positive). Ellipses are 95% SEM-based confidence intervals, and centroids represent the average coordinate per category. The second and the third coordinates are represented. B) Boxplots of the distributions of PCoA coordinate 2 on the unweighted Unifrac distances for presence/absence of GV clade 2, with samples divided according to their vaginal status (by Nugent score). Asterisk indicates statistical significance (p<0.05, adonis test) C) PCoA plot based on the unweighted Unifrac distance among samples clustered according to the number of GV clades present in each sample. Each point represents a sample, which is colored according to the experimental category. Ellipses are 95% SEM-based confidence intervals, and centroids represent the average coordinate per each category. The second and the third coordinates are represented. D) Trajectory plot of the PCoA centroids obtained from the first and second coordinate of the PCoA analysis of the weighted Unifrac distances.
Fig 2
Fig 2. Barplot of the average relative abundance of the main genera, over the number of clades found at the same time in each sample.
Only the first 12 most abundant genera are plotted, whereas the remaining genera are grouped in the ‘Others’ category.
Fig 3
Fig 3. Diagram representing the correlations between bacterial genera and presence/absence of each of the four GV clades.
Edge color represents the sign of the correlation (blue = negative, red = positive, gray = not significant) and edge thickness represents the strength of correlation. Node and label size of the bacterial genera is proportional to the average abundance over the whole set of samples. Piecharts in each node represent the skewness of the average relative abundance of the genera in samples not showing (green) or showing (red) the specific clade. Thus, for example, genera with a piechart nearly completely red are those whose abundance in the samples is more associated with positivity for the specific clade. Data used for building the figure are provided in S4 Table.
Fig 4
Fig 4. Diagram representing the correlations between bacterial genera and the number of copies of the sialidase gene, on a log2 scale.
Edge color represents the sign of the correlation (blue = negative, red = positive, gray = not significant) and edge thickness represents the strength of correlation. Node and label size of the bacterial genera is proportional to the average abundance over the whole set of samples. Piecharts in each node indicate whether the genera was differentially abundant in samples positive or negative for each GV clade (green = clade 1; red = clade 2; cyan = clade 3; magenta = clade 4). Colors are the same as the clades in Fig 3. Data used for building the figure are provided in S5 Table.

Similar articles

Cited by

References

    1. Smith SB, Ravel J. The vaginal microbiota, host defense and reproductive physiology. J Physiol. 2017;595:451–463. doi: 10.1113/JP271694 - DOI - PMC - PubMed
    1. Ceccarani C, Foschi C, Parolin C, D’Antuono A, Gaspari V, Consolandi C, et al.. Diversity of vaginal microbiome and metabolome during genital infections. Sci Rep. 2019;9:14095. doi: 10.1038/s41598-019-50410-x - DOI - PMC - PubMed
    1. Parolin C, Foschi C, Laghi L, Zhu C, Banzola N, Gaspari V, et al.. Insights Into Vaginal Bacterial Communities and Metabolic Profiles of Chlamydia trachomatis Infection: Positioning Between Eubiosis and Dysbiosis. Front Microbiol. 2018;9:600. doi: 10.3389/fmicb.2018.00600 - DOI - PMC - PubMed
    1. Sobel JD. Bacterial vaginosis. Annu Rev Med. 2000;51:349–56. doi: 10.1146/annurev.med.51.1.349 - DOI - PubMed
    1. Srinivasan S, Morgan MT, Fiedler TL, Djukovic D, Hoffman NG, Raftery D, et al.. Metabolic signatures of bacterial vaginosis. mBio 2015;6:e00204–15. doi: 10.1128/mBio.00204-15 - DOI - PMC - PubMed

Publication types