. 2022 Jun 14:11:e72374.
doi: 10.7554/eLife.72374.

Androglobin, a chimeric mammalian globin, is required for male fertility

Affiliations

Androglobin, a chimeric mammalian globin, is required for male fertility

Anna Keppner et al. Elife. .

Abstract

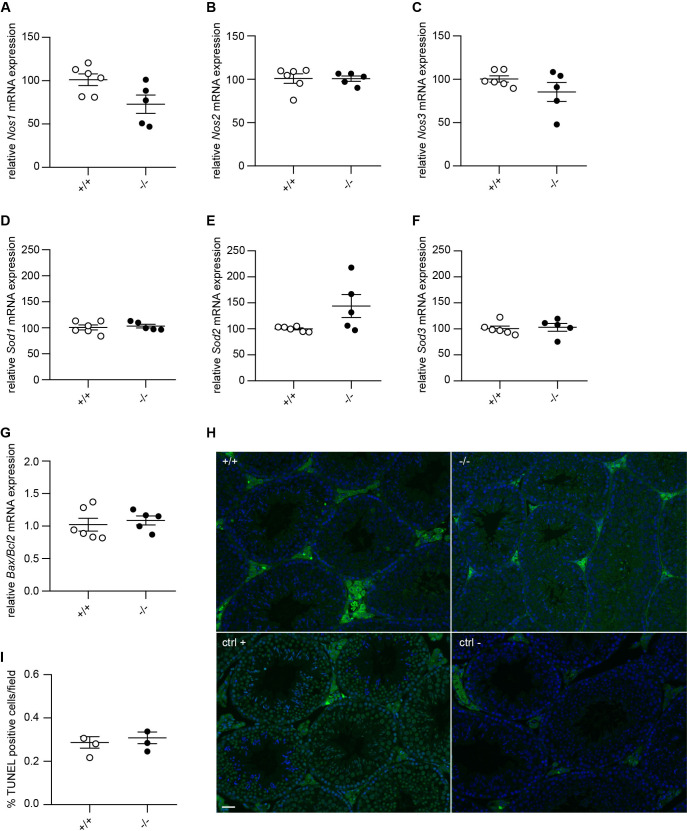
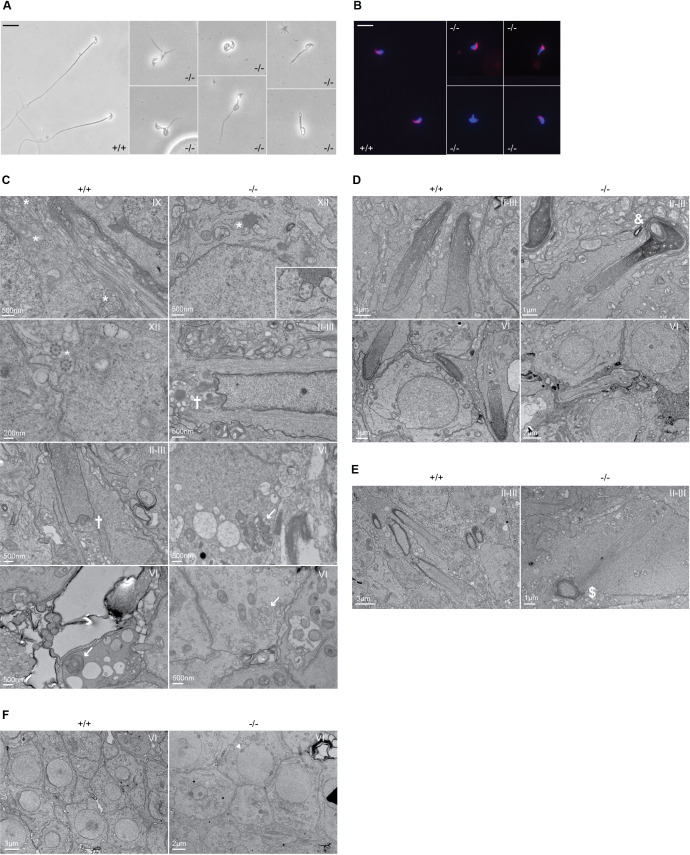
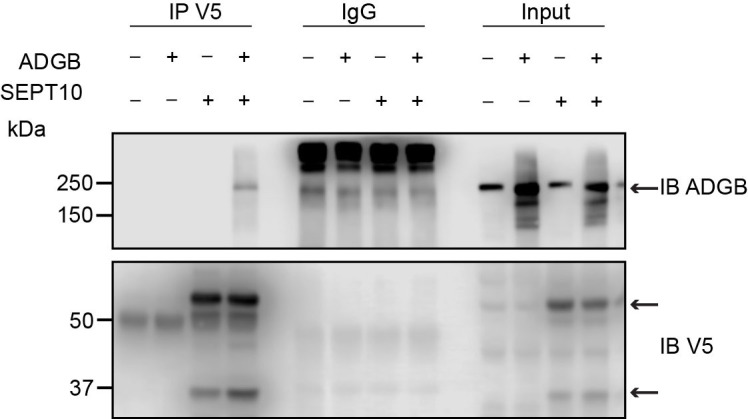
Spermatogenesis is a highly specialized differentiation process driven by a dynamic gene expression program and ending with the production of mature spermatozoa. Whereas hundreds of genes are known to be essential for male germline proliferation and differentiation, the contribution of several genes remains uncharacterized. The predominant expression of the latest globin family member, androglobin (Adgb), in mammalian testis tissue prompted us to assess its physiological function in spermatogenesis. Adgb knockout mice display male infertility, reduced testis weight, impaired maturation of elongating spermatids, abnormal sperm shape, and ultrastructural defects in microtubule and mitochondrial organization. Epididymal sperm from Adgb knockout animals display multiple flagellar malformations including coiled, bifid or shortened flagella, and erratic acrosomal development. Following immunoprecipitation and mass spectrometry, we could identify septin 10 (Sept10) as interactor of Adgb. The Sept10-Adgb interaction was confirmed both in vivo using testis lysates and in vitro by reciprocal co-immunoprecipitation experiments. Furthermore, the absence of Adgb leads to mislocalization of Sept10 in sperm, indicating defective manchette and sperm annulus formation. Finally, in vitro data suggest that Adgb contributes to Sept10 proteolysis in a calmodulin-dependent manner. Collectively, our results provide evidence that Adgb is essential for murine spermatogenesis and further suggest that Adgb is required for sperm head shaping via the manchette and proper flagellum formation.

Keywords: calmodulin; cell biology; developmental biology; globin; heme; infertility; mouse; oxygen; spermatogenesis.


Conflict of interest statement

AK, MC, SS, TK, DM, CO, DW, AC, MS, FC, SD, AO, DK, TH, RW, DH No competing interests declared

Figures

Figure 1.
Figure 1.. Validation of the knockout model and testicular phenotype.
(A) Relative mRNA expression levels of Adgb in testes of wild-type (+/+) and knockout mice (-/-) (n=6 per genotype; p=0.000008). (B) Representative immunoblot for Adgb in testis lysates from wild-type (+/+) and knockout mice (-/-) (n=6 per genotype) and (C) corresponding protein quantification. Tubulin was used as loading control. p=0.0007. (D) Testis weight (g) in Adgb wild-type (+/+), heterozygous (+/-), and knockout (-/-) mice (n=8–13 per genotype). p=0.000003. (E) Intratesticular testosterone levels (pg/mg) in Adgb wild-type (+/+) and knockout (-/-) mice (n=6 per genotype). (F) Representative periodic acid Schiff (PAS)-hematoxylin-stained sections of testes from Adgb wild-type (+/+) and knockout mice (-/-) at the different stages of spermatogenesis. Heads (H), flagella (F), residual bodies (R), cytoplasmic debris (CD), meiosis (M), elongating spermatids (ES), round spermatids (RS), stage 16 spermatids (S16), and abnormal heads (A) are indicated. Note the full absence of flagella in knockout sections. Scale bar represents 50 µm. (G) Representative H&E stained sections of epididymides from Adgb wild-type (+/+) and knockout mice (-/-). H, tails (T), cytoplasmic bodies (C), R, germ cells (G), and A are shown. Note the empty lumen (EL) in knockout mice. Scale bar represents 50 µm. ** p<0.01, *** p<0.001.
Figure 1—figure supplement 1.
Figure 1—figure supplement 1.. Generation of Adgb knockout mice.
(A) Schematic representation of the wild type, Tm1a (gene-trap), Tm1b (following breeding with Cre-deleter mice), Tm1c (following breeding with Flp-deleter mice), and Tm1d (knockout) (following breeding of Tm1c mice with Cre-deleter mice) alleles. The position of the probe (asterisk), the primers (5’S, 5’AS, 3’S, and 3’AS), and restriction sites for the ESC screening by PCR and Southern blot are shown. FRT sites flank the gene-trap construct, containing the lacZ gene and the neomycin resistance cassette (neo), whereas loxP sites flank the neo-cassette and exons 13 and 14 of the Adgb gene. Position of the PCR primers for the genotyping of the different mouse lines are shown (F1 and R1-4). (B) Representative PCR-based analysis of targeted ESCs using primers 5’S and 5’AS (left panel) (M: marker, 1 and 2: positive and negative clones, respectively), and primers 3’S and 3’AS (right panel) (M: marker, 1 and 2: negative and positive clones, respectively). (C) Southern blot analysis of targeted ESC clones using the exon 13 probe (asterisk) and following digestion with PvuII and PstI (M: marker, 1–5: different clones tested positive for both 5’ and 3’ PCR reactions). (D) Genotyping of Tm1a wild-type (+/+), heterozygous (tg/+) and homozygous (tg/tg) mice (upper panel), M: marker, Tm1b wild type (+/+), heterozygous (tg/+) and homozygous (tg/tg) mice (middle panel), and Tm1d wild type (+/+), heterozygous (+/-), and homozygous (-/-, knockout) mice (lower panel).
Figure 1—figure supplement 2.
Figure 1—figure supplement 2.. Normal serum gonadotropin levels in Adgb knockout mice.
(A) Serum levels of luteinizing hormone (LH, pg/ml) and (B) serum levels of follicle-stimulating hormone (FSH, ng/ml) in Adgb wild-type (+/+) and knockout (-/-) mice (n=12–16 per genotype).
Figure 1—figure supplement 3.
Figure 1—figure supplement 3.. Adgb knockout mice do not display changes in Nos, Sod, and apoptotic gene expression.
Relative mRNA expression levels of (A) Nos1, (B) Nos2, (C) Nos3, (D) Sod1, (E) Sod2, (F) Sod3, and (G) ratio of Bax and Bcl2 in testis lysates from Adgb wild-type (+/+, n=6) and knockout (-/-, n=5) mice. (H) Representative testis sections of Adgb wild-type (+/+) and knockout (-/-) mice following terminal deoxynucleotidyl transferase dUTP nick-end labeling (TUNEL) assay (n=3 per genotype). Positive control sections were pre-incubated with DNase I, and negative sections were incubated without recombinant terminal deoxynucleotidyl transferase (rTdT enzyme). Magnification 20×, scale bar represents 100 µm. (I) Quantification of TUNEL assay, 10 pictures were counted per animal (n=3 per genotype).
Figure 2.
Figure 2.. Testicular Adgb expression pattern and localization.
(A) Relative mRNA expression levels of Adgb in testes of wild-type mice during embryonic development (E) and early post-natal (P) life (n=3–4 per condition). (B) Representative immunoblot for Adgb in testis lysates from wild-type mice at different P ages (n=3 per condition) and (C) corresponding protein quantification. Tubulin was used as loading control. (D) Flow cytometric analysis of spermatogenic cell populations following propidium iodide staining in Adgb wild-type (+/+, white circles, n=4), heterozygous (+/-, gray circles, n=5), and knockout (-/-, black circles, n=3) testes. H: elongating and elongated spermatids; 1 C: round spermatids; 2 C: spermatogonia, secondary spermatocytes, and testicular somatic cells; S: spermatogonia synthesizing DNA; 4 C: primary spermatocytes. p=0.00024. (E) Representative pictures of Adgb protein (red fluorescence) detection in testes of wild-type (+/+) and knockout (-/-) animals. Left panels 20× magnification, right panels 40× magnification, and scale bars represent 100 µm and 50 µm, respectively. Nuclei were stained with DAPI. (F) Representative pictures of Adgb mRNA in situ hybridization in testes from wild-type (+/+) and knockout (-/-) animals. Left panels 20× magnification; right panels, 40× magnification; scale bars represent 100 µm and 50 µm, respectively. Positive (ctrl +, PPIB) and negative (ctrl −, DapB) control sections are shown. (G) Representative pictures of β-galactosidase activity (X-gal staining) in testes from Tm1b wild-type (+/+) and Tm1b heterozygous (tg/+) mice and isolated spermatozoa from Tm1b heterozygous (tg/+) mice. Left panels, 20× magnification; middle panels, 40× magnification; right panel, 60× magnification; scale bars represent 100 µm, 50 µm, and 20 µm, respectively. Spermatozoa were counterstained with nuclear fast red. (H) Representative picture of Adgb protein (green fluorescence) in a single spermatozoon from wild-type (+/+) mice (left panel) and negative control (secondary antibody only, right panel). Scale bar represents 20 µm and nuclei were stained with DAPI. ** p<0.001.
Figure 2—figure supplement 1.
Figure 2—figure supplement 1.. Temporal Adgb and Sept10 expression profiles based on single-cell and bulk RNAseq datasets.
(A, C, E, and G): Adgb; (B, D, F, and H): Sept10. Data were obtained from Lukassen et al., 2018 (mouse, panels A and B), Green et al., 2018 (mouse, panels C and D), Jégou et al., 2017 (human, panels E and F), and Wang et al., 2018 (human, panels G and H), respectively (Green et al., 2018; Jégou et al., 2017; Lukassen et al., 2018; Wang et al., 2018).
Figure 2—figure supplement 2.
Figure 2—figure supplement 2.. Adgb and Sept10 gene expression profiles based on single-cell RNAseq of mouse testes along the temporospatial axis of spermatid maturation.
Left: Adgb and right: Sept10. Datasets were obtained from Kwak and Jung, 2019.
Figure 3.
Figure 3.. Defective spermatogenesis is associated with flagellar malformation in Adgb knockout mice.
(A) Representative pictures of cauda epididymis sperm from wild-type (+/+) and Adgb knockout animals (-/-). Scale bar represents 20 µm. (B) Representative pictures of peanut agglutinin-stained cauda epididymis sperm from wild-type (+/+) and Adgb knockout animals (-/-). Nuclei were stained with DAPI. Scale bar represents 20 µm. (C–F) Representative transmission electron microscope (TEM) pictures from wild-type (+/+, left panels) and knockout (-/-, right panels) testes at various stages of the first wave, tubular stages are indicated. (C) 9+2 microtubular structure (asterisks), forming sperm flagella (crosses), and (impaired) outer dense fibers (arrows) are shown. (D) Misshaped sperm heads with nuclear inclusions (ampersand), (E) defective manchette elongation (dollar), and (F) abnormal acrosomes (arrowheads) are shown. Scale bar lengths are indicated on each picture.
Figure 3—figure supplement 1.
Figure 3—figure supplement 1.. Volcano plot and gene ontology (GO) term analysis of differentially expressed genes in Adgb knockout mice testis samples.
(A) X-axis represents the log2 fold change and Y-axis represents log10 of the adjusted p-value. Genes are assigned with specific colors after DESeq2 analysis: gray (not significant [NS]), green |Log2FC|>1, blue (adjusted p<0.05), or red (|Log2FC|>1 and adjusted p<0.05). Adgb and most up- and down-regulated genes are indicated. (B) List of significantly changed GO terms from WebGestalt using Overrepresentation Enrichment Analysis and their respective p-values corrected for false discovery rate (FDR).
Figure 4.
Figure 4.. Adgb and Sept10 interact in vivo and in vitro.
(A) Proteins of the septin family are specifically enriched in the Adgb immunoprecipitation (IP). The iBAQ (intensity-based absolute quantification) values of each Adgb IP (triplicate) and IgG control IP (duplicate) were log2 transformed and normalized against the median value. Missing values were imputed before the mean values of the Adgb and IgG control IPs were calculated. The normalized abundance of each protein detected in the Adgb IP (log2 Adgb [mean]) is plotted against its specific enrichment compared to the IgG control IP log2 (Adgb [mean]/IgG [mean]). Adgb and septins are highlighted as blue and red dots, respectively, in the christmas tree plot representation. (B) Representative immunoblot of Adgb and Sept10 in testis lysates from wild-type (+/+) and knockout (-/-) mice following co-IP of Adgb and Sept10. (C–E) Representative immunoblots of ADGB and SEPT10 in protein lysates of HEK293 cells (co-)transfected with full-length ADGB (C), N-ter ADGB (D) and C-ter ADGB (E), and SEPT10 following co-IP of ADGB and SEPT10. Schematic representation of deletion constructs is provided in Figure 4—figure supplement 4.
Figure 4—figure supplement 1.
Figure 4—figure supplement 1.. The protein expression levels of Sept2, Sept7, Sept8, Sept9, Sept10, Sept11, and Sept14 are unaffected in Adgb knockout testis.
Representative immunoblots of testis lysates from Adgb wild-type (+/+, n=6–12) and knockout (-/-, n=6–11) mice for (A) Sept2, (B) Sept7, (C) Sept8, (D) Sept9, (E) Sept10, (F) Sept11, and (G) Sept14 and the corresponding protein quantifications for (H) Sept2, (I) Sept7, (J) Sept8, (K) Sept9, (L) Sept10, (M) Sept11, and (N) Sept14. Ponceau S protein staining was used as loading control.
Figure 4—figure supplement 2.
Figure 4—figure supplement 2.. Adgb does not interact with other septin family members in vivo.
Representative immunoblots of Adgb and (A) Sept2, (B) Sept7, and (C) Sept11 in testis lysates from wild-type (+/+) and knockout (-/-) mice following co-immunoprecipitation of Adgb and (A) Sept2, (B) Sept7, and (C) Sept11.
Figure 4—figure supplement 3.
Figure 4—figure supplement 3.. ADGB does not interact with other septin family members in vitro.
Representative immunoblots of ADGB and (A) FLAG-SEPT2, (B) FLAG-SEPT11, (C) FLAG-SEPT7, and (D) FLAG-SEPT12 in protein lysates of HEK293 cells (co-)transfected with full-length ADGB and (A) FLAG-SEPT2, (B) FLAG-SEPT11, (C) FLAG-SEPT7, and (D) FLAG-SEPT12 following co-immunoprecipitation (co-IP) of ADGB and FLAG. (E) Representative immunoblot of V5-SEPT10 and FLAG-SEPT7 in protein lysates of HEK293 cells (co-)transfected with V5-SEPT10 and FLAG-SEPT7 following co-IP of V5 and FLAG.
Figure 4—figure supplement 4.
Figure 4—figure supplement 4.. ADGB constructs used throughout the study.
F: FLAG tag, G: GFP, N: short N-terminal tail preceding the protease domain, arrows indicate deletions or point mutations.
Figure 4—figure supplement 5.
Figure 4—figure supplement 5.. The interaction between ADGB and SEPT10 is maintained despite mutation of the coiled-coil domains.
Representative immunoblots of ADGB and Sept10 in protein lysates of HEK293 cells (co-)transfected with CCD mutant ADGB and CCD mutant SEPT10 following co-immunoprecipitation of ADGB and SEPT10.
Figure 4—figure supplement 6.
Figure 4—figure supplement 6.. Sept10 temporal expression profile on mRNA and protein levels.
(A) Relative mRNA expression levels of Sept10 in testes of wild-type mice during the first wave of spermatogenesis at indicated post-natal (P) days. (B) Representative immunoblot for Sept10 in testis lysates from wild-type mice at indicated P ages (n=2 per condition) and (C) corresponding protein quantification. Ponceau S protein staining was used as loading control.
Figure 5.
Figure 5.. Adgb and Sept10 co-localize in the sperm neck and annulus.
(A) Representative pictures of Adgb protein (green fluorescence) and Sept10 (red fluorescence) in testis sections from wild-type (+/+, left panels) and knockout (-/-, right panels) mice at various stages of the first wave, tubular stages are indicated. Sections were counterstained with DAPI. Negative control (secondary antibodies only) is shown (lower panels). Scale bar represents 50 µm. (B) Representative pictures of Adgb (green fluorescence) and Sept10 (red fluorescence) in elongating spermatids (stage 12 [S12] upper panels and stage 15 [S15] middle panels) after stage-specific tubule dissection of wild-type (+/+) and knockout (-/-) testes. Nuclei were stained with DAPI. Negative controls (secondary antibodies only) are shown (lower panels). Scale bar represents 10 µm. Sperm neck (arrowhead) and annulus (arrow) are highlighted.
Figure 5—figure supplement 1.
Figure 5—figure supplement 1.. Absence of Adgb leads to abnormal annulus migration and mitochondrial disorganization.
(A) Representative pictures of Sept10 (green fluorescence, left panels) and Sept7 (green fluorescence, middle panels) in epididymal sperm from wild-type (+/+) and knockout (-/-) mice. Sections were counterstained with DAPI. Negative control (secondary antibody only) is shown (left panels). Scale bar represents 10 µm. Sperm neck (arrowhead) and annulus (arrow) are highlighted. (B) Representative pictures of CoxIV (red fluorescence) in elongating spermatids (stage 12 [S12] and stage 15 [S15]) after stage-specific tubule dissection and in epididymal sperm (ep.sperm) from wild-type (+/+) and knockout (-/-) mice. Nuclei were stained with DAPI. Negative controls (secondary antibody only) are shown. Scale bar represents 10 µm.
Figure 6.
Figure 6.. ADGB contributes to in vitro CaM-dependent SEPT10 cleavage.
(A) Representative immunoblots of ADGB and SEPT10 in protein lysates of HEK293 cells co-transfected with plasmids encoding SEPT10 and two dose-dependent amounts of full-length ADGB. (B) Representative immunoblot of ADGB and V5 in protein lysates of HEK293 cells (co-)transfected with full-length ADGB and a C-terminally V5-tagged SEPT10 construct following co-immunoprecipitation (co-IP) of ADGB and V5-SEPT10. (C) Representative immunoblots of ADGB, V5, HIF-1α, and PHD2 in protein lysates of HEK293 cells (co-)transfected with full-length ADGB and V5-SEPT10 following exposure to normoxic (20% O2) and hypoxic conditions (0.2% O2) for 24 hr. HIF-1α and PHD2 were used as positive controls for hypoxia. (D) Representative immunoblot of ADGB and V5 in protein lysates of HEK293 cells (co-)transfected with full-length ADGB, V5-SEPT10, an ADGB-IQ deletion mutant, and an ADGB-calpain protease domain deletion mutant and corresponding protein quantification of cleaved/full-size SEPT10 ratio (n=3–6 independent experiments). Ponceau S protein staining was used as loading control. Schematic representation of deletion constructs is provided in Figure 4—figure supplement 4. (E) Representative immunoblot of GFP and V5 in protein lysates of HEK293 cells (co-)transfected with a truncated construct of the globin domain of ADGB (spanning the IQ domain) (GFP-Globin) and a V5-tagged CaM (V5-Calmodulin) following IP of GFP. (F) Representative immunoblot of GFP and V5 in protein lysates of HEK293 cells (co-)transfected with GFP-Globin, a GFP-Globin construct with mutation of the proximal heme-binding histidine (GFP-Globin-F8[Gly]), a GFP-Globin construct with mutation of the distal glutamine (GFP-Globin-E7[Gly]), and V5-CaM following IP of GFP. (G, H) Mammalian 2-hybrid assays in HEK293 cells under normoxic conditions (G) and A375 cells under normoxic and hypoxic (0.2% O2) conditions (H) (n=3–5 independent experiments). HEK293 and A375 cells were transiently transfected with fusion protein vectors based on a Gal4 DNA-binding domain fused to calmodulin (Gal4-CaM) and a VP16 activation domain fused to the ADGB globin domain comprising the IQ domain (VP16-Globin), a Gal4 response element-driven firefly luciferase reporter, and a Renilla luciferase control vector. Increasing transfection amounts for the Gal4-CaM fusion protein were employed. Following transfection, A375 cells were incubated under normoxic (20% O2) or hypoxic (0.2% O2) conditions, and luciferase reporter gene activities were determined 24 hr later. Single construct transfections served as negative controls, whereby hypoxic regulation of CaM has been described previously (Yuan et al., 2005). A 5’/3’-hypoxia response element-dependent EPO promoter-driven firefly luciferase construct served as hypoxic control. * p<0.05, ** p<0.01, and *** p<0.001.
Figure 6—figure supplement 1.
Figure 6—figure supplement 1.. Reciprocal co-immunoprecipitation (co-IP) of ADGB and V5-SEPT10 from Figure 6B.
Representative immunoblot of ADGB and V5 in protein lysates of HEK293 cells (co-)transfected with full-length ADGB and a C-terminally V5-tagged SEPT10 construct following co-IP of ADGB and V5-SEPT10.
Figure 6—figure supplement 2.
Figure 6—figure supplement 2.. Full-length ADGB does not interact with CaM.
(A) Representative immunoblot of ADGB and CaM in protein lysates of HEK293 cells following (co-)transfection of FLAG-ADGB and V5-CaM and co-immunoprecipitation of ADGB, FLAG, and V5. (B) Mammalian 2-hybrid assay in HEK293 cells (n=3 independent experiments). HEK293 cells were transiently transfected with fusion protein vectors based on a Gal4 DNA-binding domain fused to either full-length ADGB (Gal4-ADGB) or CaM (Gal4-CaM) and a VP16-activation domain fused to either full-length ADGB (VP16-ADGB) or CaM (VP16-CaM), a Gal4 response element-driven firefly luciferase reporter, and a Renilla luciferase control vector.
Figure 6—figure supplement 3.
Figure 6—figure supplement 3.. ADGB globin immunoprecipitation (IP) vs. GFP control IP.
Calmodulin (CALM1) is among the proteins that are prominently enriched in the anti-GFP IP of cells expressing the GFP-tagged globin domain of ADGB. The iBAQ (intensity-based absolute quantification) values of the two IPs were log2 transformed and normalized against the median value. The normalized abundance of each protein detected in the globin IP (log2 globin) of cells expressing the GFP-globin construct is plotted against its specific enrichment compared to the control IP (log2 [globin/control]) from cells expressing the GFP-linker-GFP construct. ADGB and CALM1 are highlighted as blue and red dots, respectively, in the christmas tree plot representation.
Figure 6—figure supplement 4.
Figure 6—figure supplement 4.. Double mutation of the key heme-binding residues does not abrogate interaction of ADGB and CaM.
Representative immunoblot of GFP and V5 in protein lysates of HEK293 cells (co-)transfected with GFP-Globin domain, a GFP-Globin domain construct with a double mutation of the proximal heme-binding histidine and the distal heme-binding glutamine (GFP-Globin-F8/E7[Gly]) and V5-CaM following immunoprecipitation of GFP.
Figure 6—figure supplement 5.
Figure 6—figure supplement 5.. Heme depletion does not impact the interaction between GFP-Globin and CaM.
Relative mRNA expression levels of (A) MMP1, (B) MMP9, and (C) MMP13 in HEK293 cells grown in Dulbecco’s Minimum Essential Media (DMEM) containing regular fetal bovine serum (FBS) (‘non-treated’) and in HEK293 cells grown in DMEM containing heme-depleted FBS and treated with succinylacetone (‘Heme-depleted’) serve as positive control for heme deprivation (Kaur et al., 2021). (D) Representative immunoblot of GFP and V5 in heme-depleted HEK293 protein lysates following (co-)transfection of GFP-Globin domain and V5-CaM and immunoprecipitation (IP) of GFP. (E) Representative immunoblot of GFP and V5 in heme-depleted HEK293 protein lysates following (co-)transfection of a GFP-Globin domain construct with a double mutation of the proximal heme-binding histidine and the distal heme-binding glutamine (GFP-Globin-F8/E7[Gly]) and V5-CaM and IP of GFP.

References

    1. Andrews C, Xu Y, Kirberger M, Yang JJ. Structural Aspects and Prediction of Calmodulin-Binding Proteins. International Journal of Molecular Sciences. 2020;22:E308. doi: 10.3390/ijms22010308. - DOI - PMC - PubMed
    1. Avidor-Reiss T, Ha A, Basiri ML. Transition Zone Migration: A Mechanism for Cytoplasmic Ciliogenesis and Postaxonemal Centriole Elongation. Cold Spring Harbor Perspectives in Biology. 2017;9:a028142. doi: 10.1101/cshperspect.a028142. - DOI - PMC - PubMed
    1. Avidor-Reiss T, Carr A, Fishman EL. The sperm centrioles. Molecular and Cellular Endocrinology. 2020;518:110987. doi: 10.1016/j.mce.2020.110987. - DOI - PMC - PubMed
    1. Bähler M, Rhoads A. Calmodulin signaling via the IQ motif. FEBS Letters. 2002;513:107–113. doi: 10.1016/s0014-5793(01)03239-2. - DOI - PubMed
    1. Bracke A, Hoogewijs D, Dewilde S. Exploring three different expression systems for recombinant expression of globins: Escherichia coli, Pichia pastoris and Spodoptera frugiperda. Analytical Biochemistry. 2018;543:62–70. doi: 10.1016/j.ab.2017.11.027. - DOI - PubMed

Publication types

LinkOut - more resources