. 2022 Jun 21;119(25):e2123265119.
doi: 10.1073/pnas.2123265119. Epub 2022 Jun 14.

Blood-based untargeted metabolomics in relapsing-remitting multiple sclerosis revealed the testable therapeutic target

Affiliations

Blood-based untargeted metabolomics in relapsing-remitting multiple sclerosis revealed the testable therapeutic target

Insha Zahoor et al. Proc Natl Acad Sci U S A. .

Abstract

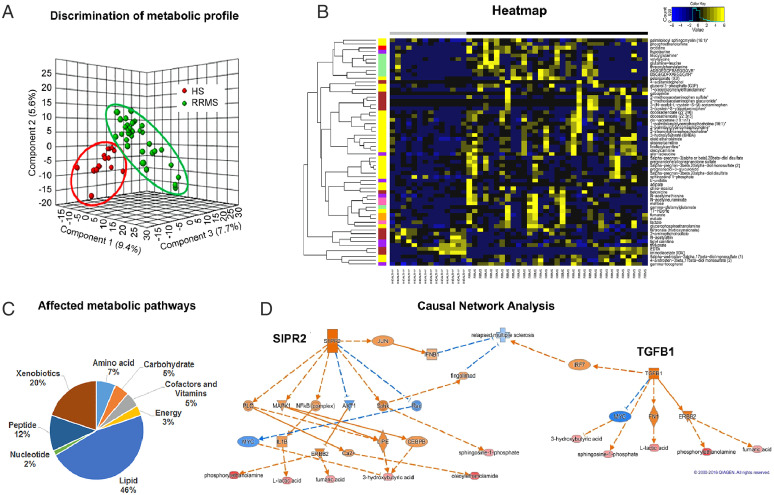
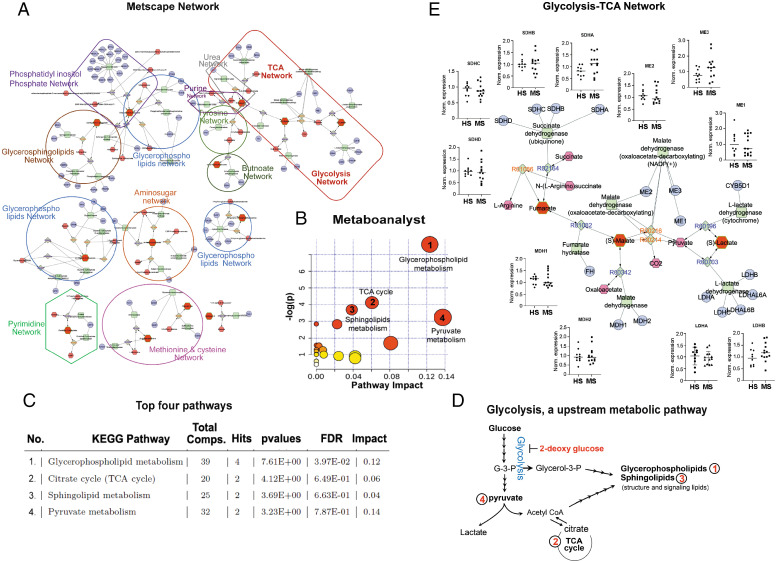
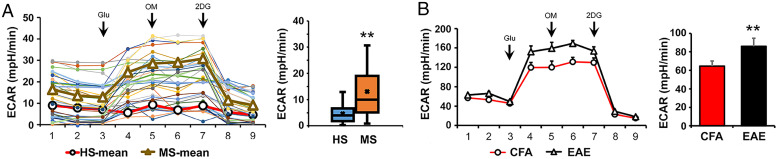
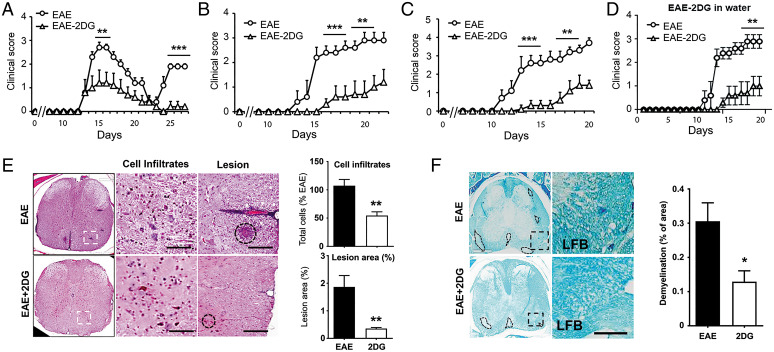
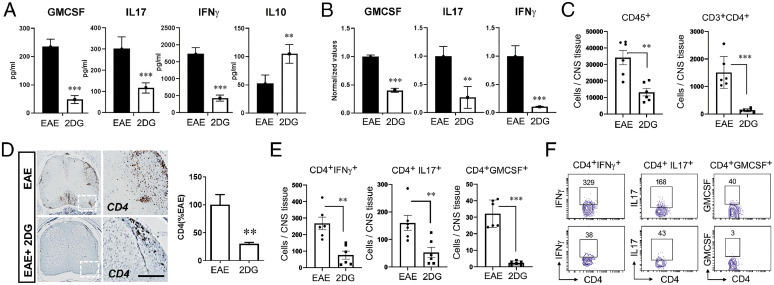
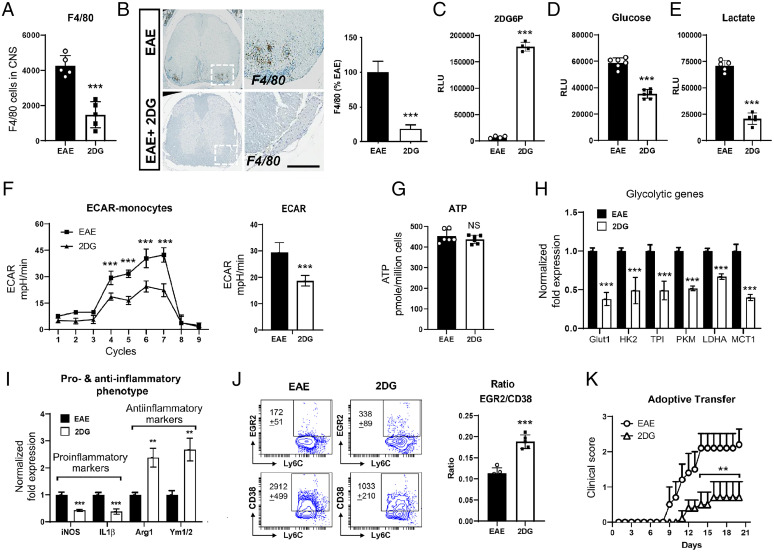
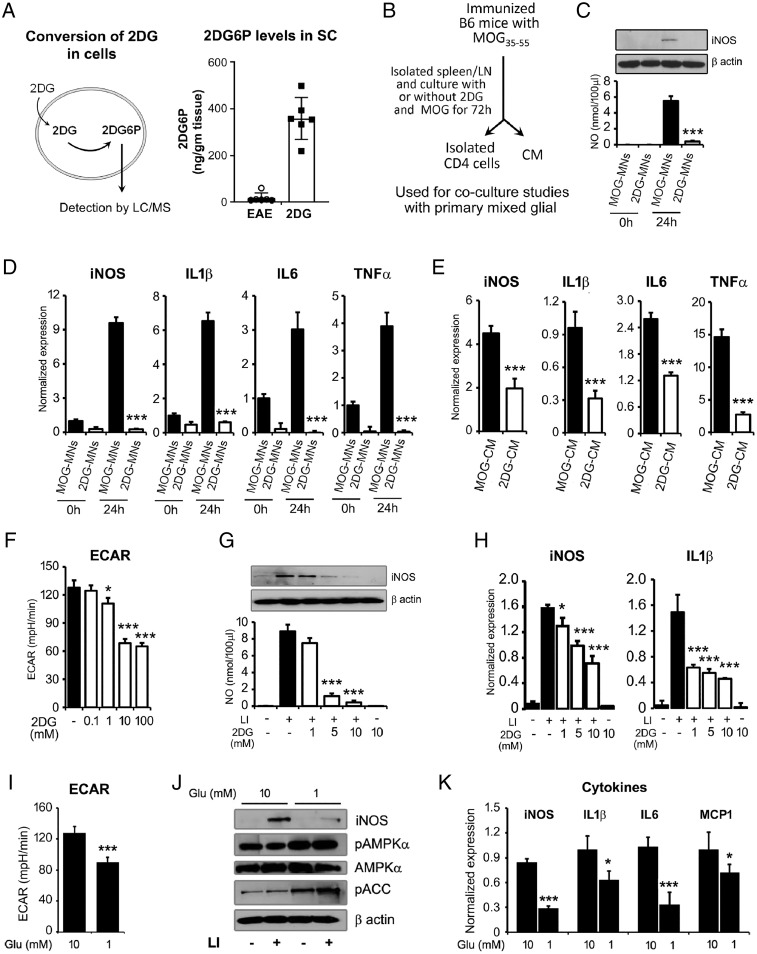
Metabolic aberrations impact the pathogenesis of multiple sclerosis (MS) and possibly can provide clues for new treatment strategies. Using untargeted metabolomics, we measured serum metabolites from 35 patients with relapsing-remitting multiple sclerosis (RRMS) and 14 healthy age-matched controls. Of 632 known metabolites detected, 60 were significantly altered in RRMS. Bioinformatics analysis identified an altered metabotype in patients with RRMS, represented by four changed metabolic pathways of glycerophospholipid, citrate cycle, sphingolipid, and pyruvate metabolism. Interestingly, the common upstream metabolic pathway feeding these four pathways is the glycolysis pathway. Real-time bioenergetic analysis of the patient-derived peripheral blood mononuclear cells showed enhanced glycolysis, supporting the altered metabolic state of immune cells. Experimental autoimmune encephalomyelitis mice treated with the glycolytic inhibitor 2-deoxy-D-glucose ameliorated the disease progression and inhibited the disease pathology significantly by promoting the antiinflammatory phenotype of monocytes/macrophage in the central nervous system. Our study provided a proof of principle for how a blood-based metabolomic approach using patient samples could lead to the identification of a therapeutic target for developing potential therapy.

Keywords: EAE; glycolysis; metabolomics; multiple sclerosis.


Conflict of interest statement

The authors declare no competing interest.

Figures

Fig. 1.
Fig. 1.
Patients with RRMS show an altered metabolic state metabotype compared with HS. (A) Three-dimensional PLS-DA plots showing significant discrimination of RRMS and HS. (B) Pie chart depicting the classification of metabolic perturbations in the serum of patients with RRMS compared with HS. (C) Heat map representative of the hierarchal clustering of the 60 metabolites from each of the replicates of serum from RRMS and HS. Shades of yellow represent elevation of a metabolite and shades of blue represent decrease of a metabolite relative to its mean level in these samples (see color scale). (D) Ingenuity’s IPA software CNA report identified G protein-coupled S1PR2 and TGF-β1 as master regulators predicted to be activated based on the altered levels of metabolites (bottom layer). Shades of orange shows prediction of activation and shades of blue shows prediction of inhibition. Bottom layer of these CNAs are metabolites that are differential between RRMS and HS, while shades of red shows up-regulation in RRMS.
Fig. 2.
Fig. 2.
Bioinformatics analysis identified glycolysis as an upstream to the altered metabolic pathways in RRMS. (A) Visualization and interpretation of metabolomic network of patients with RRMS using Metscape in the context of human metabolic networks. In Metscape, compounds are represented as hexagons, reactions are diamonds, enzymes are squares, and genes are circles. Input metabolites are represented as red hexagons with green border. (B) Sixty metabolites that displayed significantly different abundance between RRMS and HS were subjected for the pathway enrichment analysis (y axis, enrichment P values) and the pathway topology analysis (x axis, pathway impact values, and indicative of the centrality and enrichment of a pathway) in the pathway module of MetaboAnalyst 4.0. The color of a circle is indicative of the level of enrichment significance, with red being high and yellow being low. Bigger size of a circle is proportional to the higher impact value of the pathway. (C) The top four pathways that arise with low P values and with high impact are indicated in the table format. (D) Schematic indicating glycolysis is upstream to the four altered metabolic pathways identified in RRMS. (E) Schematic depicting the comparative analysis of gene expression between HS and RRMS cases for the enzymes involved in glycolytic-TCA pathway, linked with altered metabolites found in RRMS.
Fig. 3.
Fig. 3.
Higher glycolytic activity was observed in the PBMC of patients with RRMS and in preclinical mouse model (EAE). (A) Isolated PBMC of patients with RRMS (n = 17) and HS (n = 14) were analyzed for glycolysis (ECAR) measurement using Seahorse Bioanalyzer. (B) PBMC of EAE (n = 6) and CFA (n = 6) groups were analyzed for glycolysis measurement using Seahorse Bioanalyzer (mean + SEM). **P < 0.01; **P < 0.05 compared with HS.
Fig. 4.
Fig. 4.
Targeting energy pathway ameliorates disease progression in EAE mouse models. (AC) EAE was induced in SJL, B6, and 2D2 mice using PLP and MOG35-55, respectively. One set of the group was given daily 2DG (50 mg/kg body weight, intraperitoneally in 200 µL volume) and another set was given PBS as vehicle. Clinical score was taken until the end of the study (n = 15 per group). **P < 0.01; ***P < 0.001 compared with vehicle treated EAE group was considered as statistically significant. (D) EAE was induced in 2D2 mice with MOG and one set was given 2DG in drinking water (0.2 mg/mL; wt/vol) from day 7 postimmunization. Clinical score was taken until the end of the study (n = 6 per group). **P < 0.01 compared with vehicle-treated EAE group was considered as statistically significant. (E, F) Representative images shows histopathological changes in the spinal cord tissues in EAE mice with or without 2DG treatment. Sections were staind with hematoxylin and eosin to show cells infiltration and lesion size and Luxol fast blue to (LFB) to demonstrate changes in myelin content. Data were represented as mean ± SD (n = 6 mice/group). Scale bar, 100 μm. Statistical analyses were done with Student’s t test. Statistical significance was determined at P < 0.05.
Fig. 5.
Fig. 5.
Targeting energy pathway moldulates CD4 cells infiltration and response in EAE mouse. (A) On day 20, splenocytes of EAE-treated and untreated with 2DG in drinking water were stimulated with MOG35-55. Post-72 h, proinflammatory (GM-CSF, IL-17 and IFN-ɣ) and antiinflammatory (IL-10) were examined in cell supernatant using their specific enzyme-linked immunosorbent assay. The data presented are the mean ± SD of two independent experiments (n = 5 per group). (B) Expression of GM-CSF, IL-17, and IFN-ɣ were examined in splenocytes of both groups using quantitative PCR and normalized with the control gene; ribosomal L27 housekeeping gene. The data presented are the mean ± SD of four values. (C) Quantitation of CD45+ and CD3+CD4+ cell number in the spinal cord and brain of EAE and 2DG treated (drinking water) groups by flow cytometry. The data presented are the mean ± SD of six animals per group. (D) Representative immunohistochemical staining and quantitative analysis for CD4+ T cell infiltration in EAE induced mice with or without 2DG treatment in drinking water. Data were shown as mean ± SD (n = 6 mice per group). Scale bar, 100 µm. Statistical analysis was done by Student’s t test. Statistical significance was determined at P < 0.05. (E, F) Quantitation of IFN-ɣ, IL-17α, and GM-CSF producing CD4+ T cell number in the spinal cord and brain of EAE- and 2DG-treated (drinking water) groups. The data presented are the mean ± SD of six animals per group. *P < 0.05, **P < 0.01, and ***P < 0.001. Student’s t test, one-way analysis of variance.
Fig. 6.
Fig. 6.
2-Deoxy-glucose induced antiinflammatory phenotype of monocytes by abrogating glycolytic metabolic pathway. (A) Quantitation of CD45+F4/80+ infiltrated macrophage number in the spinal cord and brain of EAE- and 2DG-treated (drinking water) groups. The data presented are the mean ± SD of six animals per group. (B) Representative immunohistochemical staining and quantitative analysis for F4/80+ cell infiltration in EAE induced mice with or without 2DG treatment in drinking water. Data were shown as mean ± SD (n = 6 mice per group). Scale bar,100 µm. Statistical analysis was done by Student’s t test. Statistical significance was determined at P < 0.05. (C) Isolated monocytes (20,000 cells) from spleen cells from both groups were processed for the detection of 2 deoxy-glucose-6-phosphate (2DG6P) using Glucose Uptake-Glo Assay kit from Promega. The data presented are the mean ± SD of four values. (D, E) Isolated monocytes (> 92%) from spleen cells from both groups were plated (20 K per well) in 96-well plate and post 24 h, cell supernatant was processed for glucose and lactate measurement for determination of glucose consumption and lactate release in media. The data presented are the mean ± SD of six values per group. (F) Isolated monocytes from spleen cells from both groups were processed for glycolysis measurement using Seahorse Bioanalyzer (n = 8 per group). (G) ATP was measured in isolated monocytes using ATPlite luminescence assay kit from Perkin-Elmer. The data presented are the mean ± SD of six values per group. (H) Expression of glycolytic genes including glucose transporter 1 (Glut 1), hexokinase 2 (HK2), triose-phosphate isomerase (TPI), pyruvate kinase M (PKM), LDHA, and monocarboxylate transporter 1 (MCT1) were examined in isolated monocytes from both groups using quantitative PCR. Expression of glycolytic genes were normalized with the control gene; ribosomal L27 housekeeping gene. The data presented are the mean ± SD of four values per group. (I) Expression of proinflammatory (iNOS and IL-1β] and antiinflammatory (arginase 1 [Arg-1] and chitinase-like 3 [Ym1/2]) specific genes were examined in isolated monocytes from both groups using quantitative PCR and normalized with the control gene; ribosomal L27 housekeeping gene. The data presented are the mean ± SD of four values per group. (J) The ratio of EGR2 and CD38, a marker for antiinflammatory and proinflammatory were examined on Ly6C+ cells gated on CD11b+Ly6G population by flow cytometry in the spleen of treated and untreated EAE group with 2DG on day 20 postimmunization. (K) Adoptive transfer of monocytes from EAE and 2DG treated EAE groups on day 6 in B6 mice immunized with MOG35-55. The data presented are the mean ± SEM of five animals per group. n = 4 to 6 per group; *P < 0.05, **P < 0.01, and ***P < 0.001. Student t test, one-way ANOVA.
Fig. 7.
Fig. 7.
Reduction in glycolysis inhibits activation of brain glial cells. (A) 2-deoxyglucose (2DG) is taken up by cells/tissues and phosphorylated to produce 2-deoxyglucose-6-phosphate (2DG6P), which cannot be metabolized further. Accumulated levels of 2DG6P was detected by LC/MS in the spinal cord of EAE and 2DG-treated EAE. Data were shown as mean ± SD (n = 6 mice per group). (B) Schematic flow of experimental design to generate CM and activated MNs cells in the presence or absence of 2DG (1 mM) and used for further experiments. (C, D) For in vitro coculture model, treated and untreated MOG-primed MNs cells with 2DG were cocultured with primary brain glial cells (4:1 ratios of MNs cells:mixed glial cells) for 24h and were processed for nitric oxide (NO), iNOS, and cytokines expression by immunoblot and qPCR. The data presented are the mean ± SD of three values per group. (E) MOG-CM and 2DG-CM were added in culture media of mixed glia (1:1 ratio with serum-free RPMI) and expression of inflammatory mediator (iNOS) and cytokines (IL-1β, IL-6, and TNF-α) was examined by qPCR. (F) Dose-dependent effect of 2DG (0.1 to 100 mM) on ECAR in brain glial cells using Seahorse Bioanalyzer (n = 6 per group). (G, H) Brain glial cells were treated with 2DG (1 to 10 mM) for 30 min prior the treatment of LI (0.5 µg/10 ng per milliliter). Post 18 h, cells were processed for iNOS immunoblot analysis and cell supernatant was processed for NO. Under similar experimental condition, at 6 h of LI stimulation, cells were processed for RNA isolation and qPCR for the detection of iNOS and IL-1β. The data presented are the mean ± SD of three values per group. (I) Impact of glucose on ECAR in brain glial cells using Seahorse Bioanalyzer (n = 6 per group). (J) Primary brain glial cells were cultured in normal (10 mM) and low (1 mM) glucose condition in RPMI for 24 h followed by stimulation with LI for 18 h. The levels of iNOS, pAMPKα, AMPKα, and pACC were examined by immunoblot analysis using their specific antibodies. Beta actin was used to examine the equal protein loading. Represented blots are the one of the two independent experiments. (K) Primary brain glial cells were cultured in normal (10 mM) and low (1 mM) glucose condition in RPMI for 24 h followed by stimulation with LI for 6 h. Cells were processed for RNA isolation and qPCR for the detection of iNOS, IL-1β, IL6, and MCP1. The data presented are the mean ± SD of three values per group. *P < 0.05, **P < 0.01, and ***P < 0.001. Student t test, one-way analysis of variance.

References

    1. Compston A., Coles A., Multiple sclerosis. Lancet 372, 1502–1517 (2008). - PubMed
    1. Torkildsen Ø., Myhr K. M., Bø L., Disease-modifying treatments for multiple sclerosis—A review of approved medications. Eur. J. Neurol. 23 (suppl. 1), 18–27 (2016). - PMC - PubMed
    1. Saidha S., Eckstein C., Calabresi P. A., New and emerging disease modifying therapies for multiple sclerosis. Ann. N. Y. Acad. Sci. 1247, 117–137 (2012). - PubMed
    1. Zhang A. H., Sun H., Wang X. J., Recent advances in metabolomics in neurological disease, and future perspectives. Anal. Bioanal. Chem. 405, 8143–8150 (2013). - PubMed
    1. Zahoor I., Rui B., Khan J., Datta I., Giri S., An emerging potential of metabolomics in multiple sclerosis: A comprehensive overview. Cell. Mol. Life Sci. 78, 3181–3203 (2021). - PMC - PubMed

Publication types

MeSH terms

LinkOut - more resources