. 2022 Aug 3;110(15):2438-2454.e8.
doi: 10.1016/j.neuron.2022.05.016. Epub 2022 Jun 13.

GluN3A excitatory glycine receptors control adult cortical and amygdalar circuits

Affiliations

GluN3A excitatory glycine receptors control adult cortical and amygdalar circuits

Simon Bossi et al. Neuron. .

Abstract

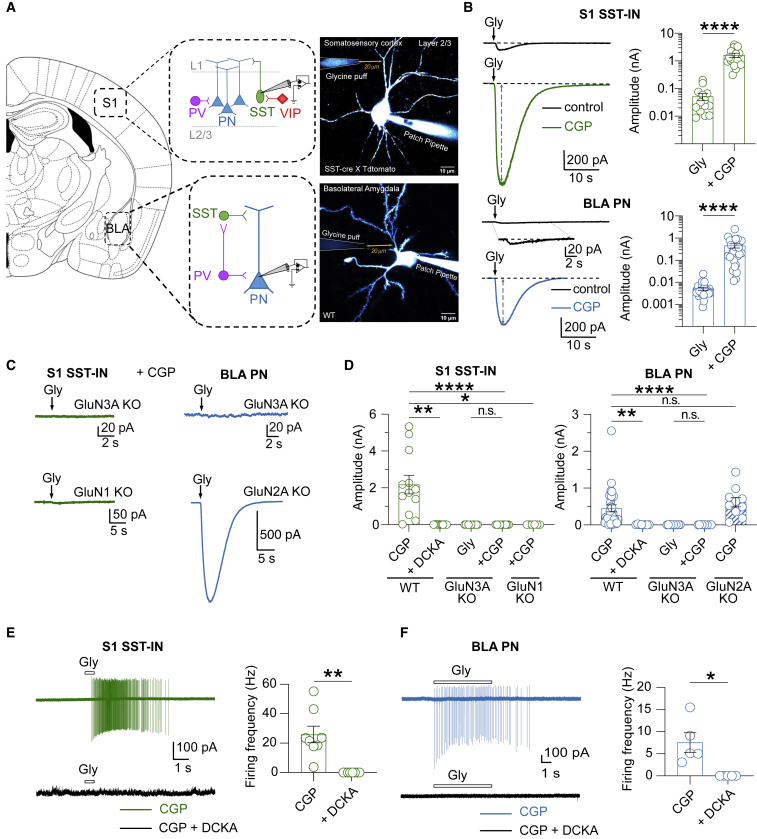
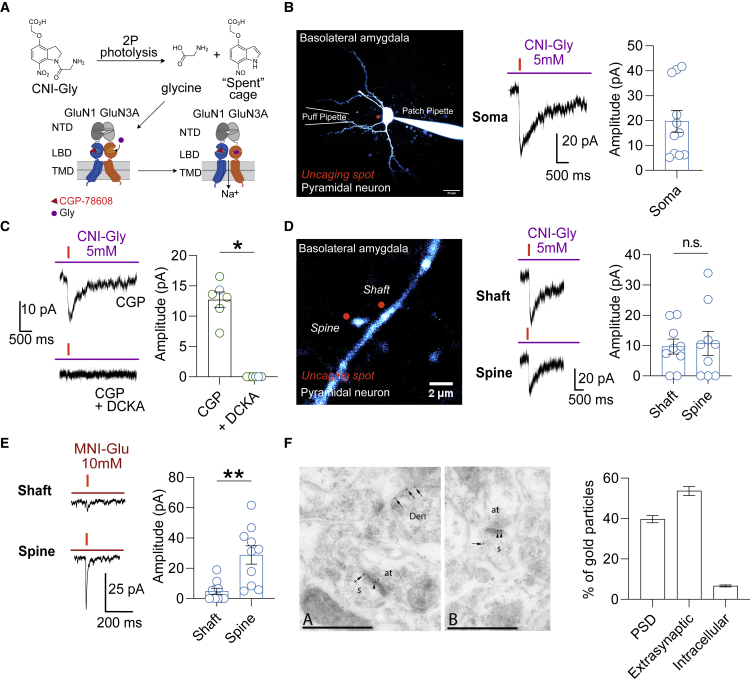
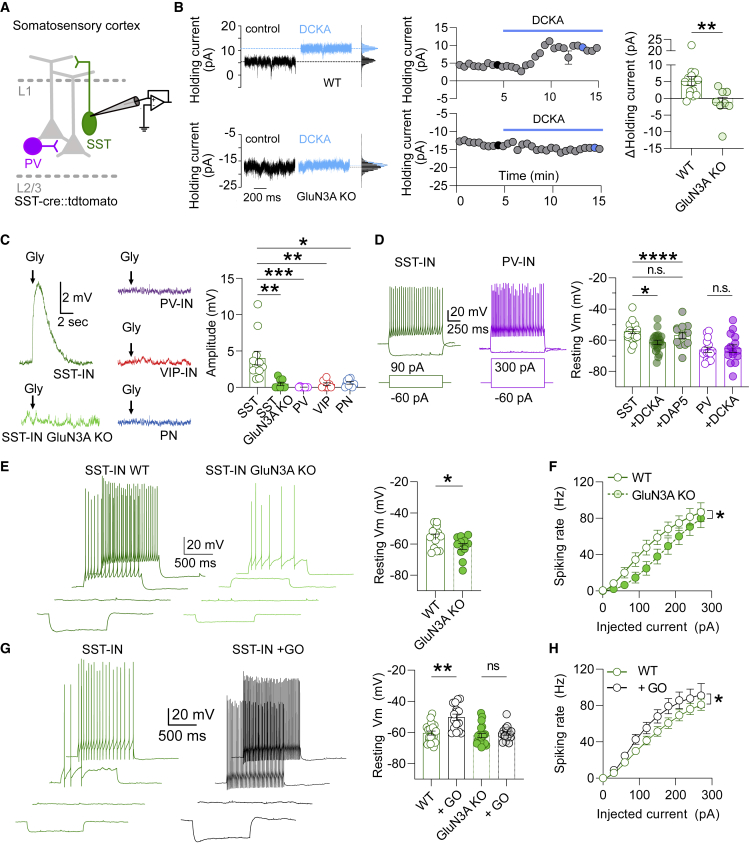
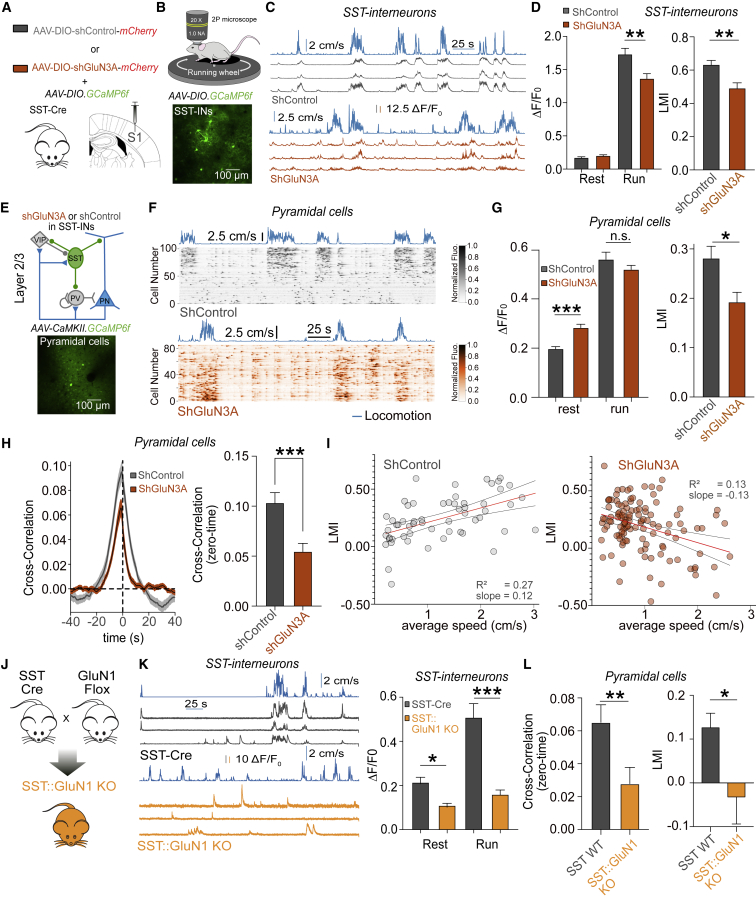
GluN3A is an atypical glycine-binding subunit of NMDA receptors (NMDARs) whose actions in the brain are mostly unknown. Here, we show that the expression of GluN3A subunits controls the excitability of mouse adult cortical and amygdalar circuits via an unusual signaling mechanism involving the formation of excitatory glycine GluN1/GluN3A receptors (eGlyRs) and their tonic activation by extracellular glycine. eGlyRs are mostly extrasynaptic and reside in specific neuronal populations, including the principal cells of the basolateral amygdala (BLA) and SST-positive interneurons (SST-INs) of the neocortex. In the BLA, tonic eGlyR currents are sensitive to fear-conditioning protocols, are subject to neuromodulation by the dopaminergic system, and control the stability of fear memories. In the neocortex, eGlyRs control the in vivo spiking of SST-INs and the behavior-dependent modulation of cortical activity. GluN3A-containing eGlyRs thus represent a novel and widespread signaling modality in the adult brain, with attributes that strikingly depart from those of conventional NMDARs.

Keywords: GluN3A; NMDA; amygdala; cortex; fear; glycine; interneuron; neurotransmission; receptors; somatostatin interneurons; tonic activation.


Conflict of interest statement

Declaration of interests The authors declare no competing interests.

Figures

None
Graphical abstract
Figure 1
Figure 1
Functional expression of eGlyRs in adult amygdala and neocortex (A) Schematic representation of the canonical cellular organization of S1 and BLA microcircuits. Right: two-photon laser scanning microscopy (2PLSM) images of a patched cortical SST-IN in S1 and a PN in the BLA with the location of the glycine puff pipette. (B) Sample traces and peak amplitudes of glycine (10 mM)-puff-evoked inward currents in S1 SST-INs (n = 15) and BLA PNs (n = 29) in control conditions and after the bath application of CGP-78608 (1–2 μM; ∗∗∗∗p < 0.0001, Wilcoxon signed-rank test). (C and D) Same as (B) but for the brain slices from GluN3A KO mice (S1, WT [n = 12] versus GluN3A KO [n = 10], p < 0.0001; BLA, WT [n = 29] versus GluN3A KO [n = 11], p < 0.0001) or after the bath application of DCKA (S1: control [n = 12] versus DCKA [n = 12], p = 0.0112; BLA: control [n = 29] versus DCKA [n = 8], p = 0.0046). Glycine-evoked currents are also absent in the GluN1 lacking S1 SST-INs (GluN1 KO; n = 7, p = 0.00313). By contrast, removing GluN2A subunits does not affect the glycine-evoked currents in the BLA (GluN2A KO; n = 10; p > 0.99 Kruskal-Wallis followed by Dunn’s multiple comparisons test). (E) In S1 SST-INs, the puffs of glycine (10 mM) elicit action potential firing in the presence of CGP-78608 (1–2 μM), an effect antagonized by DCKA (500 μM) application (n = 8, p = 0.0026, paired t test). (F) Same as (E) but for BLA PNs (n = 5, p = 0.0271, paired t test). (B, D, E, and F) Bars indicate mean ± SEM.
Figure 2
Figure 2
eGlyR expression is cell specific, and GluN3A subunits mainly form diheteromeric GluN1/GluN3A complexes in adult cortical and BLA neurons (A) Representative traces and amplitudes of glycine (10 mM)-evoked currents in S1 neurons in the presence of CGP-78608 (1–2 μM). Note the particular enrichment in SST-INs (SST-INs [n = 15] versus PNs [n = 8], p = 0.0001; versus PV-INs [n = 8], p < 0.0001; versus VIP-INs [n = 8], p = 0.0030, Kruskal-Wallis followed by Dunn’s multiple comparisons test). Application of CGP-78608 revealed small statistically significant currents in VIP-INs, yet they were considerably smaller than those in SST-INs. No statistically significant currents were detected in PNs and PV-INs. (B) Same as (A) but for three interneuron populations (SST, PV, and GAD-65) in the BLA (GAD-65 [n = 10]; versus SST-INs [n = 9], p = 0.0059; versus PV-INs [n = 6], p = 0.0786, Kruskal-Wallis followed by Dunn’s multiple comparisons test). (C) Example traces (−60, −20, and +40 mV) and current-voltage relationship of synaptic NMDA-EPSCs from the S1 SST-INs in WT and GluN3A KO mice (−60 mV: WT [n = 8] versus GluN3A KO [n = 7], p = 0.5358; −80 mV: WT [n = 8] versus GluN3A KO [n = 7], p = 0.0721, Mann-Whitney U test). Points represent mean ± SEM. (D) Example traces (−60, −20, and +50 mV) and current-voltage relationship of NMDAR currents elicited by pressure-applied NMDA in the BLA PNs in WT and GluN3A KO mice (−60 mV: WT [n = 5] versus GluN3A KO [n = 6], p = 0.5368; −80 mV: WT [n = 5] versus GluN3A KO [n = 6], p = 0.6623, Mann-Whitney U test). Points represent mean ± SEM. (E) Example traces and summary plot of synaptic NMDA/AMPA ratio recorded in the S1 SST-INs of WT, GluN3A KO, and SST:GluN1 KO mice. Note that removing GluN3A subunit does not alter the NMDA/AMPA ratio, whereas the loss of GluN1 abolishes NMDAR currents (WT [n = 9] versus GluN3A KO [n = 10], p = 0.7635; versus GluN1 KO [n = 6], p = 0.0006, Kruskal-Wallis followed by Dunn’s multiple comparisons test). (F) Same as (E) but for BLA PNs (WT [n = 6] versus GluN3A KO [n = 7], p = 0.8072, unpaired t test). (A, B, E, and F) Bars indicate mean ± SEM.
Figure 3
Figure 3
GluN1/GluN3A receptors are diffusively distributed across different neuronal subcellular compartments (A) Scheme of uncaging reaction for CNI glycine (CNI-Gly) upon illumination and glycine action on GluN1/GluN3A receptors. Uncaging experiments were performed in the continuous presence of CGP-78608 (1 μM). (B) Left: 2PLSM image of a fluorescently labeled BLA pyramidal neuron (PN). Right: example trace and summary plot of amplitudes of photolysis-evoked currents (obtained in the somas of BLA PNs) with a local application of 10 mM CNI-Gly (20-ms duration, n = 11). (C) Photolysis-evoked currents are fully inhibited by DCKA (control versus DCKA, n = 6, p = 0.0313; Wilcoxon test). The plotted values represent data points obtained in both BLA PNs (blue) and S1 SST-INs (green). (D) Amplitudes of light-evoked glycine currents in the shaft and spines of BLA PNs (n = 9, p = 0.8369, paired t test). (E) Same as (D) but using MNI glutamate (MNI-Glu; 1-ms duration, n = 10, p = 0.0021, paired t test). (F) Electron micrographs showing immunogold particles for the GluN3A subunits in the BLA. Den, dendritic shaft; s, dendritic spine; at, axon terminal. Arrowhead, postsynaptic density (PSD); crossed arrow, perisynaptic site; arrow, extrasynaptic site. Scale bars, 0.5 μm. Right: quantification of the subcellular distribution of GluN3A immunogold particles (PSD [39.7% ± 1.0%), extrasynaptic [53.7% ± 1.3%], and intracellular [6.6% ± 0.3%], n = 3). (B–F) Bars indicate mean ± SEM.
Figure 4
Figure 4
eGlyRs are tonically active and impact the neuronal excitability of BLA PNs (A) Schematic representation of the canonical cellular organization of basolateral amygdala (BLA) microcircuit depicting a whole-cell patch-clamped pyramidal neuron (PN). (B) Example traces, time course, and summary plot of the variations in the holding currents in BLA PNs upon DCKA (500 μM) application. Effect is shown for WT, GluN3A KO mice, and DTE-treated slices (WT [n = 18] versus GluN3A KO [n = 11], p = 0.0478; WT [n = 18] versus DTE-treated [n = 7], p = 0.0003, Kruskal-Wallis followed by Dunn’s multiple comparisons test). (C) Same as (B) but for the bath application of the glycine transporter GlyT1 inhibitor sarcosine (WT [n = 9] versus GluN3A KO [n = 13], unpaired t test). (D) Bath application of glycine (10 μM) induced DCKA-sensitive inward currents in BLA PNs in the slices from WT but not GluN3A KO mice (WT [n = 8] versus GluN3A KO [n = 9], p = 0.0003, Mann-Whitney U test; WT [n = 8] versus DCKA [8], p = 0.0078, Wilcoxon test). (E) Summary plot of resting membrane potential values for BLA PNs obtained in control conditions and after the bath application of glycine (10 μM; control [n = 5] versus glycine 10 μM [n = 5]; p = 0.0283, paired t test). (F) Left: illustration of experimental approach used to probe the changes in the excitability of BLA PNs. Right: sarcosine enhances the action potential firing of BLA PNs in response to extracellular stimulation in WT but not in GluN3A KO mouse slices (WT: control versus sarcosine [n = 9], p = 0.0004; paired t test; GluN3A KO: control versus sarcosine [n = 10], p = 0.0957, paired t test). (B–F) Bars indicate mean ± SEM.
Figure 5
Figure 5
eGlyRs control the resting membrane potential of neocortical SST-INs (A) Schematic representation of the canonical cellular organization of layer 2/3 in S1 depicting a whole-cell patch-clamped SST-IN. (B) Example traces, time course, and summary plot of the variations in the holding currents in SST-INs upon DCKA (500 μM) application in WT and GluN3A KO mice (WT [n = 18] versus GluN3A KO [n = 11], p = 0.0478, Kruskal-Wallis followed by Dunn’s multiple comparisons test). (C) Example traces and summary plot of the measured EPSPs obtained in response to the puff application of glycine (1 mM) in different cell populations of layer 2/3 of S1. Note significantly larger membrane depolarizations in SST-INs and absence in GluN3A KO mice (SST-INs [n = 11] versus PNs [n = 8], p = 0.0203; versus PV-INs [n = 8], p < 0.0001; versus VIP-INs [n = 8], p = 0.0016; SST-INs GluN3A KO [n = 8], p = 0.0012, Kruskal-Wallis followed by Dunn’s multiple comparisons test). (D) Left: representative current-clamp traces of membrane potential responses to injections of current steps applied to SST-INs (green) and PV-INs (fuchsia) in S1. Right: summary plot of the resting membrane potential values for SST-INs and PV-INs obtained in control conditions and after the addition of DCKA (500 μM) or D-AP5 (50 μM; SST versus SST + DCKA [n = 20], p = 0.0256; PV versus PV + DCKA [n = 15], p > 0.9999; control [n = 20] versus D-AP5 [n = 13], p > 0.99; Kruskal-Wallis followed by Dunn’s multiple comparisons test). (E) Same as (D) but for current-clamp recordings performed in the slices from WT and GluN3A KO mice. Left: electrophysiological traces represent the membrane potential responses to injections of current steps of increasing amplitude (−60, 0, 60, and 90 pA) to SST-INs. Right: SST-INs Vmrest values are more hyperpolarized in GluN3A-lacking slices (WT [n = 14] versus GluN3A KO [n = 12], p = 0.0356, Mann-Whitney U test). (F) Spiking frequency as a function of injected current for the SST-INs recorded in the slices from WT and GluN3A KO mice. Solid line represents the fit of Equation 1 (see STAR Methods) that is statistically different between WT [n = 14] and GluN3A KO [n = 12] mice; p = 0.001, extra-sum-of-squares F test. (G) Same as (E) but for the current-clamp recordings performed in the slices treated with the enzyme glycine oxidase (GO). Reducing extracellular glycine levels with glycine oxidase depolarizes the Vmrest values of SST-INs in the slices from WT but not GluN3A KO mice (WT [n = 20] versus WT + GO [n = 16], p = 0.0012; GluN3A KO [n = 21] versus GluN3A KO + GO [n = 16], p = 0.6652, Kruskal-Wallis followed by Dunn’s multiple comparisons test). (H) Same as (F) but for the brain slices incubated with glycine oxidase (WT [n = 18] versus GO [n = 11], p = 0.001, extra-sum-of-squares F test). (B–G) Bars indicate mean ± SEM.
Figure 6
Figure 6
In vivo activity of eGlyRs shapes the behavior-dependent modulation of neocortical networks (A) Schematic illustration of the experimental conditions used to monitor the impact of eGlyRs on cortical activity (see STAR Methods). (B) 2P calcium imaging in S1 of awake mice. Mice were head fixed and were free to run on a circular treadmill. Bottom: in vivo 2PSLM images of S1 SST-INs labeled with GCaMP6s. (C) Example traces of GCaMP6s fluorescence transients (ΔF/F0) obtained from the individual S1 SST-INs in the SST-Cre mice expressing either shControl (top, gray traces) or shGluN3A (bottom, orange traces) with corresponding locomotion trace (cm/s, blue traces). (D) Changes in GCaMP6s fluorescence quantified as average ΔF/F0 in SST-INs during rest and run states in SST-Cre mice expressed with shControl or shGluN3A (rest: shControl [n = 447] versus shGluN3A [n = 385 neurons], p = 0.1562; run: shControl [n = 447] versus shGluN3A [n = 385 neurons], p = 0.0048, Mann-Whitney test). Right: histogram of the distribution of locomotion modulation index (LMI, p = 0.012, Mann-Whitney test). (E) Top: schematic illustration of layer 2/3 microcircuits in S1; bottom: in vivo 2PSLM images of S1 PNs labeled with GCaMP6f. (F) Raster plot of the pyramidal cell activity in the S1 from awake mice spontaneously transitioning between resting periods and periods of locomotion. SST-Cre mice expressed shGluN3A of shControl sequences in SST-INs. Each row represents a neuron sorted by weight on the first principal component (PC) of their activity. (G) Same as (D) but for L2/3 PNs (rest: shControl [n = 73 sessions, 5,773 neurons] versus shGluN3A [n = 120 sessions, 6,517 neurons], p < 0.001; run: shControl [n = 73] versus shGluN3A [n = 120], p = 0.7394). Right: LMI (p = 0.0217, Mann-Whitney test). (H) Left: cross-correlation between ΔF/F0 and running speed (left) for the PNs in the mice expressing shControl of shGluN3A in SST-INs. Thick lines represent average (shControl [n = 73 sessions, 5,773 neurons] and shGluN3A [n = 120 sessions, 6,517 neurons]) and SEM. Right: summary plot of cross-correlation values at zero time for the experiments listed on the left panel. (I) Variation in LMI with the average running speed for L2/3 PNs. Red lines are linear fits through all points with gray lines representing 95% confidence intervals of the fits. A positive significant correlation was obtained for shControl, whereas a negative correlation was observed for shGluN3A (shControl: p < 0.001, R2 = 0.27, n = 73; shGluN3A: p < 0.001, R2 = 0.13, n = 120). (J) Genetic deletion of the GluN1 subunits from SST-INs by crossing SST-Cre mice with mice carrying a floxed GluN1 gene. (K) Same as (C) and (D) but for the SST-INs from WT or SST:GluN1 KO mice (rest: WT [n = 120 neurons] versus SST:GluN1 KO [n = 220 neurons], p = 0.0005; run: WT [n = 120 neurons] versus SST:GluN1 KO [n = 220 neurons], p < 0.0001, Mann-Whitney test). (L) Effect of the deletion of GluN1 subunit from SST-INs on the cross-correlation between ΔF/F0 and running speed as well as the locomotion modulation index of PNs in S1 (WT [n = 40 sessions, 1,141 neurons] versus SST:GluN1 KO [n = 47 sessions, 1,322 neurons], cross-correlation, p = 0.0021; LMI, p = 0.0436, Mann-Whitney test). (D, G, H, K and L) Bars indicate mean ± SEM.
Figure 7
Figure 7
eGlyR activity is plastic and participate in the consolidation of fear memories (A) Schematic of the experimental approach used in (B). Mice were exposed to a fear-conditioning protocol (see STAR Methods) and then quickly sacrificed for brain slicing and patch-clamp experiments on BLA PNs. (B) CGP-78608 (1 μM) enhances the holding currents of the BLA PNs from the mice subjected to the fear-conditioning protocol but not in control animals (control [n = 11] versus after conditioning [n = 9], p < 0.0001, Mann-Whitney U test). (C) Similar to (B), but for the slices incubated with dopamine (60 μM). Note that prior exposure to dopamine enhanced the holding currents of BLA PNs induced by CGP-78608 (1 μM) when compared with control (non-incubated) slices (control [n = 7] versus dopamine incubation [n = 10], p = 0.0002, Mann-Whitney U test). (D) DCKA application revealed enhanced tonic inward currents in BLA PNs after dopamine incubation (control [n = 18] versus dopamine incubation [n = 11], p = 0.0108, Mann-Whitney U test). (E) Cartoon depicting the locations used for bilateral viral injections in BLA neurons. Mice were injected with either AAV9-GFP-H1-scr-shRNA (shControl) or AAV9-CMV-EGFP-H1-shGluN3A (shGluN3A). Inset shows infected BLA PNs expressing the green reporter (GFP or EGFP). (F) Effect of expressing shControl (n = 10 animals) or shGluN3A (n = 11 animals) in BLA neurons on the acquisition, consolidation, and extinction of conditioned fear. Fear conditioning—interaction: F(4,76) = 0.7496, p = 0.5613 and group difference: F(1,19) = 0.1723, p = 0.6827; extinction period 1—interaction: F(7,133) = 0.9124, p = 0.4990 and group difference: F(1,19) = 6.202, p = 0.0222, two-way repeated measures ANOVA. Freezing during the first 3 tones #, p = 0.0357, Mann-Whitney test. Rate of fear extinction during period 1—inset, p = 0.6539, Mann-Whitney test. Both groups reached similar extinction levels by the end of day 2. (B, C, D, and F) Bars indicate mean ± SEM.

Comment in

References

    1. Al-Hallaq R.A., Jarabek B.R., Fu Z., Vicini S., Wolfe B.B., Yasuda R.P. Association of NR3A with the N-methyl-d-aspartate receptor NR1 and NR2 subunits. Mol. Pharmacol. 2002;62:1119–1127. doi: 10.1124/mol.62.5.1119. - DOI - PubMed
    1. Awobuluyi M., Yang J., Ye Y., Chatterton J.E., Godzik A., Lipton S.A., Zhang D. Subunit-specific roles of glycine-binding domains in activation of NR1/NR3 N-methyl-d-aspartate receptors. Mol. Pharmacol. 2007;71:112–122. doi: 10.1124/mol.106.030700. - DOI - PubMed
    1. Basu A.C., Tsai G.E., Ma C.-L., Ehmsen J.T., Mustafa A.K., Han L., Jiang Z.I., Benneyworth M.A., Froimowitz M.P., Lange N., et al. Targeted disruption of serine racemase affects glutamatergic neurotransmission and behavior. Mol. Psychiatry. 2009;14:719–727. doi: 10.1038/mp.2008.130. - DOI - PMC - PubMed
    1. Chatterton J.E., Awobuluyi M., Premkumar L.S., Takahashi H., Talantova M., Shin Y., Cui J., Tu S., Sevarino K.A., Nakanishi N., et al. Excitatory glycine receptors containing the NR3 family of NMDA receptor subunits. Nature. 2002;415:793–798. doi: 10.1038/nature715. - DOI - PubMed
    1. Ciabarra M., Sevarino A., Gahn G., Pecht G., Heinemann S., Sevarino K.A. Cloning and characterization of chi-1: a developmentally regulated member of a novel class of the ionotropic glutamate receptor family. J Neurosci. 1995;15:6498–6508. doi: 10.1523/JNEUROSCI.15-10-06498.1995. - DOI - PMC - PubMed

Publication types

LinkOut - more resources