. 2022 Aug 17;110(16):2664-2679.e8.
doi: 10.1016/j.neuron.2022.05.015. Epub 2022 Jun 13.

Single-cell activity and network properties of dorsal raphe nucleus serotonin neurons during emotionally salient behaviors

Affiliations

Single-cell activity and network properties of dorsal raphe nucleus serotonin neurons during emotionally salient behaviors

Grace E Paquelet et al. Neuron. .

Abstract

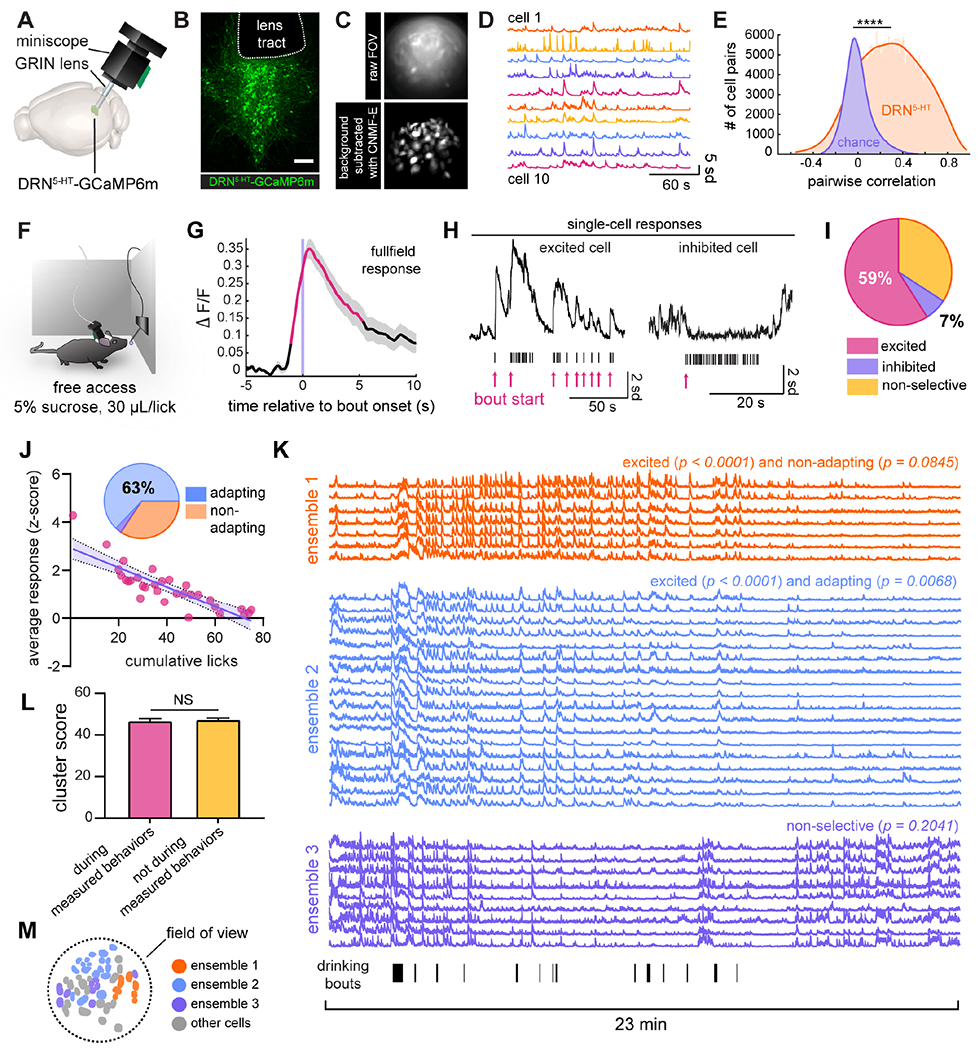
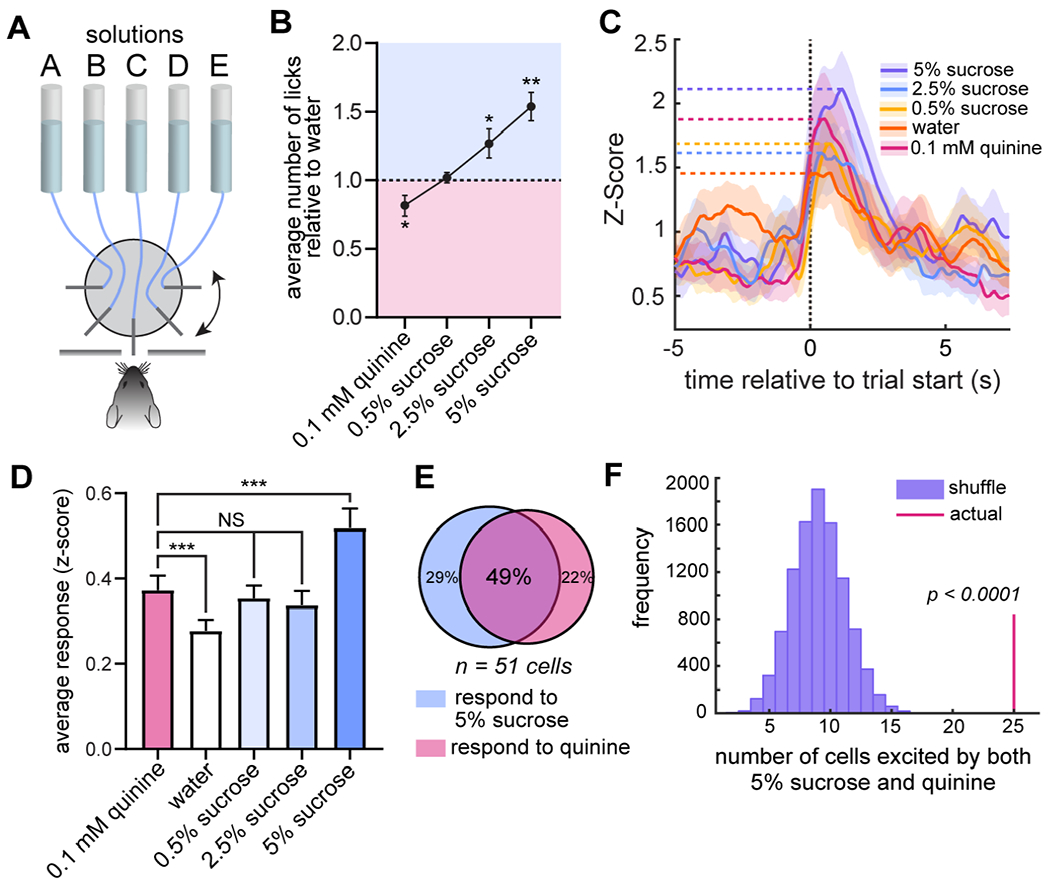
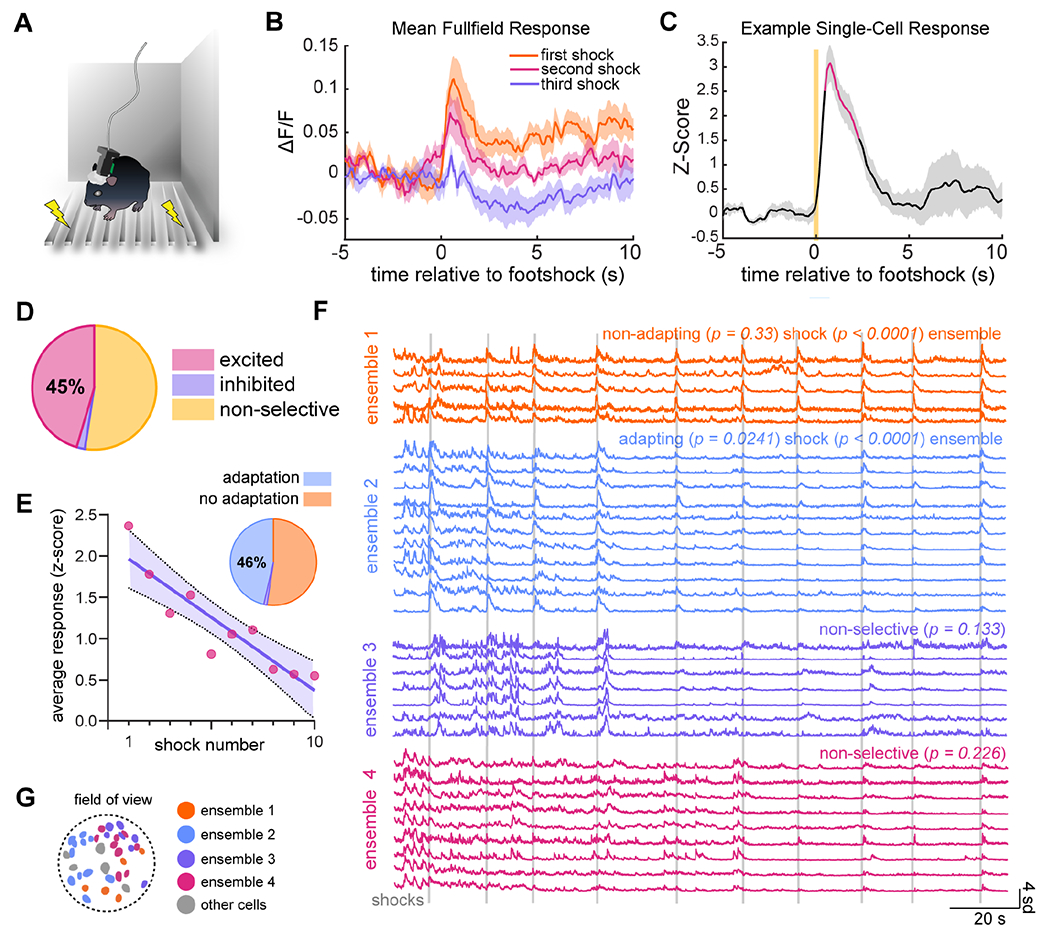
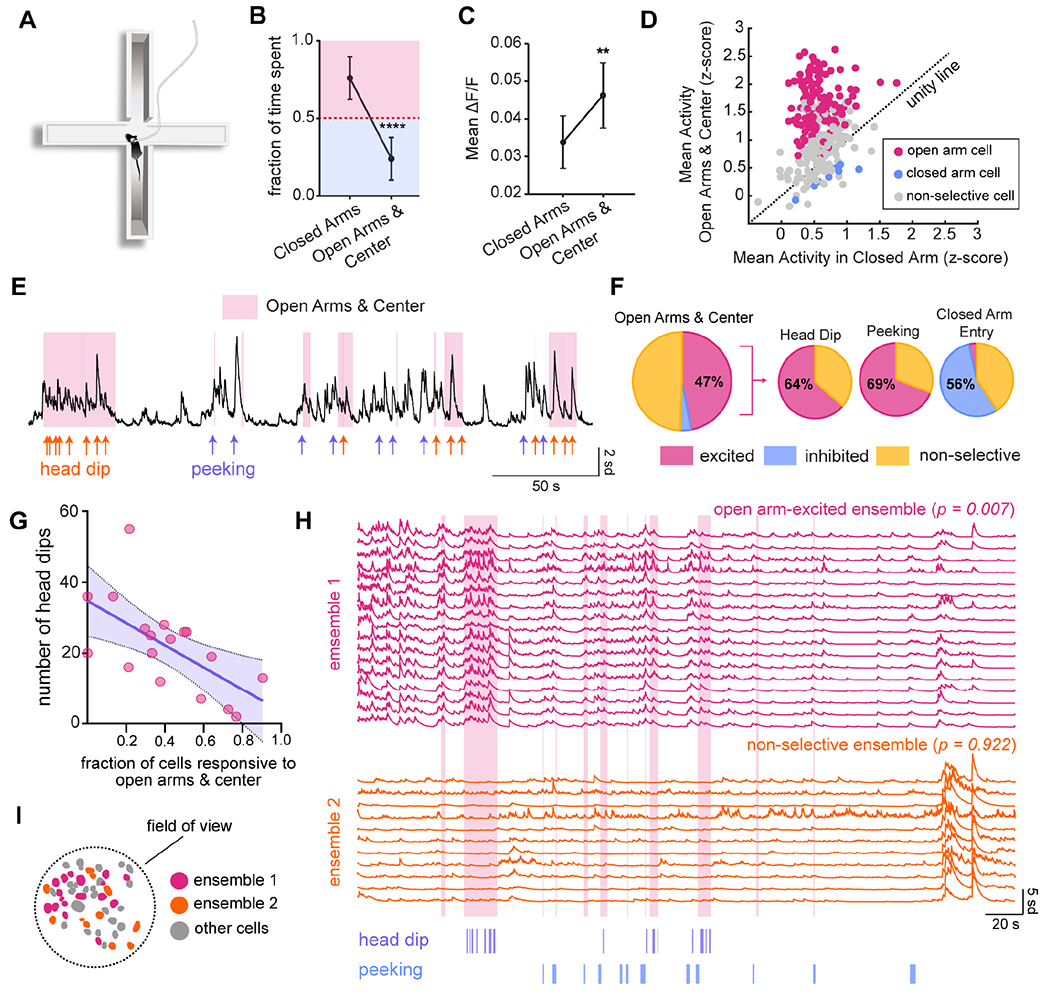
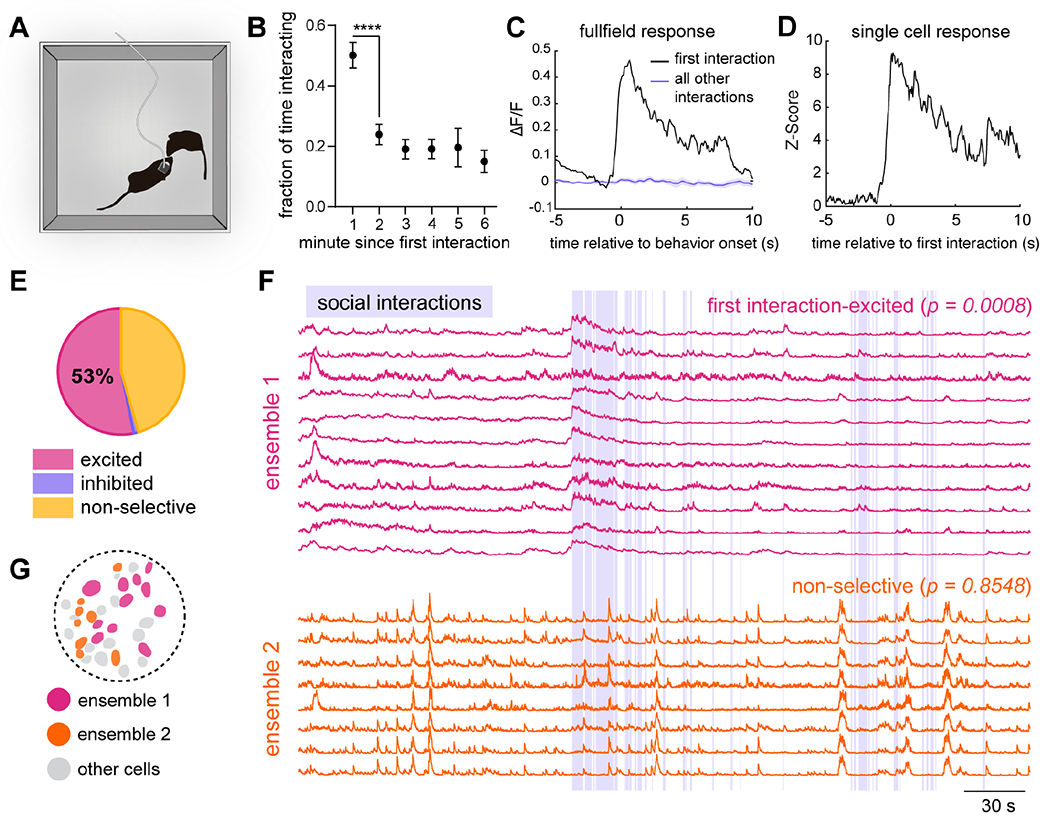
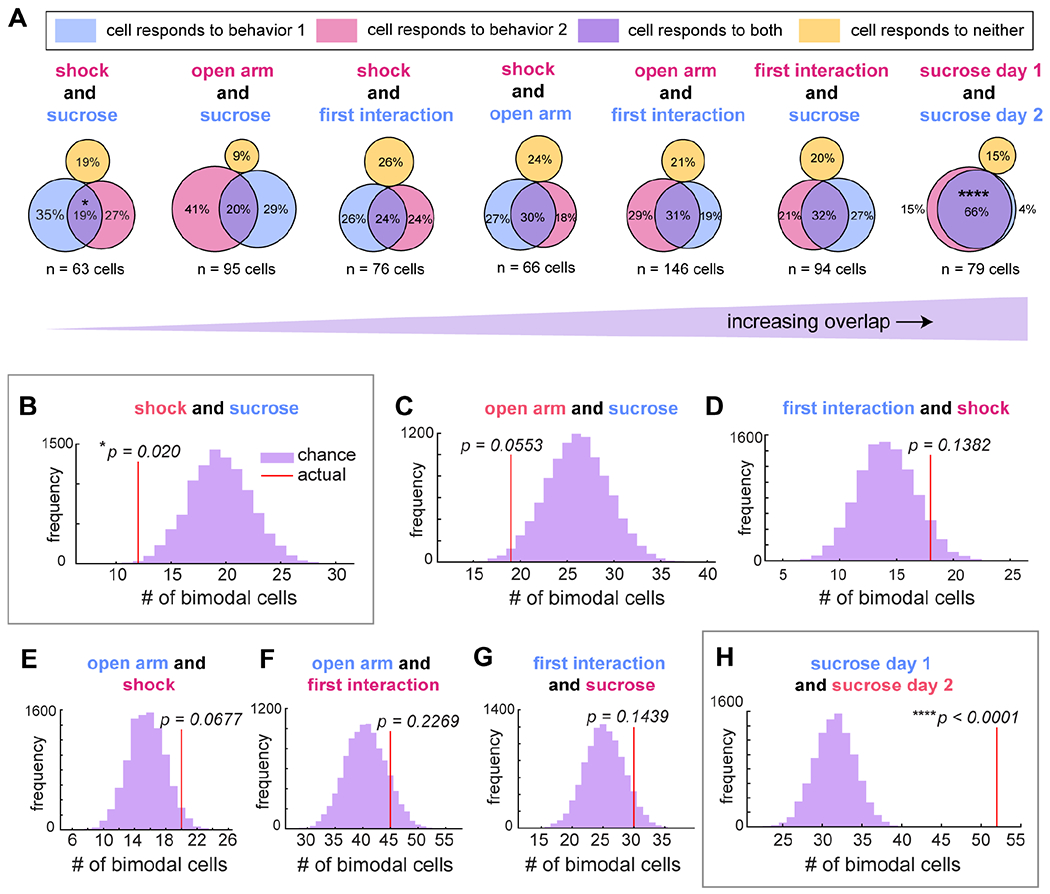
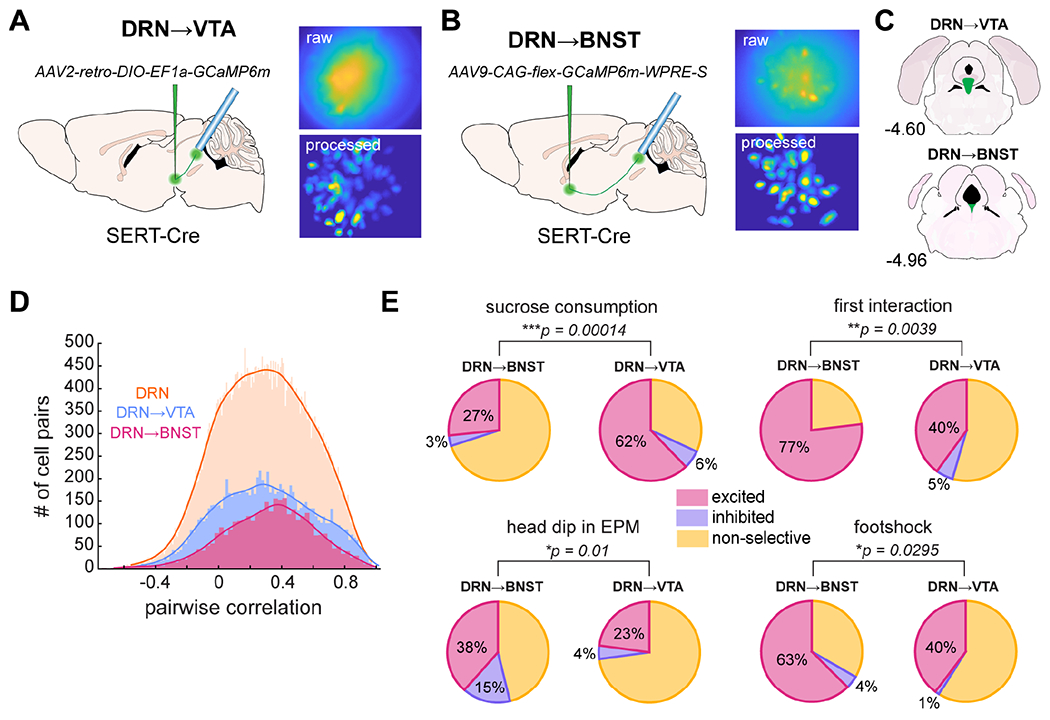
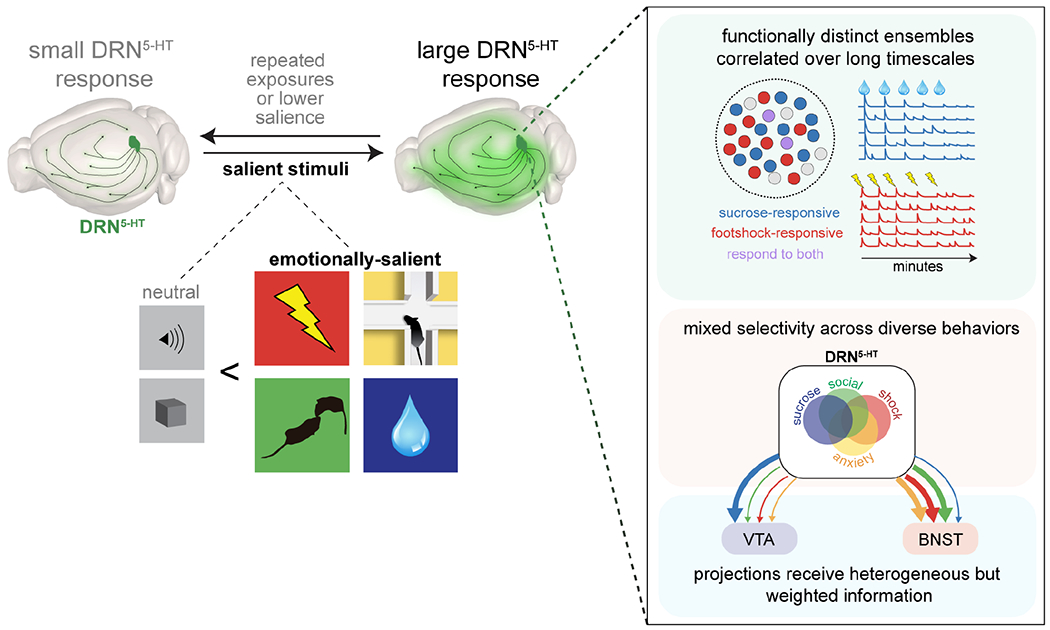
The serotonin system modulates a wide variety of emotional behaviors and states, including reward processing, anxiety, and social interaction. To reveal the underlying patterns of neural activity, we visualized serotonergic neurons in the dorsal raphe nucleus (DRN5-HT) of mice using miniaturized microscopy during diverse emotional behaviors. We discovered ensembles of cells with highly correlated activity and found that DRN5-HT neurons are preferentially recruited by emotionally salient stimuli as opposed to neutral stimuli. Individual DRN5-HT neurons responded to diverse combinations of salient stimuli, with some preference for valence and sensory modality. Anatomically defined subpopulations projecting to either a reward-related structure (the ventral tegmental area) or an anxiety-related structure (the bed nucleus of the stria terminalis) contained all response types but were enriched in reward- and anxiety-responsive cells, respectively. Our results suggest that the DRN serotonin system responds to emotional salience using ensembles with mixed selectivity and biases in downstream connectivity.

Keywords: BNST; DRN; VTA; bed nucleus of the stria terminalis; calcium imaging; dorsal raphe nucleus; microendoscopy; salience; serotonin; ventral tegmental area.


Conflict of interest statement

Declaration of interests The authors declare no competing interests.

Figures

Figure 1.
Figure 1.. DRN5-HT neurons are recruited in correlated ensembles during sucrose consumption.
A) Summary of experimental setup: GCaMP6m is expressed in vivo in DRN5-HT neurons and imaged using an angled gradient refractive index (GRIN) lens and miniaturized microscope. Rendering adapted from the Allen Mouse Brain Atlas (Lein et al., 2007; Bakker et al., 2015). See also Fig. S1, Table S1, and Table S2. B) Confocal image of the DRN, showing GCaMP6m-expressing DRN5-HT neurons and the bottom edge of the tract remaining after removal of the GRIN lens. Scale bar = 200 μm. C) (top) Single frame from a representative imaging session. (bottom) Standard deviation projection of identified neurons from the same movie as above after background-subtraction with CNMF-E. D) Example denoised activity traces from cells in (C). Units are standard deviation from each cell’s baseline fluorescence. See also Supplemental Video 1. E) Distribution of pairwise Pearson’s correlation coefficients of DRN5-HT neuronal activity (n = 48,126 cell pairs) versus chance (n = 1,128 cell pairs x 1,000 simulations). K-S test, D statistic = 0.5543, p <<< 0.0001. See also Fig. S2. F) Behavioral setup for sucrose consumption. A lick-triggered spout freely dispenses 30 μL drops of 5% sucrose water. G) Average percent change in fluorescence of the entire field of view relative to drinking bout onset for a representative animal. Red line segments denote timepoints significantly different than baseline (permutation test, α < 0.05), gray shading represents ±SEM, and data is normalized to have a baseline of 0. H) Responses of individual neurons to sucrose consumption. Shown are examples of raw activity traces. Tick-marks represent licks and red arrows indicate the onsets of separate drinking bouts. I) Relative proportions of excited (183 cells, 59%), inhibited (21 cells, 7%), and non-selective cells (106 cells, 34%) found across all animals (n = 310 cells in 10 animals, shuffle test to determine significance, α = 0.05). J) Of excited cells, the majority (63%, pie chart inset, linear regression, α = 0.05) displayed decreasing responses with cumulative licks. The scatter plot depicts this comparison in a representative cell with significant adaptation (linear regression, p = 1.7588 x 10⁻⁹, adjusted R2 = 0.7091). Shading represents the 95% confidence interval. See also Fig. S3. K) The three largest ensembles from a representative animal. Averaged activity of ensemble 1 is excited by sucrose (p < 0.0001) and non-adapting (p = 0.0845), as determined in (I), ensemble 2 is excited (p < 0.0001) and adapting (p = 0.0068), and ensemble 3 is non-selective (p = 0.2041) for sucrose. Licks are plotted as tick marks below ensemble 3. Traces span the complete 23-minute imaging session. L) For cells in the same ensemble, the average cluster score (the number of times a pair of cells clustered together over 100 iterations of k-means++) during time windows containing measured behaviors is not significantly different than those calculated during time windows that did not contain measured behaviors (n = 212 ensembles across the entire dataset (Fig. 1, 3–5), p = 0.5705, paired t-test). (M) Spatial distribution of cells in (K).
Figure 2.
Figure 2.. Responses of DRN5-HT neurons to gustatory stimuli of varying valence.
A) Behavioral setup showing five spouts randomly delivering five different solutions one-at-a-time to a mouse through a slot in the wall using a rotating wheel. B) Licking behavior of mice (n = 7) for each solution relative to water. One-way ANOVA, p < 0.0001; one-sample t-test comparing each solution to a theoretical mean of 1: 0.5% sucrose, p > 0.05, 2.5% sucrose, p < 0.05, 5% sucrose, p < 0.005, quinine, p < 0.05. Data are shown as mean ±SEM. C) Representative average responses of a single cell to each solution. Shading represents ±SEM. D) Data subset of 59 cells that are significantly excited (shuffle test, ± = 0.05) by at least one solution, from n = 5 mice. Repeated-measures one-way ANOVA, p < 0.0001. Paired t-tests: quinine vs. water, p = 0.0004; 0.5% sucrose vs. water, p = 0.0057; quinine vs. 5% sucrose, p = 0.0006; quinine vs. 0.5% sucrose, p > 0.05; quinine vs. 2.5% sucrose, p > 0.05. Data are shown as mean ±SEM. E) Overlap in populations significantly excited by 5% sucrose or quinine. F) Overlap is significantly greater than chance (shuffle test, p = 4.6 x 10⁻¹³).
Figure 3.
Figure 3.. DRN5-HT ensembles adapt to repeated footshocks.
A) Experimental setup showing a mouse with attached miniscope in a small, enclosed arena, standing on metal bars wired to deliver shocks. B) Population-level response to first, second, and third shocks in the series of ten, averaged across animals (n = 8). Shading represents ±SEM. C) Example single-cell response as in Fig. 1G. D) 45% of cells were excited as in (C), 2% were inhibited, and 52% were non-selective (n = 185 cells in 8 animals, shuffle test, α = 0.05). E) Inverse correlation between response size and shock number in a representative cell. The purple line is a best-fit from linear regression (p = 0.0003, adjusted R2 = 0.826). Shading represents 95% confidence interval. Of excited cells, 46% display this trend (pie chart inset, n = 84 cells in 8 mice, α = 0.05). F) Four ensembles from a representative animal. Ensemble 1 is excited by footshock (p < 0.0001) and does not significantly adapt to repeated shocks (p = 0.33); ensemble 2 is excited (p < 0.0001) but does adapt (p = 0.0241); and ensembles 3 and 4 are non-selective for footshock (p = 0.226). Vertical gray lines represent individual shocks. G) Spatial distribution of ensembles shown in (F). Other detected cells are in gray. See also Fig. S5N–O.
Figure 4.
Figure 4.. DRN5-HT ensembles are excited during exploration under potential threat.
A) Diagram of an elevated plus maze showing a mouse engaged in peeking behavior. B) Fraction of the total session time spent in open arms/center versus closed arms. The red dotted line indicates no preference for either zone, and error bars represent ±SEM. N = 13 mice. One-sample t-test comparing open arm and center time to a theoretical mean of 50%, p < 0.0001. C) Comparison of population-level activity between open arms/center and closed arms. Error bars represent ±SEM. p = 0.0054, two-tailed paired t-test, n = 13 mice. D) Comparison of activity in open arms/center and closed arms for individual cells. Cells with a significant preference are color-coded (shuffle test, α < 0.05). The dotted line represents no difference in activity between zones. n = 304 cells in 12 mice. E) Calcium activity from an example cell indicating relevant behavioral events: head dips (orange) and peeking (purple). Epochs during which the mouse occupied the open arms or center are shaded pink. F) Relative proportion of open arm-excited cells across all animals (47%, n = 304 cells in 12 mice, shuffle test, α < 0.05), and the fraction of open arm-excited cells (n = 143) that are also excited by head dip (64%) and peeking (69%), and inhibited by closed arm re-entry (56%). G) Relationship between an animal’s proportion of open arm-excited cells and time spent in the open arms and center. The purple line is a best-fit by linear regression (p = 0.0058, R2 = 0.387, n = 18 mice). Shading represents 95% confidence interval. H) The two largest ensembles from a representative animal. Ensemble 1 is significantly excited in the open arms and center (p = 0.007), while ensemble 2 is non-selective for arm type (p =0.922). Occupancy of the open arms and center is indicated in pink, head dips in purple, and peeking in blue. I) Spatial distribution of ensembles in (H).
Figure 5.
Figure 5.. DRN5-HT ensembles are specifically excited by the first interaction with a novel mouse.
A) Diagram of the social interaction paradigm. B) Fraction of time mice spend interacting. n = 13 mice (minutes 5 and 6, n = 12 and 11, respectively). Mixed-effects analysis, p = 0.0035. Paired t-test between 1 and 2 minutes, p < 0.0001. C) Population-level response of a representative animal to the first interaction (black) compared all other interactions (purple). Shading represents ±SEM. D) Example single cell response to first interaction. E) Relative proportion of cells with a significant response to the first interaction (53% excited, 215/404 cells, shuffle test, α = 0.05, n = 13 mice). F) Example ensembles. Ensemble 1 is excited by first interaction (p = 0.0008), while ensemble 2 is non-selective (p = 0.8548). Purple shading represents epochs in which mice are in close physical contact. G) Spatial distribution of cells in (F).
Figure 6.
Figure 6.. Mixed selectivity of individual DRN5-HT neurons across behavioral tasks.
A) Relative proportions of cells tracked across each pair of behaviors that respond only to one (pink or blue) or to both (purple). Responsiveness was determined as in Fig. 1–5 (shuffle test, α < 0.05). Between sucrose consumption and footshock, overlap was 19% (n = 63 cells, 6 animals); open arm exploration and sucrose consumption, 20% (n = 95 cells in 8 mice); first social interaction and footshock, 24% (n = 76 cells in 6 mice); open arm exploration and footshock, 30% (n = 66 cells in 6 mice); open arm exploration and first interaction, 31% (n = 146 cells in 10 mice); first interaction and sucrose consumption, 32% (n = 94 cells in 8 mice); and two days of sucrose consumption, 66% (n = 79 cells in 6 mice). B-H) Histograms indicating the likelihood of any number of cells, compared to the actual number observed (red line), responding to both sucrose consumption and footshock ((B), shuffle test, p = 0.020), open arm exploration and sucrose consumption ((C), p = 0.0553), first interaction and footshock ((D), p = 0.1382), open arm exploration and footshock ((E), p = 0.0677), open arm exploration and first interaction ((F), p = 0.2269), first interaction and sucrose consumption ((G), p = 0.1439), and sucrose consumption on two separate days ((H), p < 0.0001). P-values in (B), (C), (D), and (H) have been corrected for 4 comparisons between sucrose consumption and other behaviors using the Bonferroni method. Significantly separate or overlapping populations are highlighted in gray boxes.
Figure 7.
Figure 7.. BNST- and VTA-projecting DRN5-HT neurons respond to diverse behaviors in complementary proportions.
A-B) Experimental setup to target VTA- (A) or BNST-projectors (B) showing the viral injection of retrograde Cre-dependent GCaMP6m and lens placement in the DRN. A sample field of view is shown on the upper right, and a standard deviation projection of the same field after CNMF-E background subtraction on the lower right. C) Location of VTA- (upper) and BNST- (lower) projectors in the DRN with respect to the anteroposterior axis. Figures in (A-C) were adapted from the Allen Mouse Brain Atlas (Lein et al., 2007; Bakker et al., 2015). See also Fig. S9A–F. D) Comparisons of pairwise Pearson’s correlations of cells’ activity in each of the three populations described in this paper: DRN5-HT as a whole (n = 48, 126 cell pairs, same data as Fig. 1E), DRN5-HT➔VTA (n = 9,918 cell pairs), and DRN5-HT➔BNST (n = 3,506 cell pairs). K-S test to compare subpopulations to the whole (DRN5-HT➔VTA, D-stat = 0.0319, DRN5-HT➔BNST, D-stat = 0.0702). E) Summary of cell selectivity across behaviors and subpopulations. Asterisks denote the results from a χ2 test of proportions between each pair of datasets. Percentages of excited and inhibited cells are indicated on the figure. VTA, n = 5 mice, BNST, n = 2 mice. Sucrose consumption: p = 0.00014 (BNST, n = 30 cells, VTA, n = 119 cells); first interaction: p = 0.0039 (BNST, n = 26 cells, VTA, n = 110 cells); head dip, p = 0.01 (BNST, n = 26 cells, VTA, n = 70 cells); footshock, p = 0.0295 (BNST, n = 24 cells, VTA, n = 73 cells).
Figure 8.
Figure 8.. Proposed model of DRN5-HT network at the population- and single-cell level.
A large fraction of serotonergic neurons in the dorsal raphe nucleus is modulated by emotional salience. More cells respond to emotionally salient stimuli than to neutral stimuli, and activity scales with relative salience. At the network level, discrete ensembles are highly correlated over long timescales. Single cells respond to diverse combinations of individual stimuli with some constraints by valence and sensory modality. Projection-specific subpopulations contain the full complement of response types but in weighted proportions. Arrows represent the populations of cells responding to sucrose (blue), first social interaction (green), exploratory behavior in the elevated plus maze (yellow), and footshock (red).

Comment in

References

    1. Abrams JK, Johnson PL, Hollis JH, and Lowry CA (2006). Anatomic and functional topography of the dorsal raphe nucleus. Ann N Y Acad Sci 1018: 46–57. - PubMed
    1. Bakker R, Tiesinga P, and Kötter R (2015). The scalable brain atlas: instant web-based access to public brain atlases and related content. Neuroinformatics 13(3): 353–366. - PMC - PubMed
    1. Balázsfi D, Zelena D, Demeter K, Miskolczi C, Varga ZK, Nagyváradi Á, Nyíri G, Cserép C, Baranyi M, Sperlágh B, and Haller J (2018). Differential roles of the two raphe nuclei in amiable social behavior and aggression – an optogenetic study. Front Behav Neurosci 12: 163. - PMC - PubMed
    1. Barbera G, Liang B, Zhang L, Gerfen CR, Culurciello E, Chen R, Li Y, and Lin D-T. (2016). Spatially compact neural clusters in the dorsal striatum encode locomotion relevant information. Neuron 92(1): 202–213. - PMC - PubMed
    1. Calizo LH, Ma X, Pan Y, Lemos J, Craige C, Heemstra L, and Beck SG (2011). Raphe serotonin neurons are not homogenous: electrophysiological, morphological and neurochemical evidence. Neuropharmacology 61(3): 524–43. - PMC - PubMed

Publication types

LinkOut - more resources