. 2022 Jul 12;55(7):1173-1184.e7.
doi: 10.1016/j.immuni.2022.05.010. Epub 2022 Jun 13.

Genetic tracing reveals transcription factor Foxp3-dependent and Foxp3-independent functionality of peripherally induced Treg cells

Affiliations

Genetic tracing reveals transcription factor Foxp3-dependent and Foxp3-independent functionality of peripherally induced Treg cells

Joris van der Veeken et al. Immunity. .

Abstract

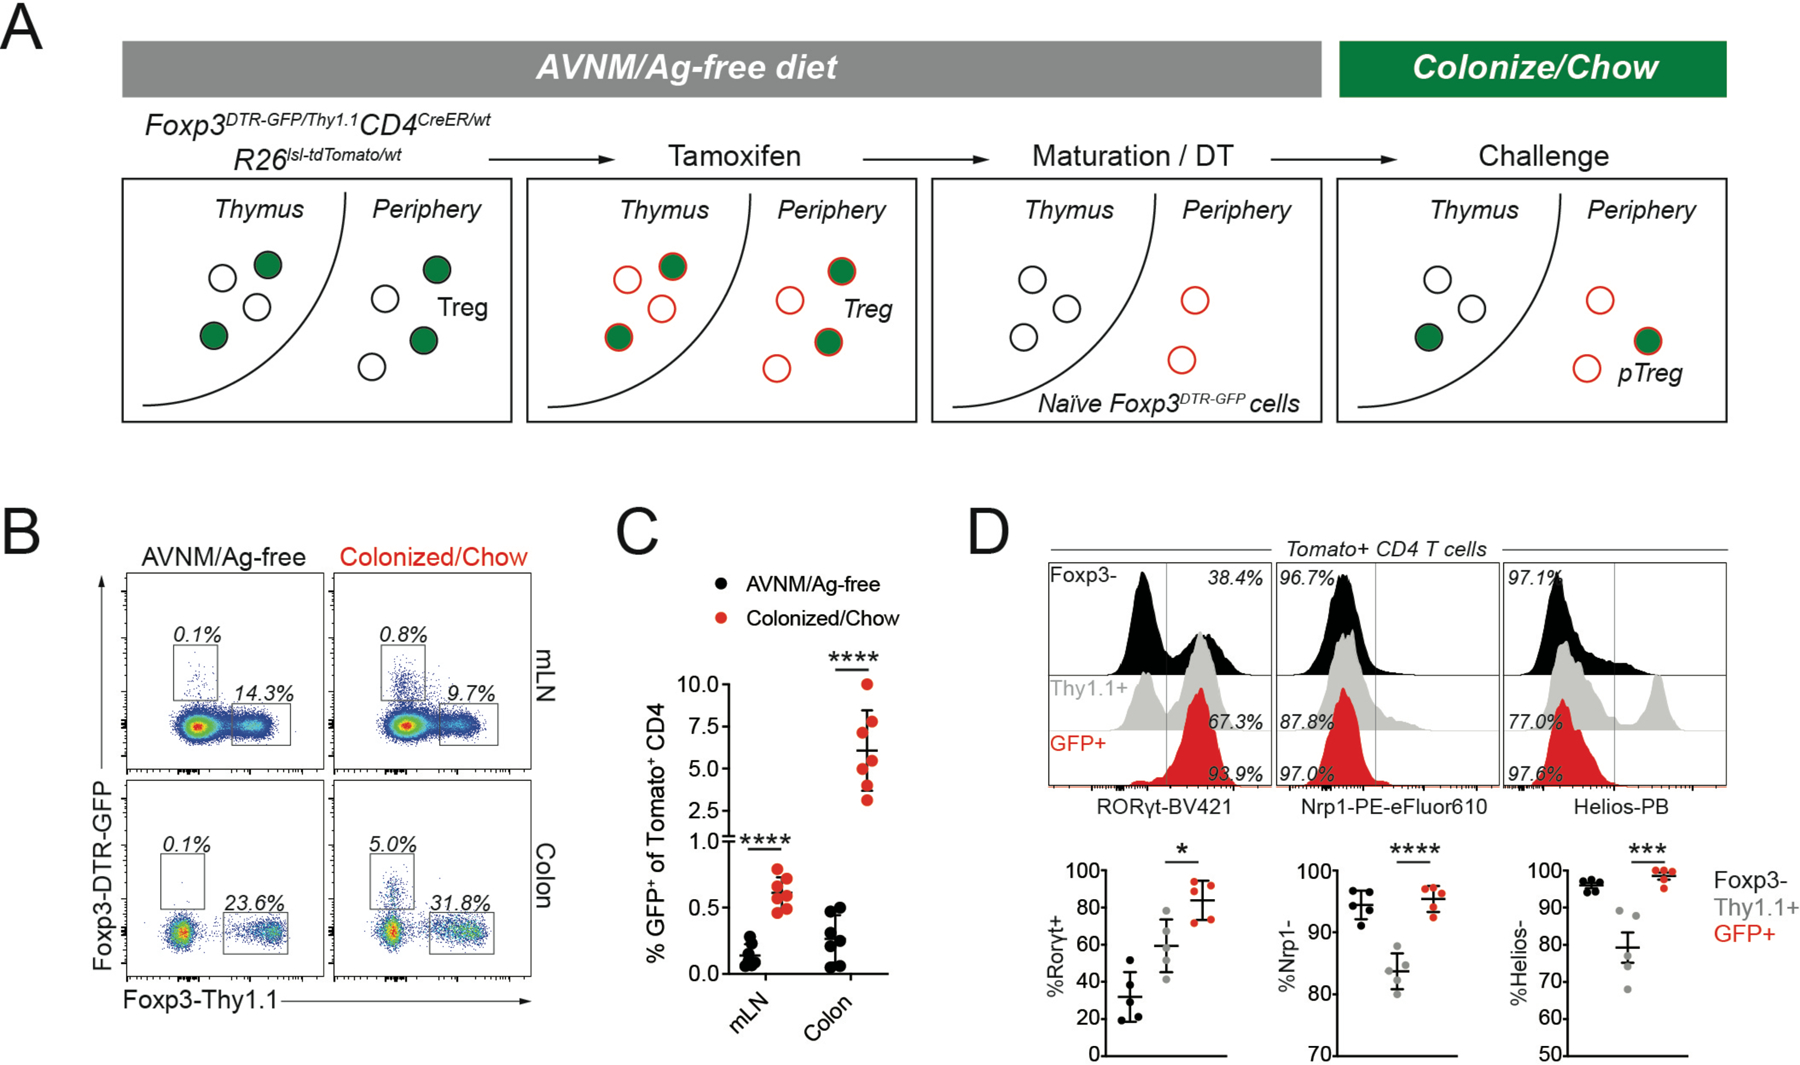
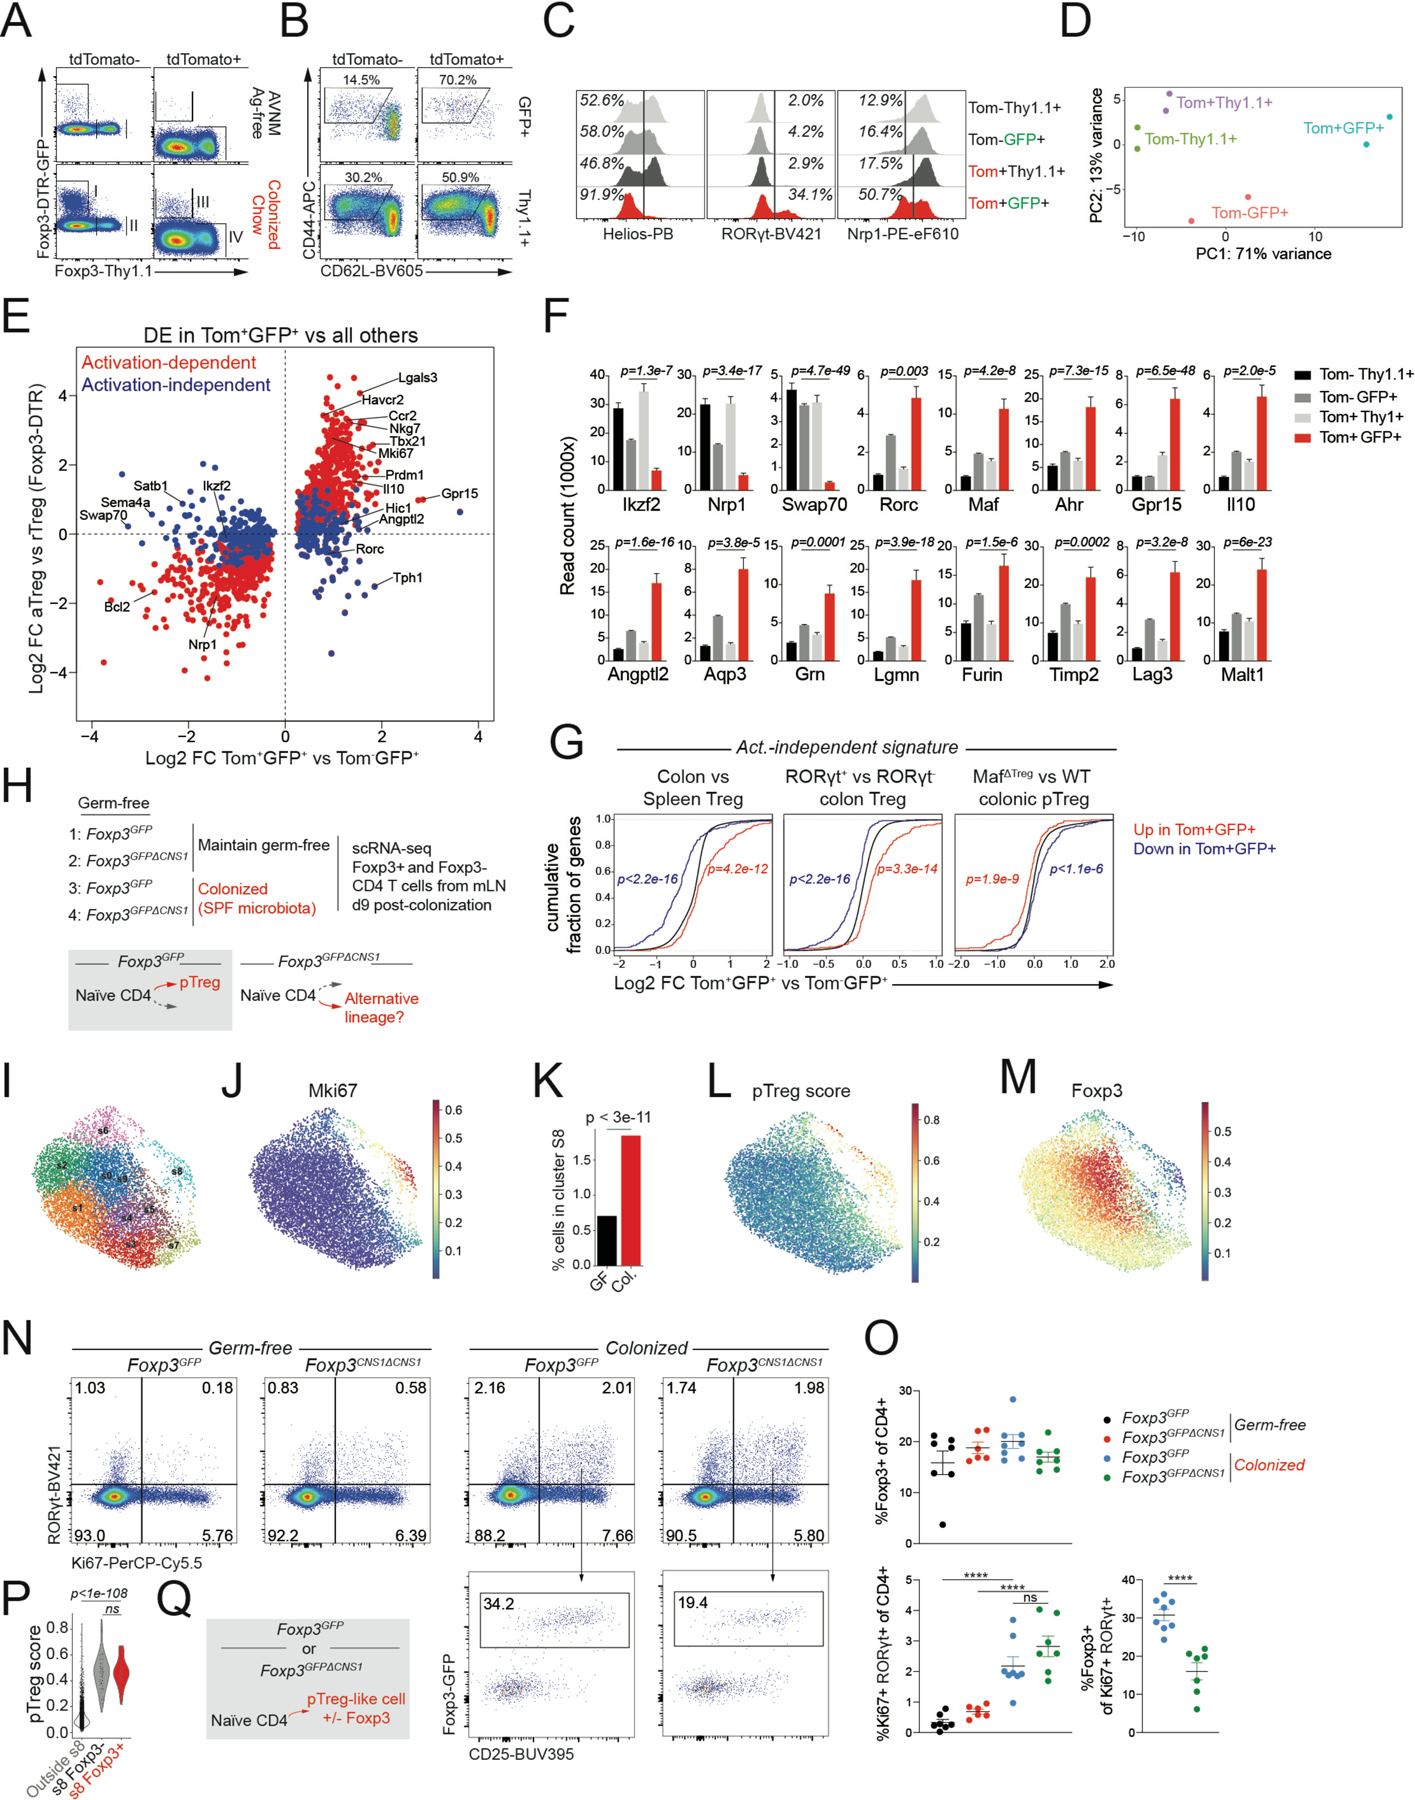
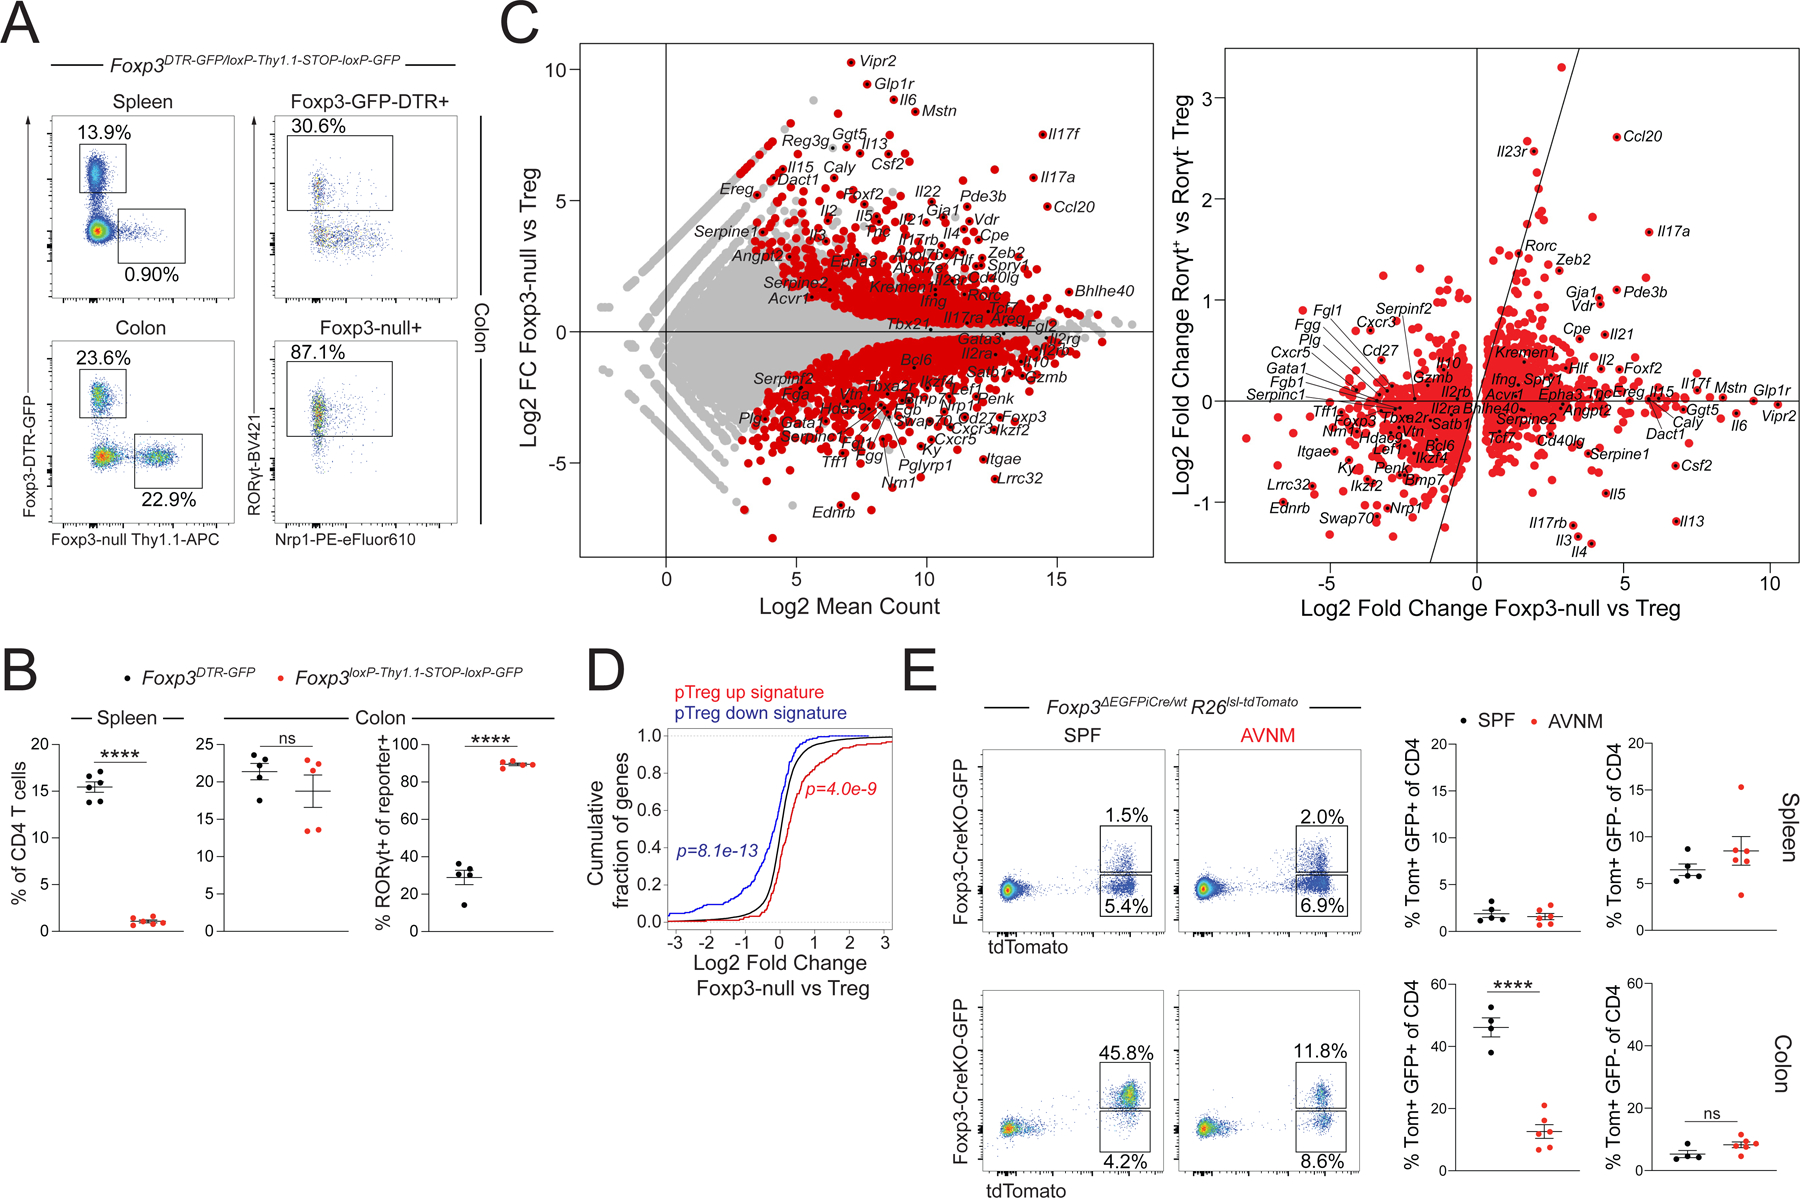
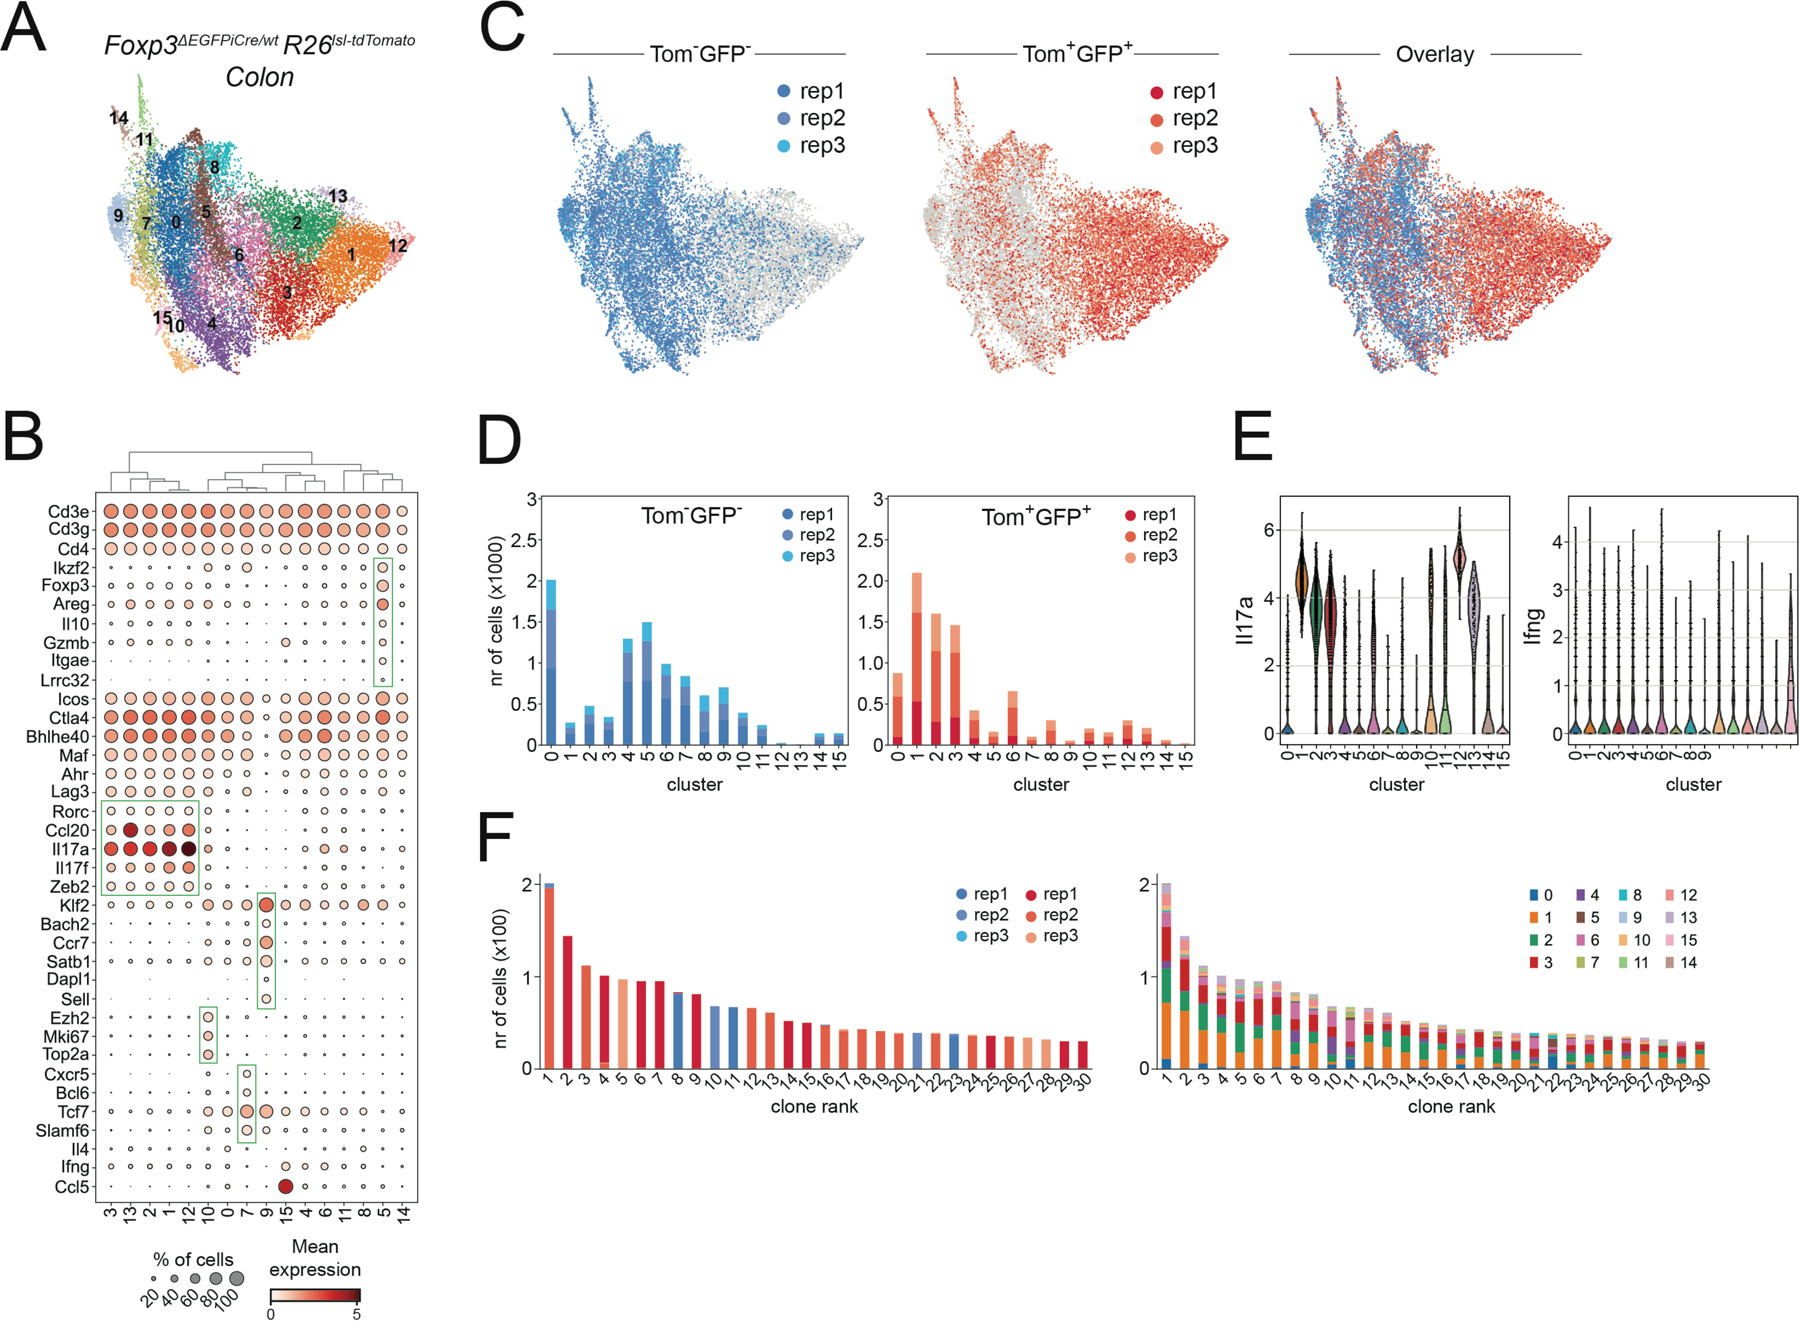
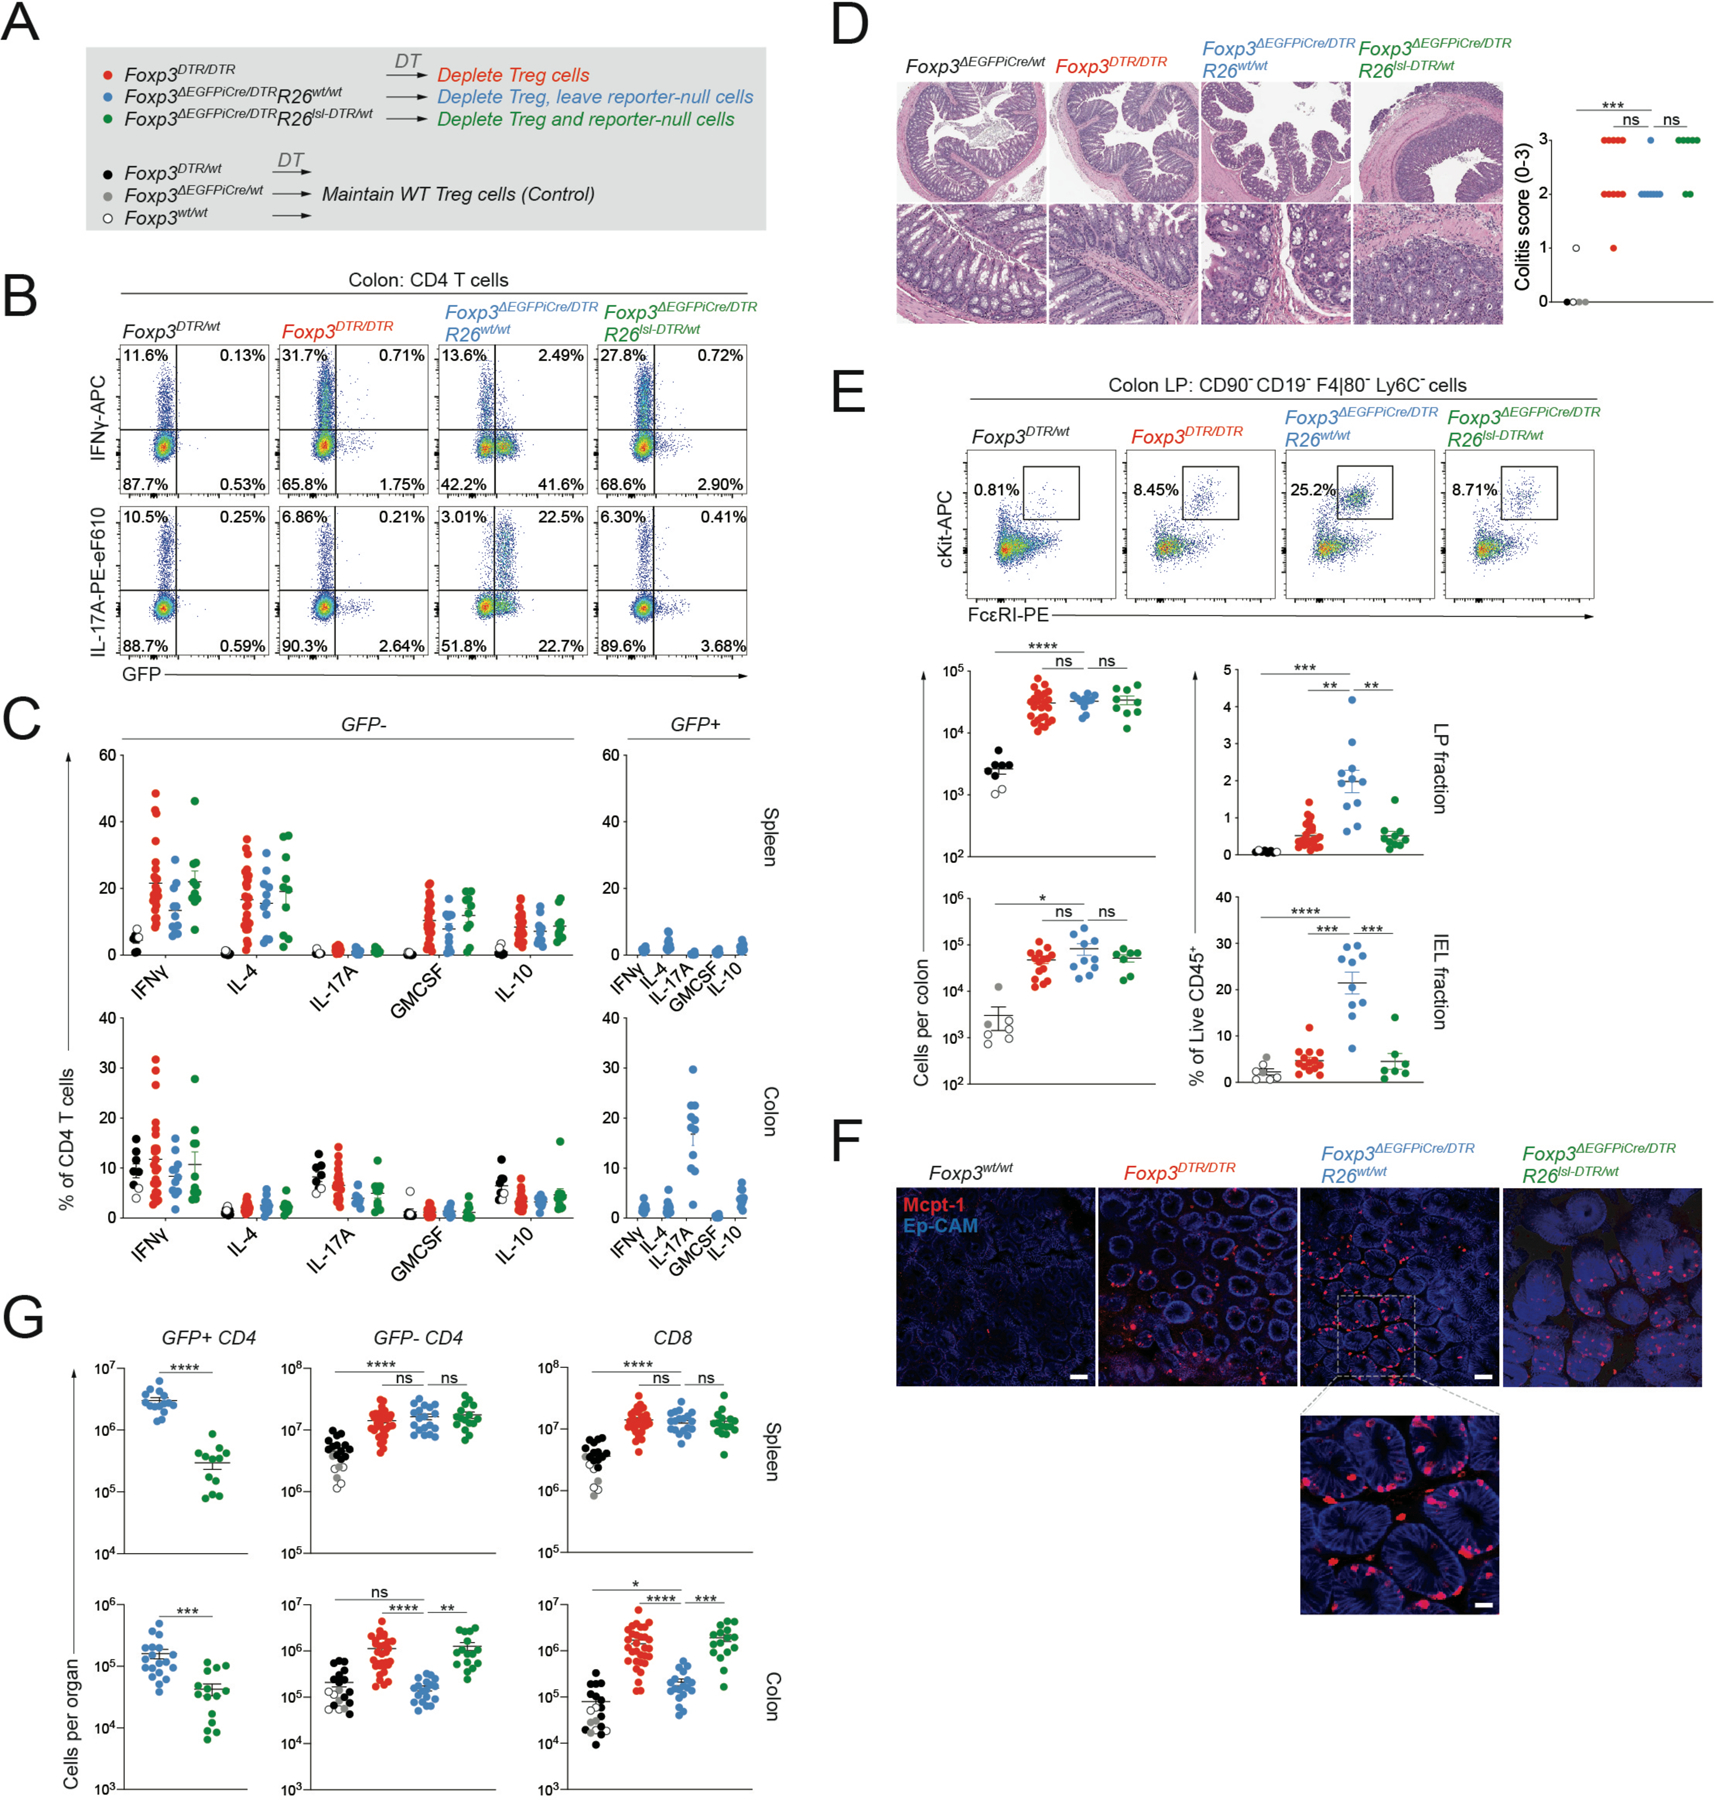
Regulatory T (Treg) cells expressing the transcription factor Foxp3 are an essential suppressive T cell lineage of dual origin: Foxp3 induction in thymocytes and mature CD4+ T cells gives rise to thymic (tTreg) and peripheral (pTreg) Treg cells, respectively. While tTreg cells suppress autoimmunity, pTreg cells enforce tolerance to food and commensal microbiota. However, the role of Foxp3 in pTreg cells and the mechanisms supporting their differentiation remain poorly understood. Here, we used genetic tracing to identify microbiota-induced pTreg cells and found that many of their distinguishing features were Foxp3 independent. Lineage-committed, microbiota-dependent pTreg-like cells persisted in the colon in the absence of Foxp3. While Foxp3 was critical for the suppression of a Th17 cell program, colitis, and mastocytosis, pTreg cells suppressed colonic effector T cell expansion in a Foxp3-independent manner. Thus, Foxp3 and the tolerogenic signals that precede and promote its expression independently confer distinct facets of pTreg functionality.

Keywords: Foxp3; Treg; lineage tracing; microbiota; peripherally induced Treg.


Conflict of interest statement

Declaration of interests A.Y.R. is an SAB member and holds equity in Surface Oncology, Vedanta Biosciences, Sonoma Biotherapeutics, and RAPT Therapeutics; is an SAB member of BioInvent; and holds IP licensed to Takeda, which is unrelated to the current study.

Figures

Figure 1:
Figure 1:. Genetic labeling enables identification of extrathymically generated Treg cells.
A) female Foxp3DTR-GFP/Thy1.1CD4CreER/wtR26lsl-tdTomato/wt mice were bred and weaned on antibiotic-containing drinking water (AVNM) and an amino acid-based diet (Ag-free diet). To label CD4 T cells, mice were treated with tamoxifen by oral gavage. tdTomato+ thymocytes were allowed to mature for at least two weeks post-tamoxifen treatment, while depleting DTR-GFP expressing Treg cells using diphtheria toxin (DT) administration. The resulting animals contained tdTomato+ naïve CD4 T cells carrying an unexpressed Foxp3DTR-GFP allele, activation of which can be measured in response to microbial colonization and a dietary switch. B-C) Flow cytometry of tdTomato+ cells in the mesenteric lymph nodes (mLN) and colonic lamina propria (LP) of fate-mapped mice two weeks after microbial colonization and dietary switch or maintenance on AVNM and ag-free food. Pooled data from two independent experiments (n=7 mice per group). P-values from multiple t-tests: mLN (p=3.91e-6), LP (p=6.34e-4). D) Expression of Rorγt, Nrp1, and Helios in sorted tdTomato+ cells from LP. Pooled data from two independent experiments (n=5 mice per group).*:p<0.05; ***:p<0.001;****:p<0.0001, by one-way ANOVA. See also Figure S1.
Figure 2:
Figure 2:. A pTreg transcriptional program is induced independently of Foxp3.
A) female Foxp3DTR-GFP/Thy1.1CD4CreER/wtR26lsl-tdTomato/wt mice were bred and weaned on antibiotic-containing drinking water and Ag-free diet. After labeling of extrathymic CD4 T cells, mice were switched to chow diet and colonized with SPF fecal microbiota. 12 days post-colonization indicated populations were isolated by flow cytometry for RNA-seq. B-C) Expression of activation markers and putative pTreg markers on isolated populations. D) PCA plot of RNA-seq samples. E) RNA-seq showing genes differentially expressed (DE) between GFP+Tom+ and all other sorted Treg populations. Activation-dependent and -independent gene expression changes were defined using a comparison to genes DE in activated Treg (aTreg) cells isolated from secondary lymphoid tissues of male Foxp3DTR-GFP/y mice 11 days following transient DT-induced Treg cell depletion vs resting Treg (rTreg) cells from untreated controls. F) Expression of select genes. P-values from DEseq2, comparing Tom+GFP+ to TomGFP+ G) Expression changes in activation-independent pTreg signature genes in published datasets. P-values from one-sided Kolmogorov-Smirnov test comparing red and blue distributions to the background distribution in black H) Experimental design. Germ-free (GF) male Foxp3GFP and Foxp3GFPΔCNS1 mice were colonized with SPF fecal microbiota or kept GF. A 50%−50% mix of GFP+ and GFP CD4 T cells sorted from pooled mLN of 3 mice per group was used as input for scRNA-seq. I) UMAP of scRNA-seq data showing PhenoGraph clusters. Activated T cells and Treg cells are included in the plot (see Figure S4). J) Imputed Mki67 expression. K) Percentage of cells from GF or colonized (Col.) samples belonging to cluster s8 (hypergeometric test). L) Expression of the pTreg gene expression signature derived from fate-mapping experiment. M) Imputed Foxp3 expression. N-O) Flow cytometry of mLN CD4 T cells. Pooled data from 2 independent experiments with 6–8 mice per group total (****:p<0.0001, by one-way ANOVA or unpaired t test). P) pTreg gene expression signature in the indicated cell subsets. P-value from Mann-Whitney U test Q) Transcriptionally similar pTreg-like cells arise in response to microbial colonization in the presence or absence of Foxp3. See also Figures S2 and S3.
Figure 3:
Figure 3:. Foxp3 is dispensable for lineage commitment of microbiota-dependent pTreg cells.
A-B) Flow cytometry of CD4 T cells from spleen and colonic lamina propria (LP) of female Foxp3DTR-GFP/loxp-Thy1.1-STOP-loxp-GFP mice. Showing one of two independent experiments with 5–6 mice per group each. P-values from paired t-test (****:p<0.0001). C) RNA-seq of DTR-GFP+ wild-type Treg cells and Thy1.1+ reporter-null cells from the LP of female Foxp3DTR-GFP/loxp-Thy1.1-STOP-loxp-GFP mice (left). Comparison with published dataset of colonic RORγt+ vs RORγt colonic Treg cells (right). D) Differential expression of the pTreg transcriptional signature by LP Treg cells and Foxp3 reporter-null cells. P-values from one-sided Kolmogorov-Smirnov test comparing red and blue distributions to the background distribution in black. E) Flow cytometry of splenic (top) and LP (bottom) CD4 T cells from female Foxp3ΔEGFPiCre/wtR26lsl-tdTomato mice maintained on antibiotic-containing or regular drinking water (SPF) for one month. Pooled data from two independent experiments with n=4 or n=6 mice per group. P-value from unpaired t-test (***:p<0.0001).
Figure 4:
Figure 4:. Treg-committed Th17 cells differentiate in the absence of Foxp3.
A) UMAP of scRNA-seq data showing PhenoGraph clusters of tdTomato+GFP+ reporter-null cells and tdTomatoGFP bulk CD4 T cells isolated from the colonic lamina propria of three female Foxp3ΔEGFPiCre/wtR26lsl-tdTomato/wt mice. B) Expression of select marker genes by cells occupying distinct PhenoGraph clusters. C-D) UMAP and PhenoGraph cluster composition of scRNA-seq data for individual replicates of tdTomato+GFP+ reporter-null cells and tdTomatoGFP bulk CD4 T cells. E) Il17a and Ifng expression by cells from distinct PhenoGraph clusters. F) Sample origin (left) and PhenoGraph cluster composition (right) of cells from the 30 largest TCR clonotypes. See also Figure S4.
Figure 5:
Figure 5:. Colonic Treg cells have Foxp3-dependent and -independent suppressive functions.
A) Experimental design. Female mice of indicated genotypes were treated with DT (1μg via intraperitoneal injection on d0, d1, and d7) and analyzed two weeks after the start of treatment. B-C) Intracellular cytokine staining following 3-hour ex vivo re-stimulation. Pooled data from 4 experiments with n=8 to 25 mice per group. D: H&E staining of colonic sections from indicated genotypes and colitis scores (0–3). Pooled data from two independent experiments with n=5 to 11 mice per group. E: flow cytometry of mast cells in the colonic lamina propria (LP) and intraepithelial (IEL) fractions. Pooled data from 4 (LP) or 3 (IEL) independent experiments with n=8 to 25 mice per group (LP) or n=7 to 15 mice per group (IEL). F: Representative whole-mount immunofluorescence (IF) images of the proximal colon of mice of the indicated genotypes stained with anti-Mcpt1 (red) and anti-Ep-Cam (blue). Scale bars, 50μm. Scale bar of inset below, 10μm. G: Total CD4 and CD8 T cell counts in the spleen and colonic LP analyzed by flow cytometry. Pooled data from 8 experiments with n=16 to 31 mice per group. P-values from Brown-Forsythe and Welch ANOVA (*:p<0.05, **p<0.01, ***: p<0.001, ****: p<0.0001). See also Figure S5.

References

    1. Aguilera-Lizarraga J, Florens M, Hussein H, and Boeckxstaens G (2021). Local immune response as novel disease mechanism underlying abdominal pain in patients with irritable bowel syndrome. Acta Clin Belg, 1–8. - PubMed
    1. Apostolou I, and von Boehmer H (2004). In vivo instruction of suppressor commitment in naive T cells. J Exp Med 199, 1401–1408. - PMC - PubMed
    1. Arpaia N, Campbell C, Fan X, Dikiy S, van der Veeken J, deRoos P, Liu H, Cross JR, Pfeffer K, Coffer PJ, and Rudensky AY (2013). Metabolites produced by commensal bacteria promote peripheral regulatory T-cell generation. Nature 504, 451–455. - PMC - PubMed
    1. Arvey A, van der Veeken J, Samstein RM, Feng Y, Stamatoyannopoulos JA, and Rudensky AY (2014). Inflammation-induced repression of chromatin bound by the transcription factor Foxp3 in regulatory T cells. Nat Immunol 15, 580–587. - PMC - PubMed
    1. Azizi E, Carr AJ, Plitas G, Cornish AE, Konopacki C, Prabhakaran S, Nainys J, Wu K, Kiseliovas V, Setty M, et al. (2018). Single-Cell Map of Diverse Immune Phenotypes in the Breast Tumor Microenvironment. Cell 174, 1293–1308.e1236. - PMC - PubMed

Publication types

MeSH terms

Substances