. 2022 Oct;163(4):875-890.
doi: 10.1053/j.gastro.2022.06.021. Epub 2022 Jun 11.

Dysplastic Stem Cell Plasticity Functions as a Driving Force for Neoplastic Transformation of Precancerous Gastric Mucosa

Affiliations

Dysplastic Stem Cell Plasticity Functions as a Driving Force for Neoplastic Transformation of Precancerous Gastric Mucosa

Jimin Min et al. Gastroenterology. 2022 Oct.

Abstract

Background & aims: Dysplasia carries a high risk of cancer development; however, the cellular mechanisms for dysplasia evolution to cancer are obscure. We have previously identified 2 putative dysplastic stem cell (DSC) populations, CD44v6neg/CD133+/CD166+ (double positive [DP]) and CD44v6+/CD133+/CD166+ (triple positive [TP]), which may contribute to cellular heterogeneity of gastric dysplasia. Here, we investigated functional roles and cell plasticity of noncancerous Trop2+/CD133+/CD166+ DSCs initially developed in the transition from precancerous metaplasia to dysplasia in the stomach.

Methods: Dysplastic organoids established from active Kras-induced mouse stomachs were used for transcriptome analysis, in vitro differentiation, and in vivo tumorigenicity assessments of DSCs. Cell heterogeneity and genetic alterations during clonal evolution of DSCs were examined by next-generation sequencing. Tissue microarrays were used to identify DSCs in human dysplasia. We additionally evaluated the effect of casein kinase 1 alpha (CK1α) regulation on the DSC activities using both mouse and human dysplastic organoids.

Results: We identified a high similarity of molecular profiles between DP- and TP-DSCs, but more dynamic activities of DP-DSCs in differentiation and survival for maintaining dysplastic cell lineages through Wnt ligand-independent CK1α/β-catenin signaling. Xenograft studies demonstrated that the DP-DSCs clonally evolve toward multiple types of gastric adenocarcinomas and promote cancer cell heterogeneity by acquiring additional genetic mutations and recruiting the tumor microenvironment. Last, growth and survival of both mouse and human dysplastic organoids were controlled by targeting CK1α.

Conclusions: These findings indicate that the DSCs are de novo gastric cancer-initiating cells responsible for neoplastic transformation and a promising target for intervention in early induction of gastric cancer.

Keywords: CK1α; Dysplasia; Dysplastic Stem Cells; Gastric Carcinogenesis; Kras; Pyrvinium.


Conflict of interest statement

Conflict of interest

The authors declare no competing interests.

Figures

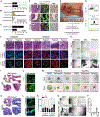
Figure 1.
Figure 1.. RNA-seq data and cellular functions of DP- and TP-DSCs.
(A) Similarity matrix based on top 2,000 genes in DP- or TP-DSCs and the percentages of overlapping genes. (B) KEGG mapping of top 434 of 500 genes commonly observed in both DSCs. (C&D) Gene set enrichment analysis (GSEA) of biological process (C) and KEGG (D) using upregulated genes in DP-DSCs. (E) Phase-contrast images of isolated non-DSCs, DP- and TP-DSCs from Meta4 organoids or Mist1-Kras mouse stomachs in Matrigel at 0, 1 or 4 weeks. (F-G) Quantitation of the number of spheres from isolated non-DSCs, DP- and TP-DSCs from Meta4 organoids (F) or Mist1-Kras mouse stomachs (G). Mean ± SD (n=3 or 4). Paired t-test. *P < .05. (H-I) H&E and AB/PAS (H) and co-immunostaining for Trop2 and CD44v9 or Tff3 and Hoechst (I) in DSC-derived spheres at 4 weeks. Arrows (H) and dotted boxes (I) indicate enlarged area. Arrows in (I) denote CD44v9neg/Trop2+ dysplastic cells or Tff3+ goblet cells.
Figure 2.
Figure 2.. Evolution of DP-DSCs towards heterogeneous types of gastric cancer.
(A&D) Experimental scheme of isolated DSC-injection study created with BioRender.com. (B) Bright-field (BF) images of injection sites at 7 weeks after injection. Dotted areas indicate engraftments. Graph shows engraftment rates. (C) H&E, Masson’s trichrome (MT) or co-immunostaining for Sox9, Trop2, Cttn, CD44v6, CD133, CD166, Cdh17, EpCAM, Pdgfrα, α-SMA, Ki67, Cleaved caspase-3 (CC-3), F4/80, CD163, P120 (epithelial cells) or PECAM in DP-DSC-derived engraftments at 7 weeks after injection. Dotted boxes indicate enlarged area. (E) Tumor volumes in each group for 13 weeks. Paired t-test. *P < .05, **P < .01, ***P < .001. (F) BF and H&E images of tumors from total Meta4 cells or isolated DP-DSCs at 13 weeks after injection. Arrows denote CysAC (black) or TubAC (red) lesions. Graph shows tumor formation rates. (G) H&E or MT staining of CysAC or TubAC tissues from total Meta4 cells or isolated DP-DSCs. Arrows denote desmoplastic response areas. (H) H&E of each histological feature is indicated by arrows. Dotted boxes indicate enlarged area. (I) Co-immunostaining for Trop2, Cdh17, EpCAM, α-SMA, F4/80, PECAM or Ki67 in whole tumor tissues.
Figure 3.
Figure 3.. Cell heterogeneity of DP-DSC-derived tumors.
(A) t-SNE plot overlayed with cells from CysAC or TubAC (top) or cell clustering into 11 subpopulations (bottom). (B-D) t-SNE plot overlayed with expression of representative genes (blue) in each subpopulation, dysplastic/cancer (B), immune (C) or fibroblast (D). (E-J) Co-Immunostaining for Sox9, Trop2, CD133, Cldn7, CD9 or Pdgfrα (E, F & G) or Ly6B2, CD4, CD19, F4/80, CD3 or Vegf (H, I & J) in CysAC or TubAC. Arrows indicate enlarged area and dotted areas denote Sox9- or Cldn7-negative cancer regions in E&F.
Figure 4.
Figure 4.. Genetic alterations acquired during the DP-DSC evolution.
(A) Phase-contrast images or immunostaining for Trop2 in Meta4 organoids, CysAC- or TubAC-derived spheres in Matrigel. (B-D) Phase-contrast images (B), quantitation of the number (C) or diameters (D) of spheres derived from 1,000 or 5,000 cells dissociated from the tumor spheres at day 12. Mean ± SD (n=3). Each dot in D indicates a sphere diameter cumulated from three independent experiments. Unpaired t-test. **P < .01, ***P < .001, ****P < .0001. (E) Oncoplot of coding mutations in CysAC or TubAC. Top row indicates top 100 genes abundantly mutated in human gastric cancer cases (n=165) and the following five rows indicate gene mutations in 5 independent tumors, CysAC (n=2) or TubAC (n=3). (F) Venn-diagram presenting unique or overlapping genes between CysAC and TubAC. Genes affected by at least one mutation were classified into CysAC, TubAC or both. (G) Schematic domain structures of Rnf43, Cdkn2a and Apc with somatic mutations in Meta4 organoids, CysAC or TubAC created with BioRender.com. SP, signaling peptide; TM, transmembrane domain, ARM; armadillo repeat, BD; binding domain.
Figure 5.
Figure 5.. Examination of tumorigenic abilities of DP-DSC-derived tumor cells.
(A) BF images of tumors developed from CysAC or TubAC cells at 3 and 7 weeks after injection. (B-C) Tumor volumes in each group at 3 weeks (B) and 7 weeks (C). Two-way ANOVA. ****P < .0001. (D) Quantitation of the proportion of cystic or tubular histology in the CysAC (n=10)- or TubAC (n=20)-derived tumors. Mean ± SD. (E) H&E or co-immunostaining for PECAM and Trop2 or Vegf and Cdh17 in CysAC- or TubAC-derived tumors. Nuclei were counterstained with Hoechst and dotted boxes indicate enlarged area. (F) Graphical diagram of clonal evolution of DP-DSCs towards CysAC or TubAC created with BioRender.com.
Figure 6.
Figure 6.. Treatment of Salinomycin and Pyrvinium in Meta4 organoids.
(A) Schematic illustration of target molecules of Salinomycin and Pyrvinium in Wnt pathway created with BioRender.com. (B) Phase-contrast images of Meta4 organoids treated with DMSO vehicle, 1 μM of Salinomycin or 100 nM of Pyrvinium for 3 days. (C&D) Quantitation of diameters (C) or the number of surviving organoids (D) before and after the treatment. Mean ± SD (n=4). Each dot in C indicates an organoid diameter cumulated from four independent experiments. Paired t-test. **P < .01, ****P < .0001. (E, F and I) H&E (E), live/dead (Calcein AM/EthD-1) cell staining (F) or co-immunostaining for Trop2, Cttn, Ki67, Pcna, Cleaved caspase-3 (CC-3) or P120 (I) after the treatment. Dotted boxes depict enlarged area. (G-H) Quantitation of the number of live and dead cells (G) or non-DSCs and DSCs among live cells (H) after the drug treatment. Mean ± SD (n=3). Paired t-test. *P < .05. (J) Phase-contrast images of DP-DSCs isolated from Meta4 organoids 7 days after drug treatment and 7 days post drug withdrawal. (K) Quantitation of the number of surviving organoids after drug treatment and withdrawal. Mean ± SD (n=3).
Figure 7.
Figure 7.. Evaluation of DSC activities in human gastric dysplasia.
(A) Quantitation of the number of dysplastic tissue cores (n=76) containing DP-DSCs (CD44v6neg/CD133+) and/or TP-DSCs (CD44v6+/CD133+). (B&C) The percentages of dysplastic tissue cores containing DP- or TP-DSCs in CD44v9+ and/or TROP2+ cell zones (B) or in Ki67+ cell zones (C). (D) Representative images of H&E or multiplexed-immunostaining for TROP2, CD44v6, CD44v9, CD133 and KI67. Dotted boxes indicate enlarged area of a DP- or TP-DSC zone. Arrows indicate a KI67-positive DP-DSC-zone in CD44v9neg/TROP2+ dysplastic glands or a KI67-negative TP-DSC-zone in CD44v9+/TROP2+ transitioning glands. (E) Representative picture of surgical specimens from gastric cancer patients. Box indicates the collected region. (F) H&E (top) or co-immunostaining for TROP2 and CD44v9 in patient tissues with metaplasia or dysplasia (middle) or co-immunostaining for TROP2, CD44v9 and AQP5 in organoids derived from the tissues (bottom). (G) The percentages of TROP2+ cells or TROP2+ DSCs in dysplastic organoids. Mean ± SD (n=3). (H) Phase-contrast images of isolated non-DSCs and DSCs from human dysplastic organoids in Matrigel at 0, 1 or 4 weeks. Dotted boxes indicate enlarged area. (I&K) Images of H&E (I) or AB/PAS (K) staining. Arrows denote enlarged area. (J&L) Co-immunostaining for TROP2, CD44v9 and AQP5 (J) or TFF3 and Hoechst (L) in DSC-derived spheres at 4 weeks. Dotted boxed indicate enlarged area. Arrows denote TROP2+ dysplastic cells (J) or TFF3+ goblet cells (L). (M) Phase-contrast images at day 0 or merged with images captured after live/dead (Calcein AM/EthD-1) cell staining 3 days after the treatment in metaplastic or dysplastic organoids. (N) Quantitation of the number of metaplastic (n=2) or dysplastic (n=5) organoid lines positive for Calcein AM (live) or EthD-1 (dead) after treatment with either Salinomycin or Pyrvinium. Mean ± SD. Paired t-test. *P < .05. (O) Phase-contrast images of isolate DSCs from human dysplastic organoids 7 days after treatment and 7 days post drug withdrawal. (P) Quantitation of the number of surviving organoids after the drug treatment and withdrawal. Mean ± SD (n=3).

References

    1. Smyth EC, Nilsson M, Grabsch HI, et al. Gastric cancer. The Lancet 2020;396:635–648. - PubMed
    1. Bray F, Ferlay J, Soerjomataram I, et al. Global cancer statistics 2018: GLOBOCAN estimates of incidence and mortality worldwide for 36 cancers in 185 countries. CA Cancer J Clin 2018;68:394–424. - PubMed
    1. Correa P A human model of gastric carcinogenesis. Cancer Res 1988;48:3554–60. - PubMed
    1. Tan P, Yeoh KG. Genetics and Molecular Pathogenesis of Gastric Adenocarcinoma. Gastroenterology 2015;149:1153–1162 e3. - PubMed
    1. de Vries AC, van Grieken NC, Looman CW, et al. Gastric cancer risk in patients with premalignant gastric lesions: a nationwide cohort study in the Netherlands. Gastroenterology 2008;134:945–52. - PubMed

Publication types