

Resting-State fMRI-Based Screening of Deschloroclozapine in Rhesus Macaques Predicts Dosage-Dependent Behavioral Effects
- PMID: 35701162
- PMCID: PMC9302458
- DOI: 10.1523/JNEUROSCI.0325-22.2022
Resting-State fMRI-Based Screening of Deschloroclozapine in Rhesus Macaques Predicts Dosage-Dependent Behavioral Effects
Abstract
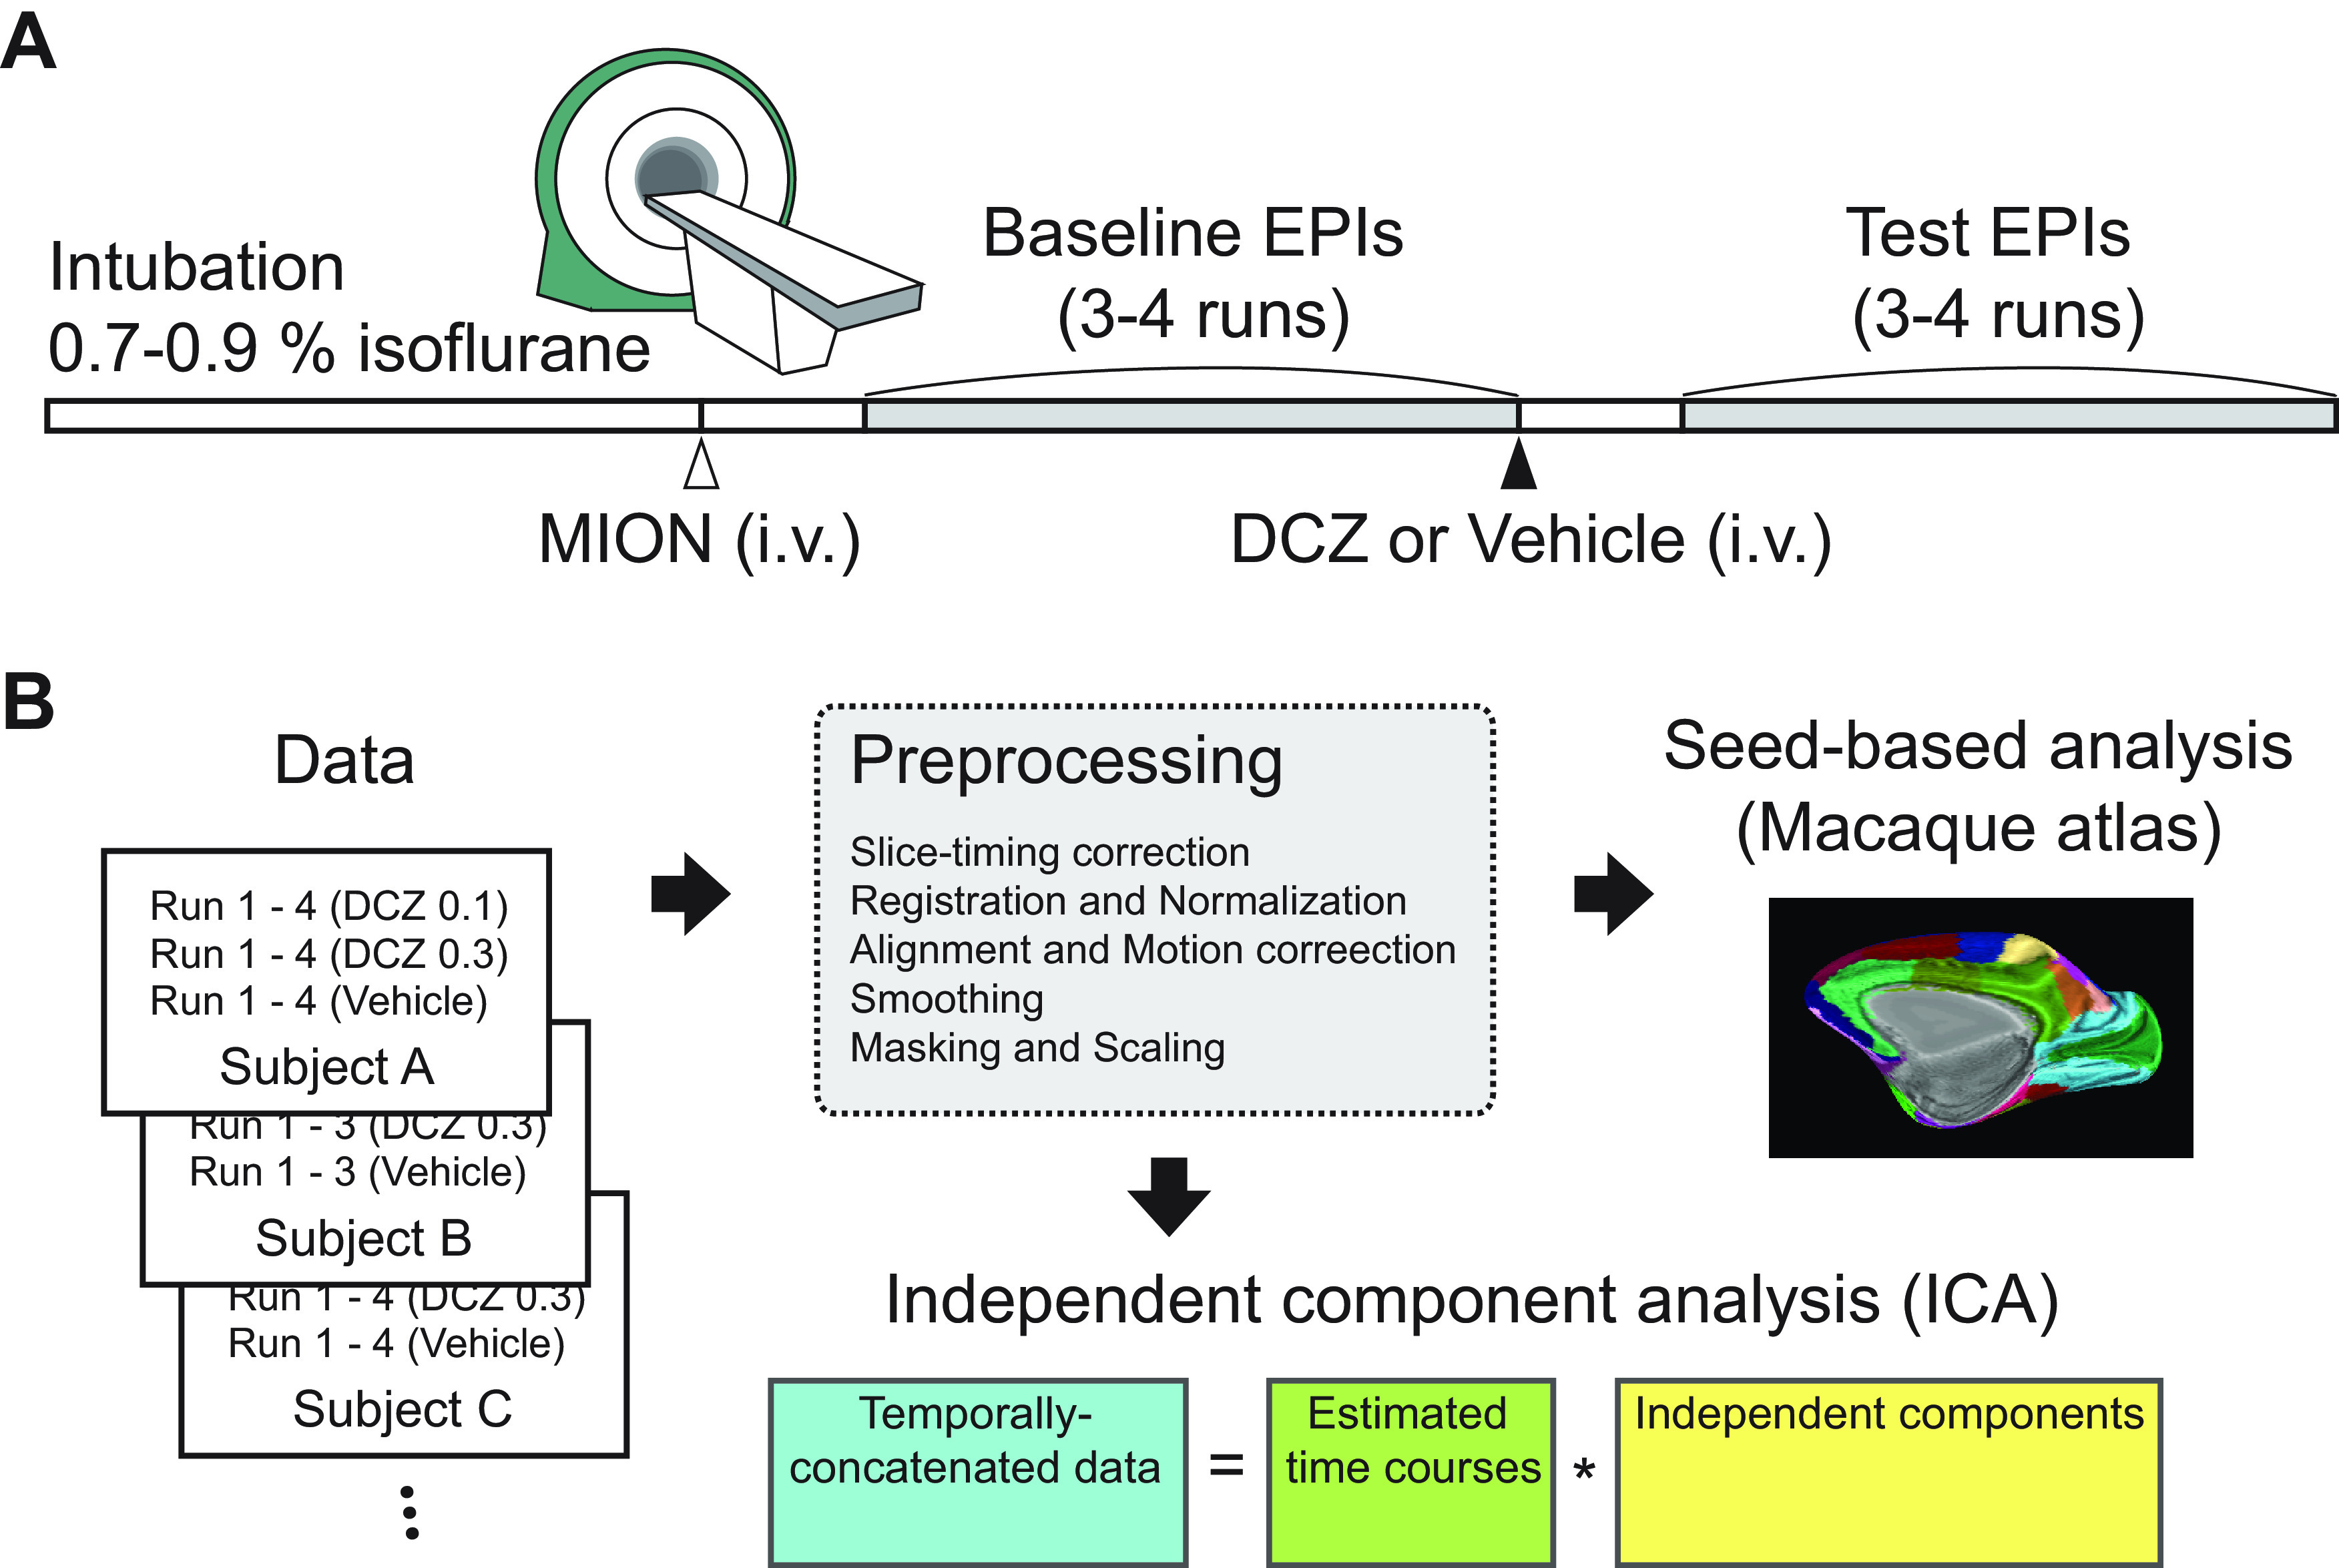
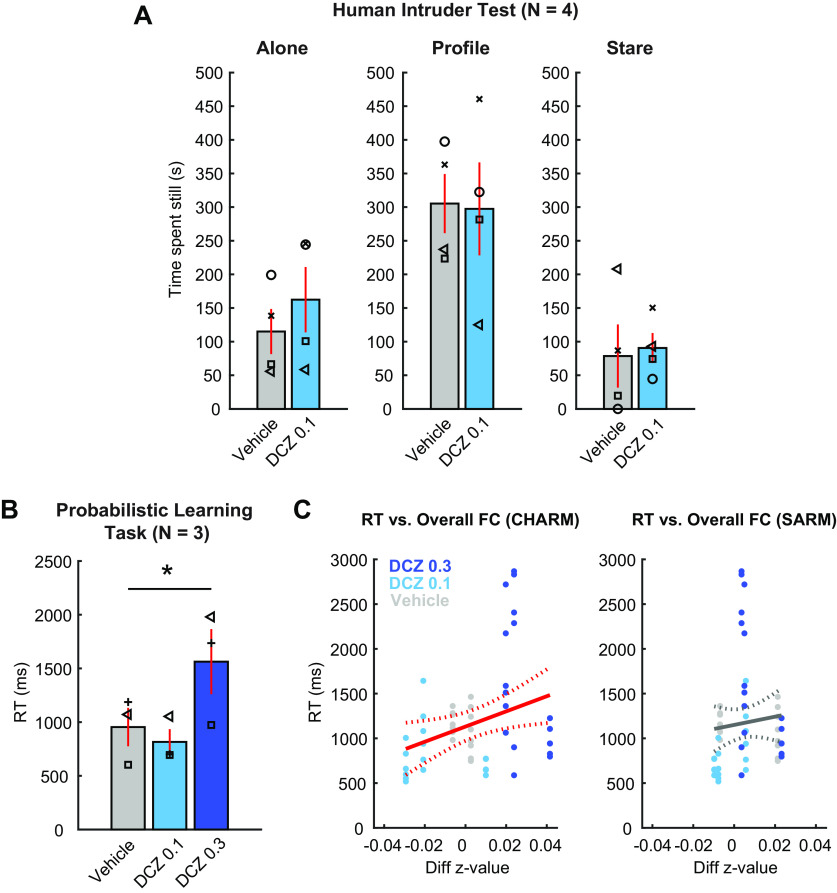
Chemogenetic techniques, such as designer receptors exclusively activated by designer drugs (DREADDs), enable transient, reversible, and minimally invasive manipulation of neural activity in vivo Their development in nonhuman primates is essential for uncovering neural circuits contributing to cognitive functions and their translation to humans. One key issue that has delayed the development of chemogenetic techniques in primates is the lack of an accessible drug-screening method. Here, we use resting-state fMRI, a noninvasive neuroimaging tool, to assess the impact of deschloroclozapine (DCZ) on brainwide resting-state functional connectivity in 7 rhesus macaques (6 males and 1 female) without DREADDs. We found that systemic administration of 0.1 mg/kg DCZ did not alter the resting-state functional connectivity. Conversely, 0.3 mg/kg of DCZ was associated with a prominent increase in functional connectivity that was mainly confined to the connections of frontal regions. Additional behavioral tests confirmed a negligible impact of 0.1 mg/kg DCZ on socio-emotional behaviors as well as on reaction time in a probabilistic learning task; 0.3 mg/kg DCZ did, however, slow responses in the probabilistic learning task, suggesting attentional or motivational deficits associated with hyperconnectivity in fronto-temporo-parietal networks. Our study highlights both the excellent selectivity of DCZ as a DREADD actuator, and the side effects of its excess dosage. The results demonstrate the translational value of resting-state fMRI as a drug-screening tool to accelerate the development of chemogenetics in primates.SIGNIFICANCE STATEMENT Chemogenetics, such as designer receptors exclusively activated by designer drugs (DREADDs), can afford control over neural activity with unprecedented spatiotemporal resolution. Accelerating the translation of chemogenetic neuromodulation from rodents to primates requires an approach to screen novel DREADD actuators in vivo Here, we assessed brainwide activity in response to a DREADD actuator deschloroclozapine (DCZ) using resting-state fMRI in macaque monkeys. We demonstrated that low-dose DCZ (0.1 mg/kg) did not change whole-brain functional connectivity or affective behaviors, while a higher dose (0.3 mg/kg) altered frontal functional connectivity and slowed response in a learning task. Our study highlights the excellent selectivity of DCZ at proper dosing, and demonstrates the utility of resting-state fMRI to screen novel chemogenetic actuators in primates.
Keywords: DREADDs; ICA; deschloroclozapine; functional connectivity; macaque monkey; rs-fMRI.
Copyright © 2022 the authors.
Figures
Similar articles
-
Chronic Behavioral Manipulation via Orally Delivered Chemogenetic Actuator in Macaques.J Neurosci. 2022 Mar 23;42(12):2552-2561. doi: 10.1523/JNEUROSCI.1657-21.2021. Epub 2022 Feb 2. J Neurosci. 2022. PMID: 35110390 Free PMC article.
-
The use of chemogenetic actuator ligands in nonhuman primate DREADDs-fMRI.Curr Res Neurobiol. 2022 Dec 30;4:100072. doi: 10.1016/j.crneur.2022.100072. eCollection 2023. Curr Res Neurobiol. 2022. PMID: 36691404 Free PMC article.
-
Deschloroclozapine, a potent and selective chemogenetic actuator enables rapid neuronal and behavioral modulations in mice and monkeys.Nat Neurosci. 2020 Sep;23(9):1157-1167. doi: 10.1038/s41593-020-0661-3. Epub 2020 Jul 6. Nat Neurosci. 2020. PMID: 32632286
-
Imaging-based chemogenetics for dissecting neural circuits in nonhuman primates.Proc Jpn Acad Ser B Phys Biol Sci. 2024;100(8):476-489. doi: 10.2183/pjab.100.030. Proc Jpn Acad Ser B Phys Biol Sci. 2024. PMID: 39401901 Free PMC article. Review.
-
Biophysical and neural basis of resting state functional connectivity: Evidence from non-human primates.Magn Reson Imaging. 2017 Jun;39:71-81. doi: 10.1016/j.mri.2017.01.020. Epub 2017 Feb 2. Magn Reson Imaging. 2017. PMID: 28161319 Free PMC article. Review.
Cited by
-
Validation of DREADD agonists and administration route in a murine model of sleep enhancement.J Neurosci Methods. 2022 Oct 1;380:109679. doi: 10.1016/j.jneumeth.2022.109679. Epub 2022 Jul 30. J Neurosci Methods. 2022. PMID: 35914577 Free PMC article.
-
Neural circuit mechanisms of epilepsy: Maintenance of homeostasis at the cellular, synaptic, and neurotransmitter levels.Neural Regen Res. 2026 Feb 1;21(2):455-465. doi: 10.4103/NRR.NRR-D-24-00537. Epub 2025 Jan 13. Neural Regen Res. 2026. PMID: 40326979 Free PMC article.
-
Chemogenetic attenuation of cortical seizures in nonhuman primates.Nat Commun. 2023 Feb 28;14(1):971. doi: 10.1038/s41467-023-36642-6. Nat Commun. 2023. PMID: 36854724 Free PMC article.
-
Multimodal Imaging for Validation and Optimization of Ion Channel-Based Chemogenetics in Nonhuman Primates.J Neurosci. 2023 Sep 27;43(39):6619-6627. doi: 10.1523/JNEUROSCI.0625-23.2023. Epub 2023 Aug 24. J Neurosci. 2023. PMID: 37620158 Free PMC article.
-
Chemogenetic inhibition of amygdala to ventrolateral prefrontal cortex communication selectively impacts contingent learning.bioRxiv [Preprint]. 2025 Jun 27:2025.06.26.661815. doi: 10.1101/2025.06.26.661815. bioRxiv. 2025. PMID: 40666866 Free PMC article. Preprint.
References
-
- Beckmann CF, Mackay CE, Filippini N, Smith SM (2009) Group comparison of resting-state FMRI data using multi-subject ICA and dual regression. Neuroimage 47:S148. 10.1016/S1053-8119(09)71511-3 - DOI
Publication types
MeSH terms
Substances
Grants and funding
LinkOut - more resources
Full Text Sources
Medical
Miscellaneous