. 2022 Jul 27;42(30):5816-5829.
doi: 10.1523/JNEUROSCI.1385-21.2022. Epub 2022 Jun 14.

Polybasic Patches in Both C2 Domains of Synaptotagmin-1 Are Required for Evoked Neurotransmitter Release

Affiliations

Polybasic Patches in Both C2 Domains of Synaptotagmin-1 Are Required for Evoked Neurotransmitter Release

Zhenyong Wu et al. J Neurosci. .

Abstract

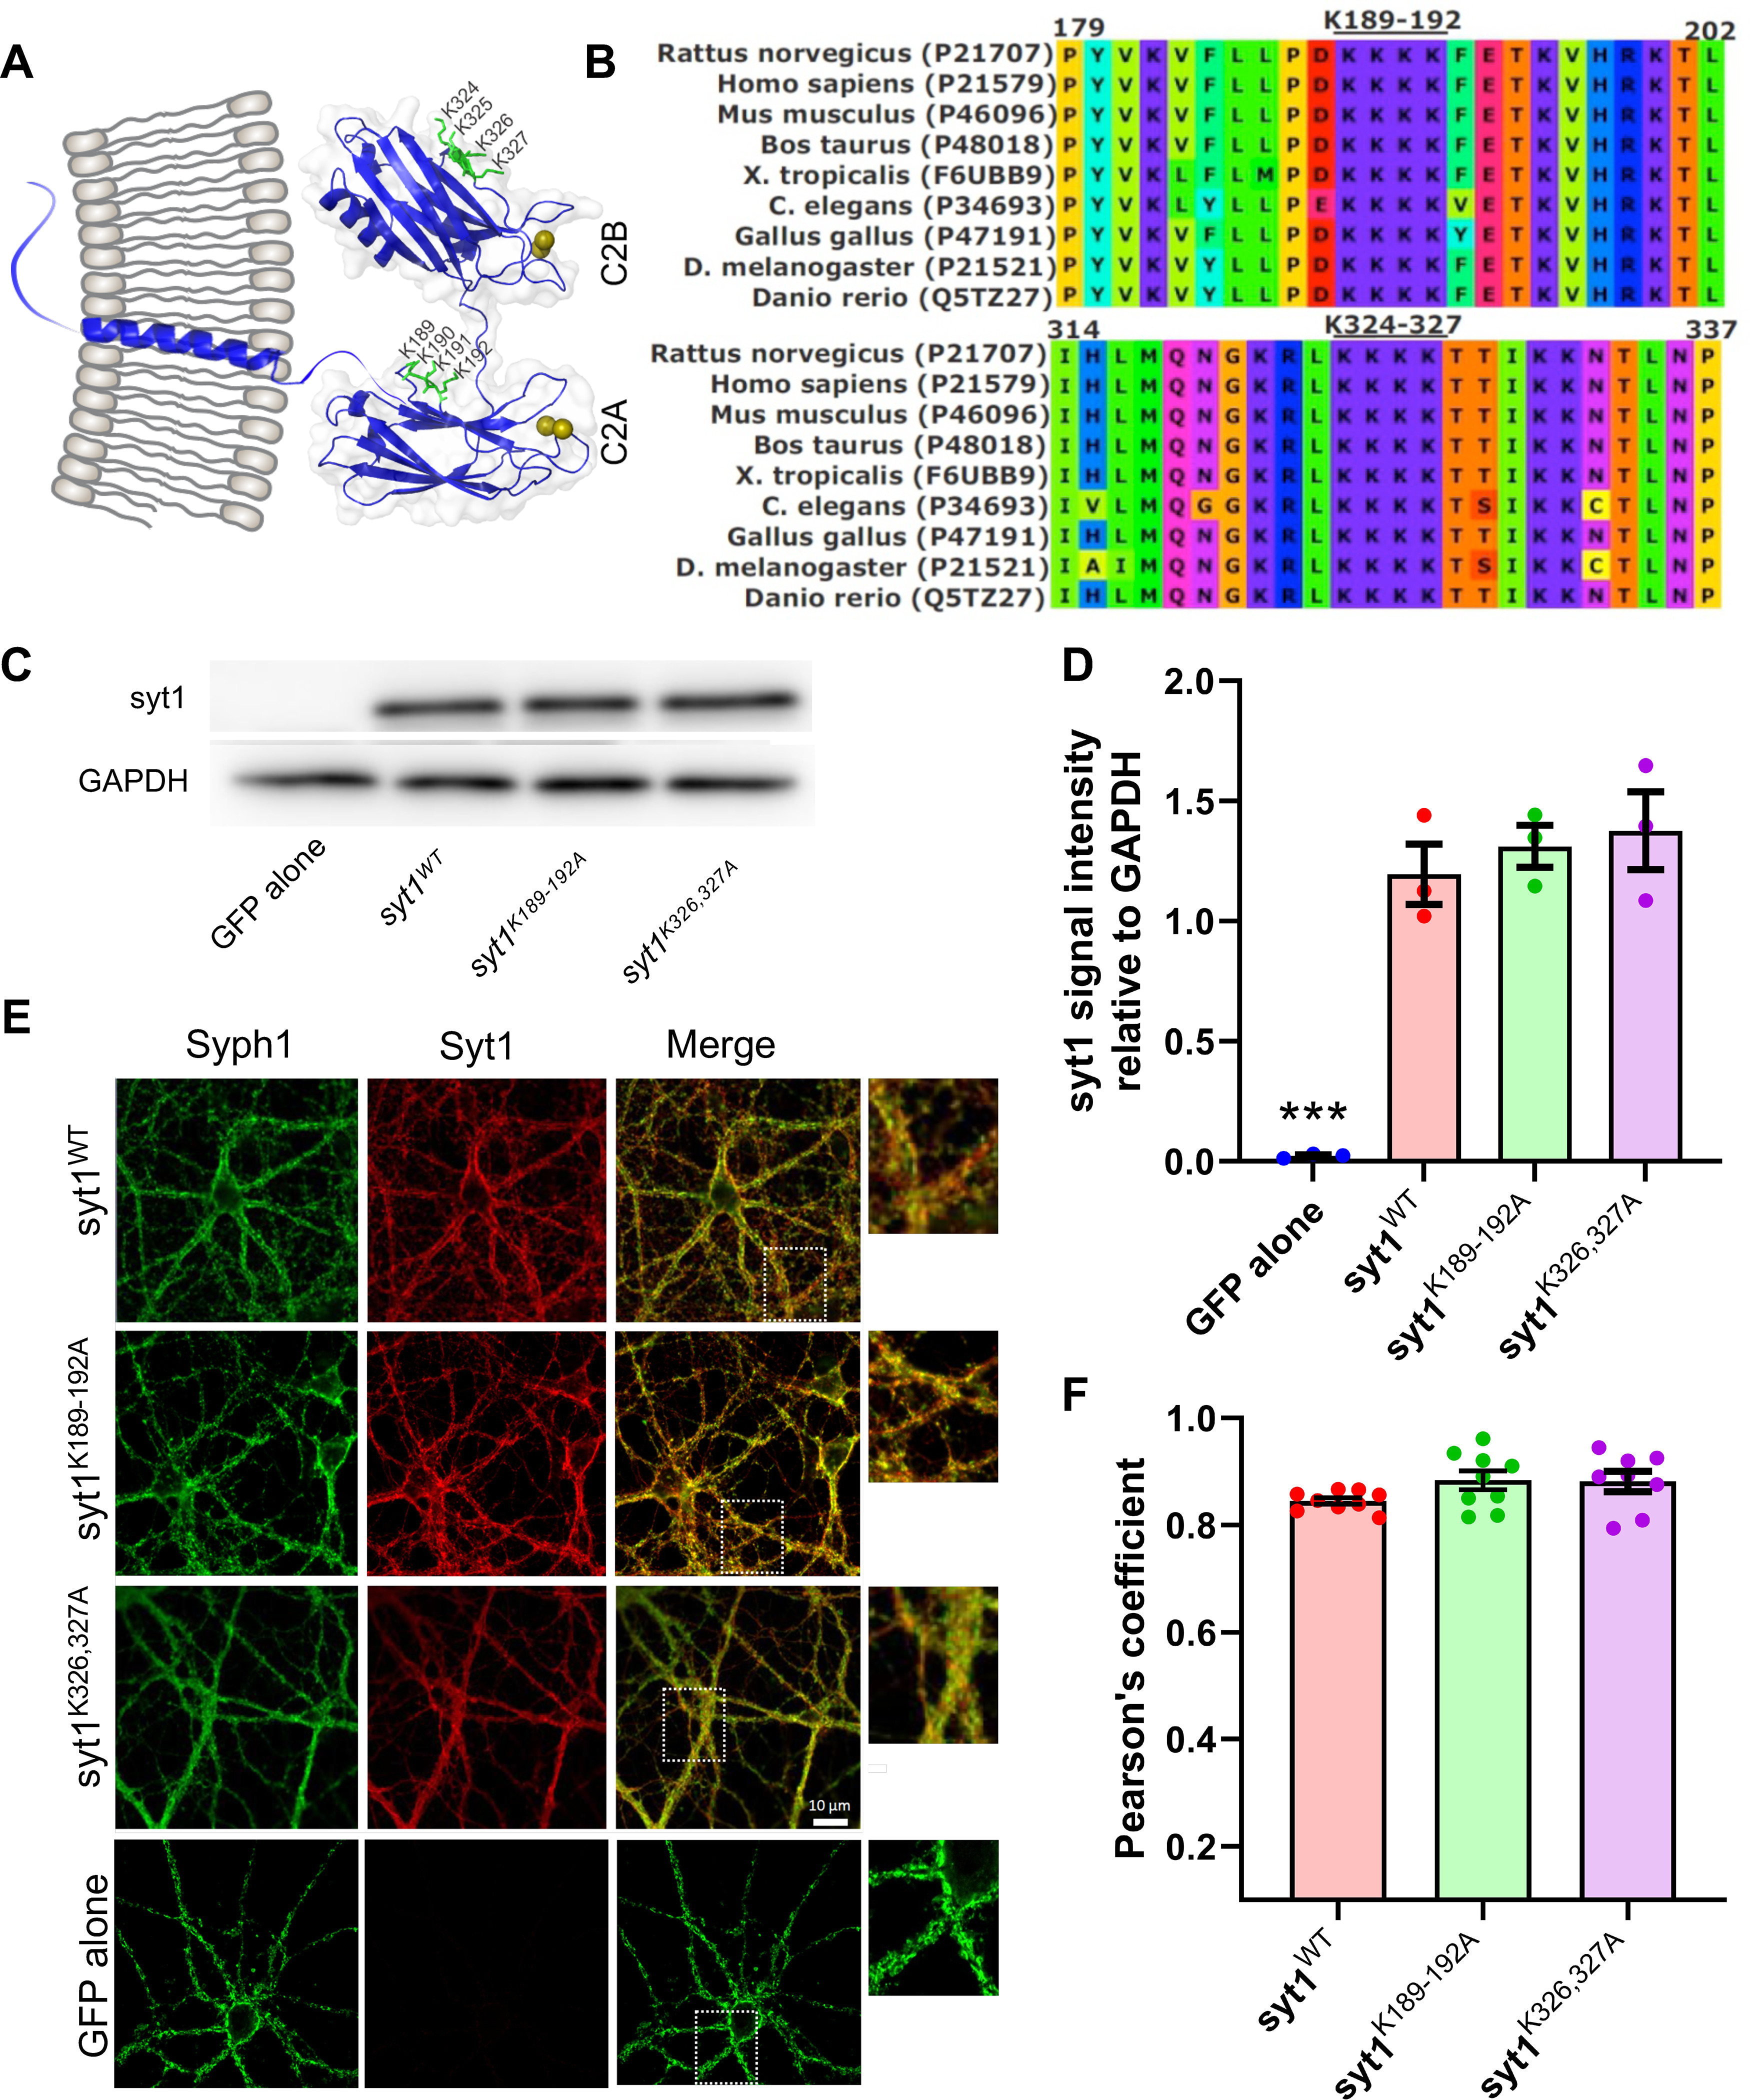
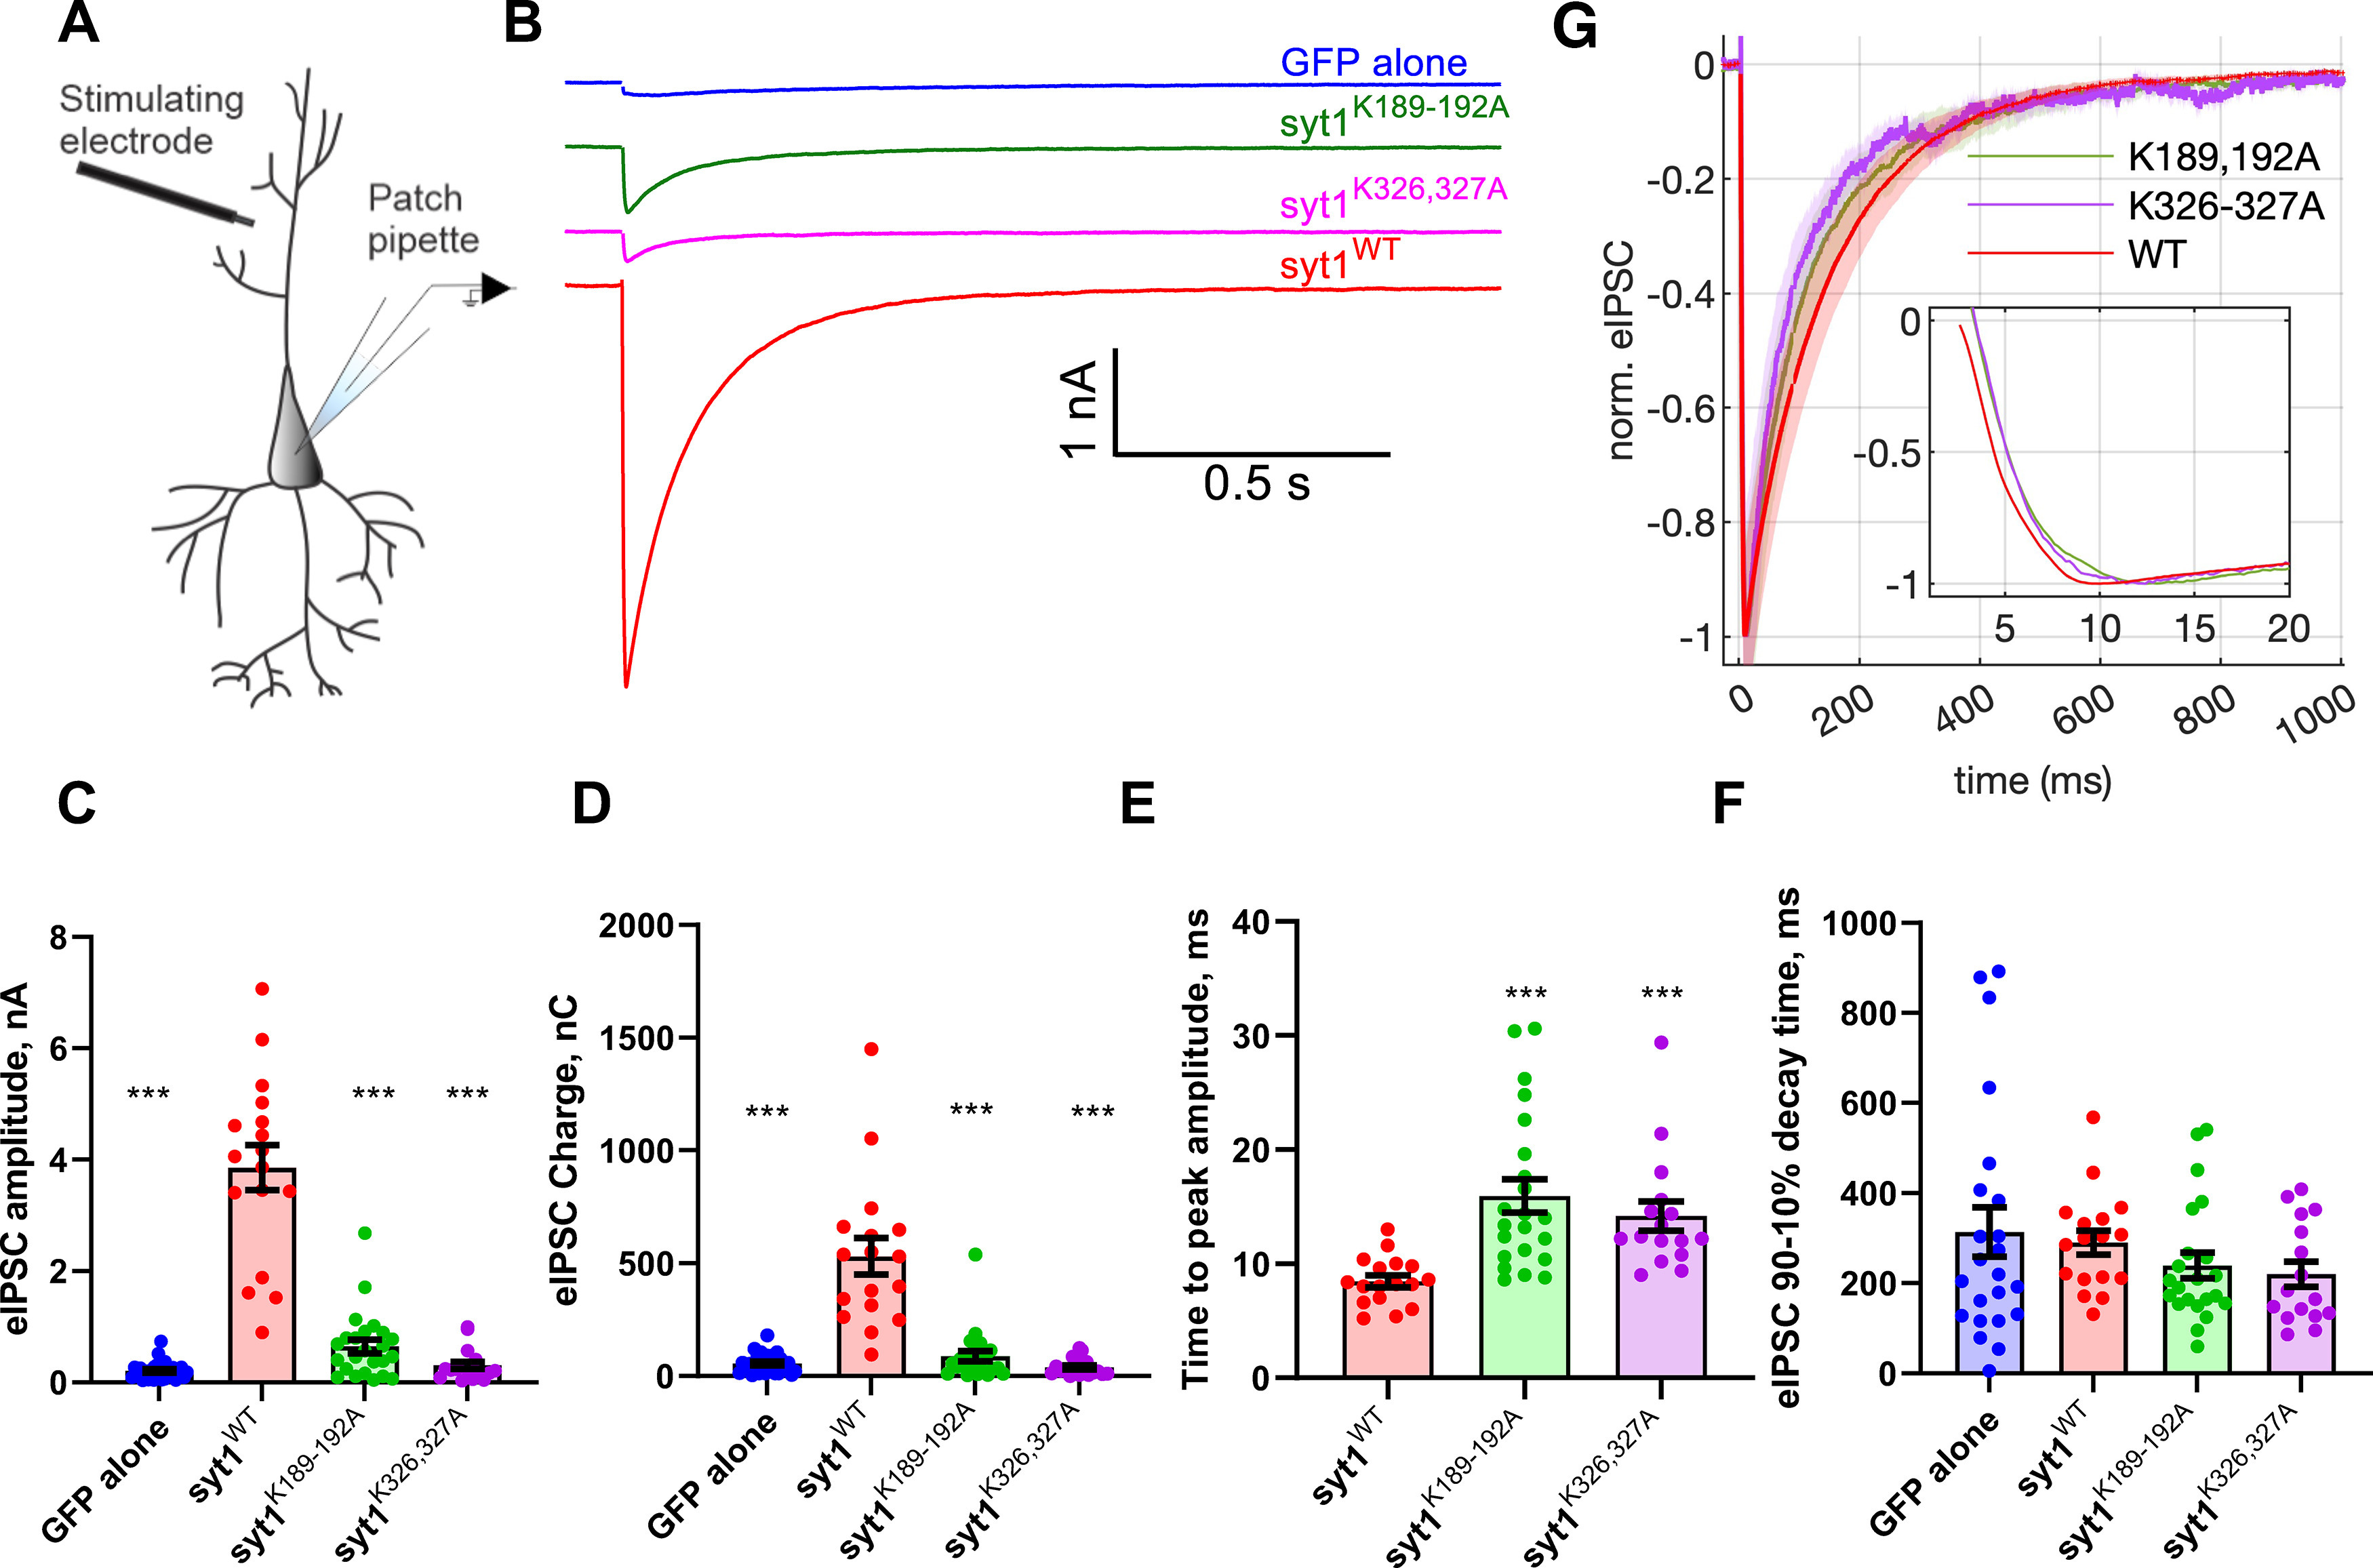
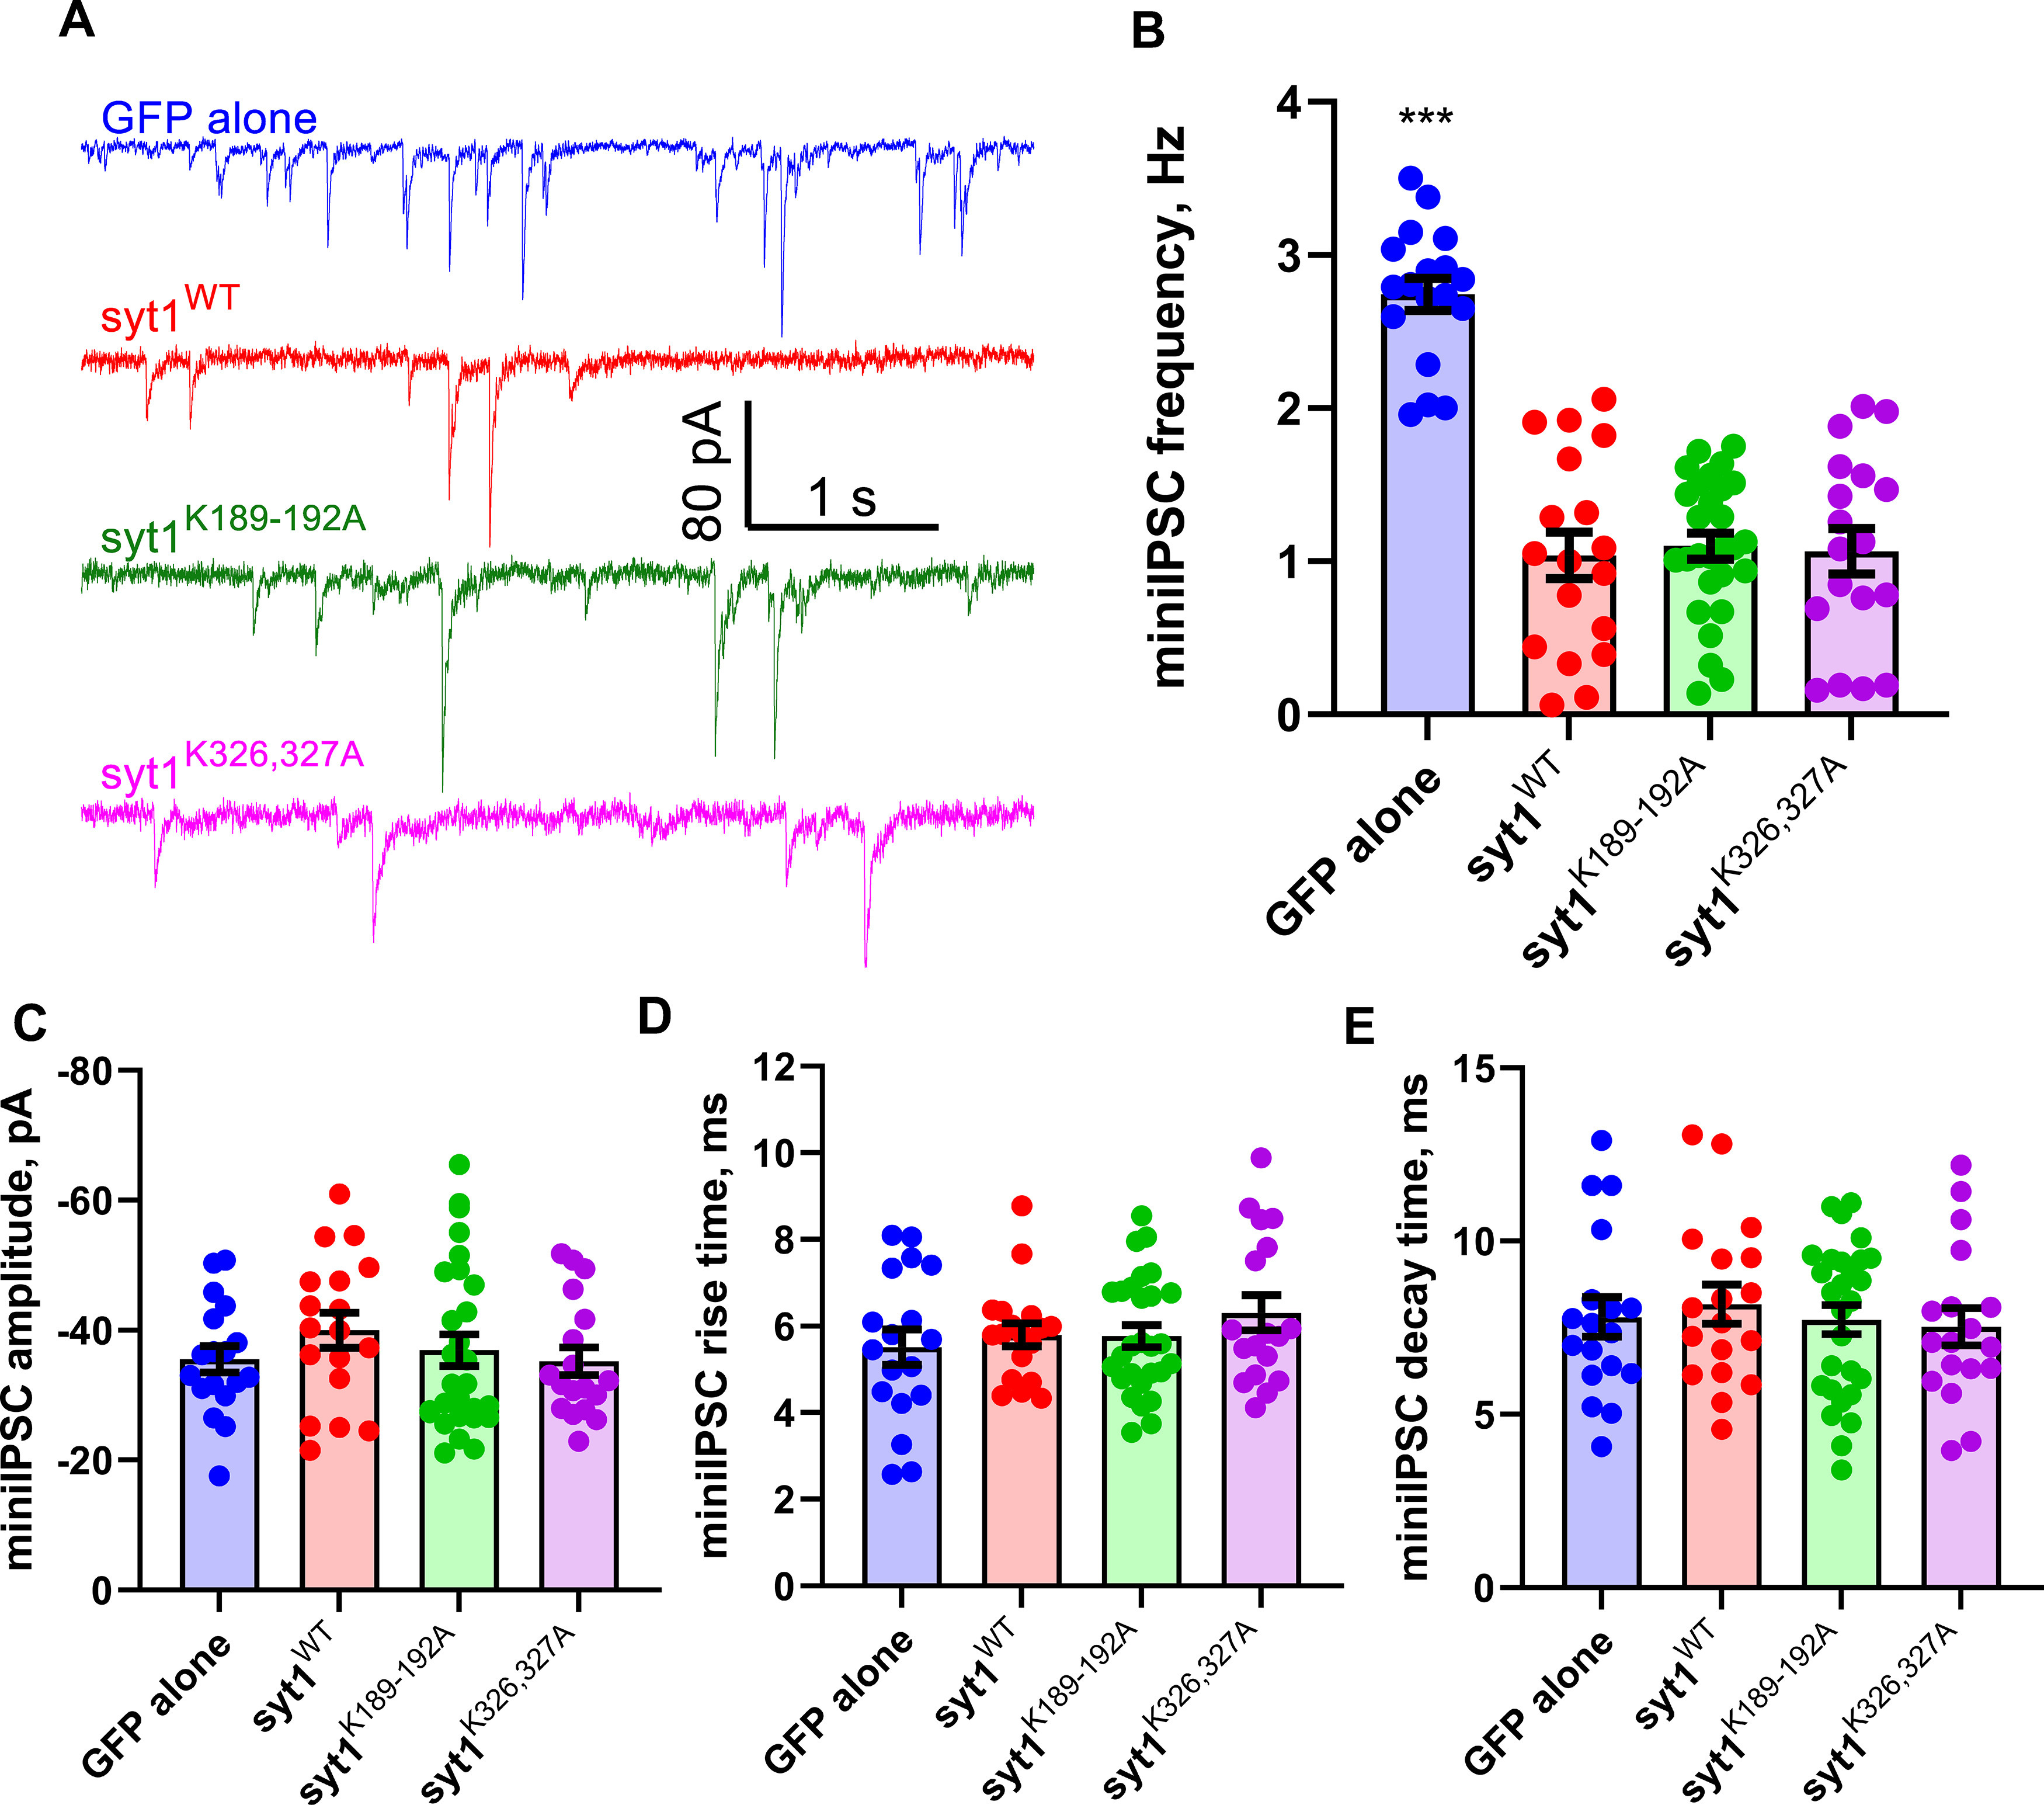
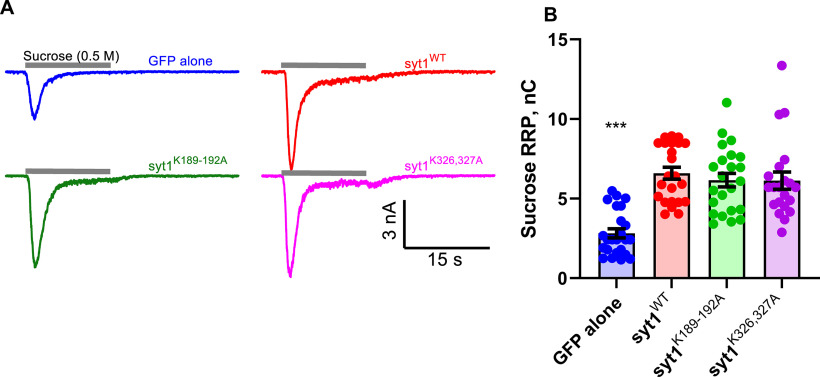
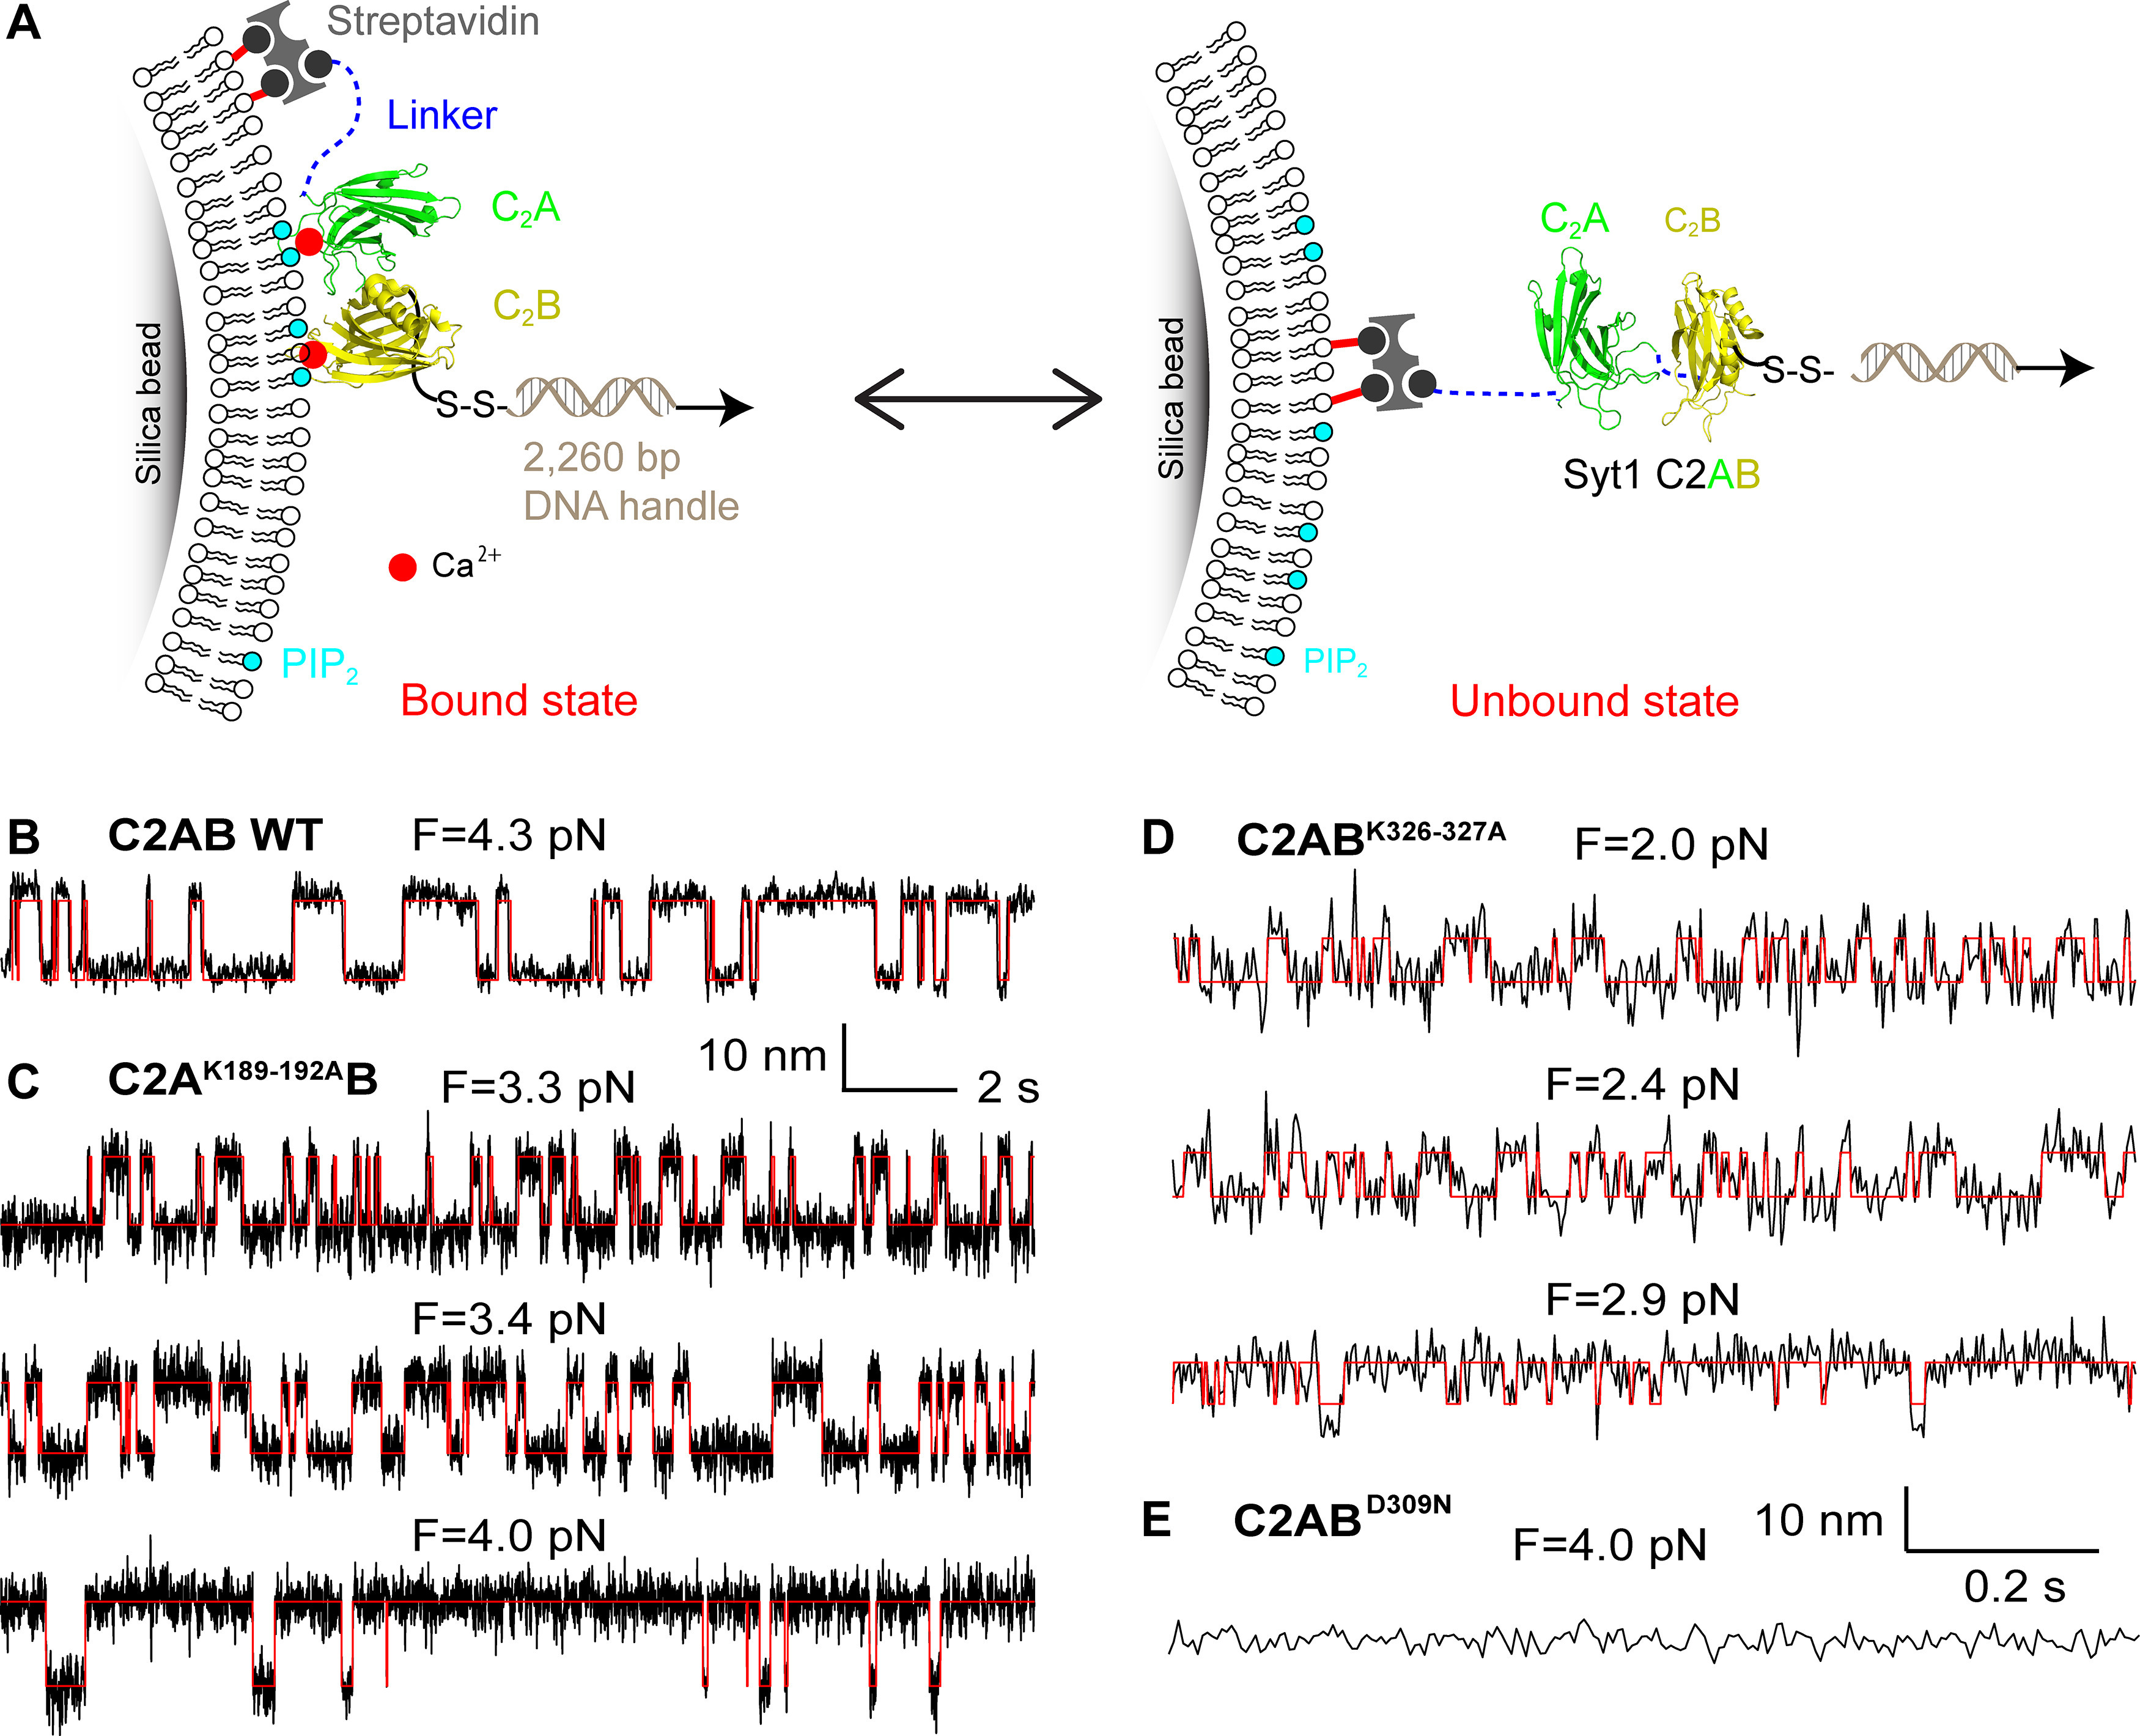
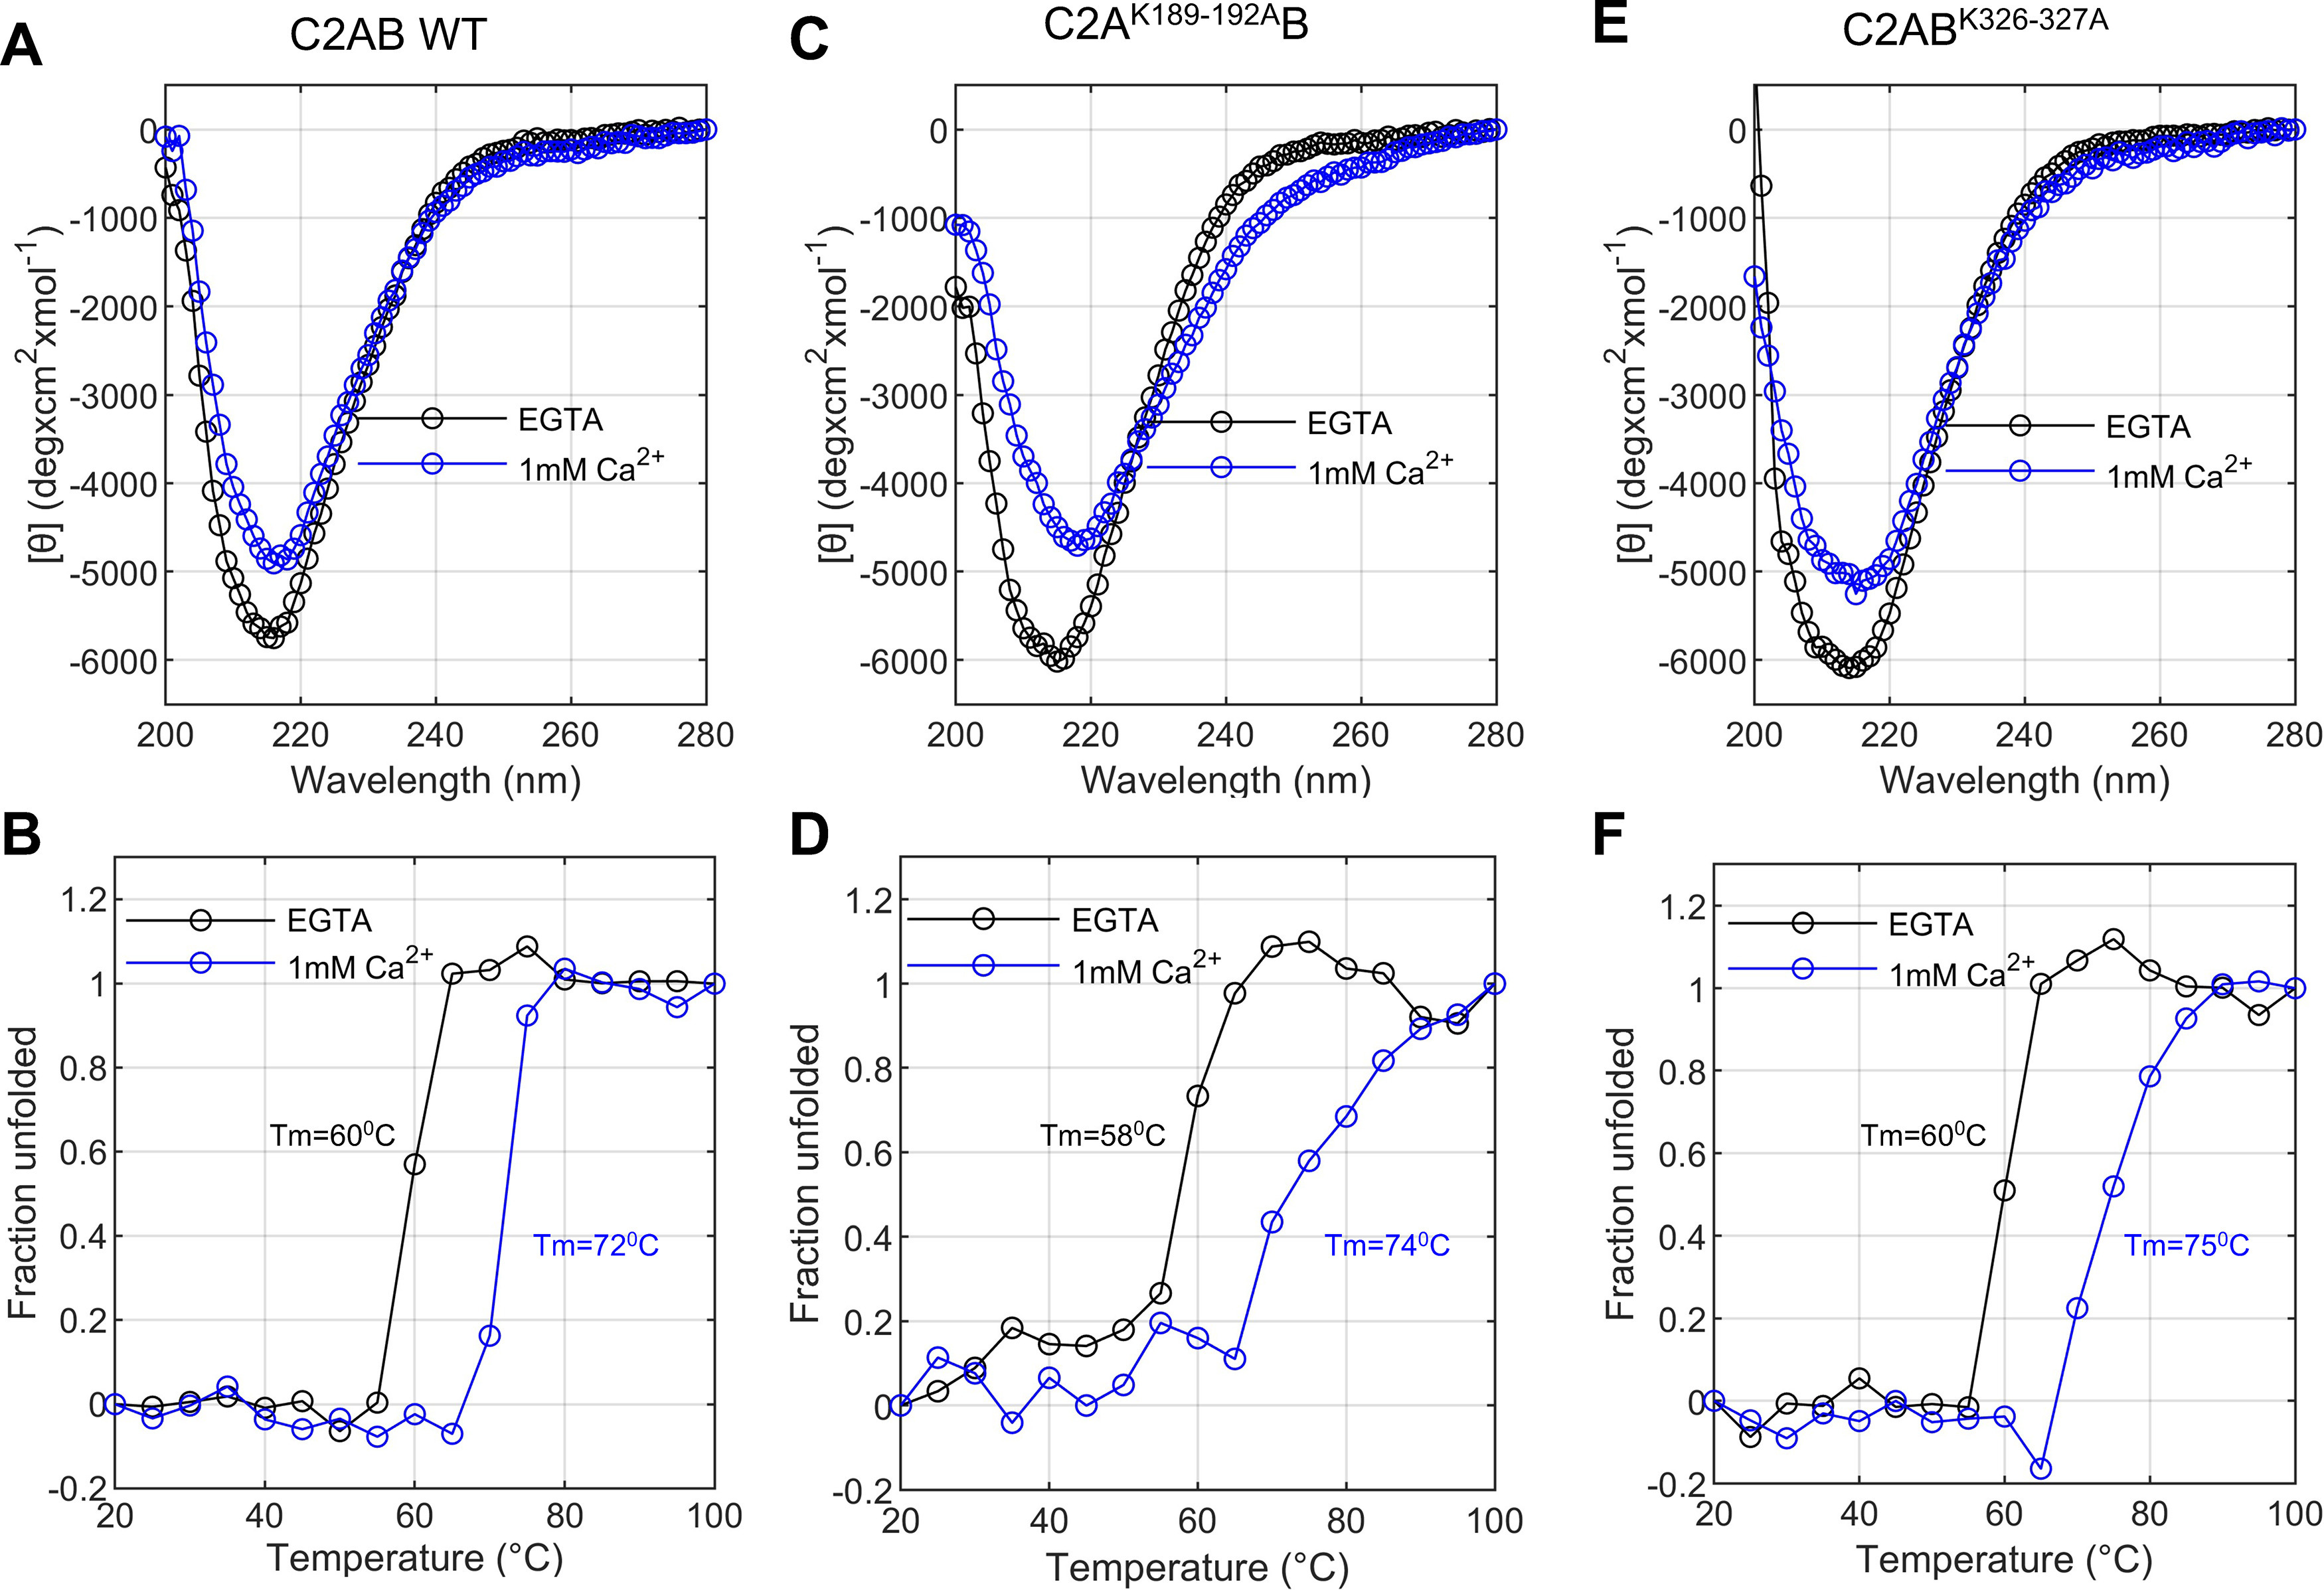
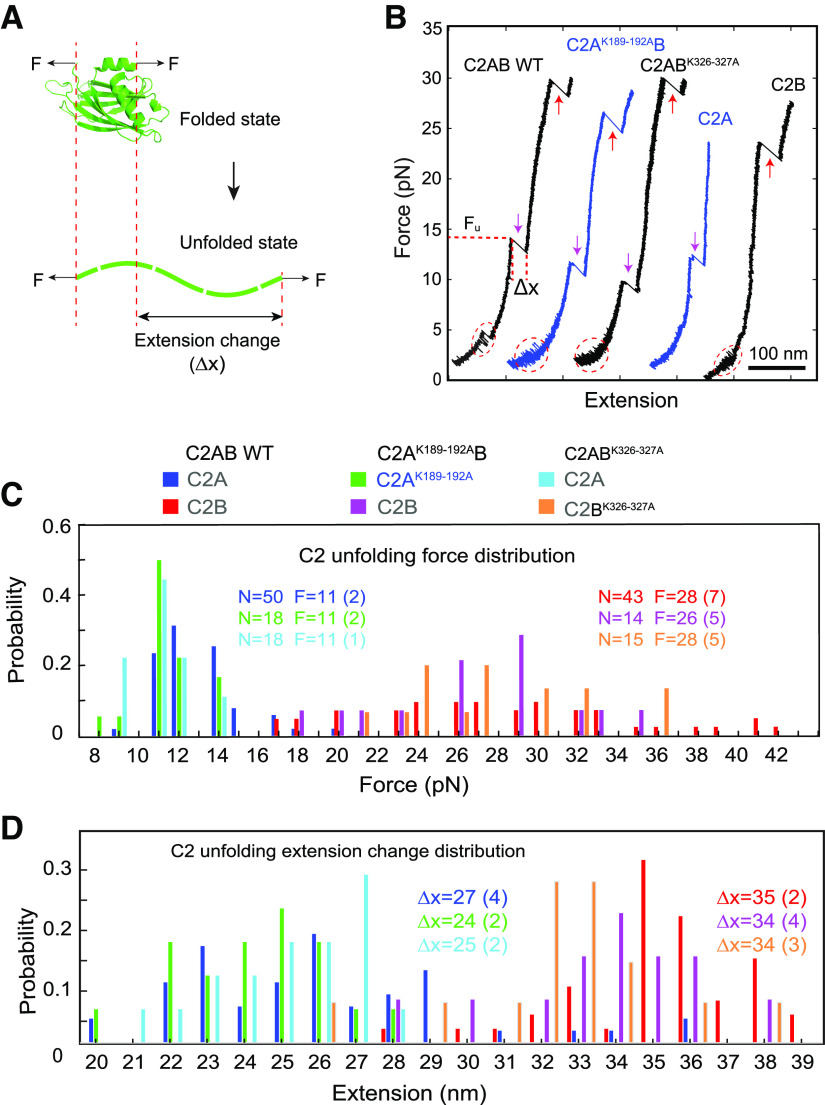
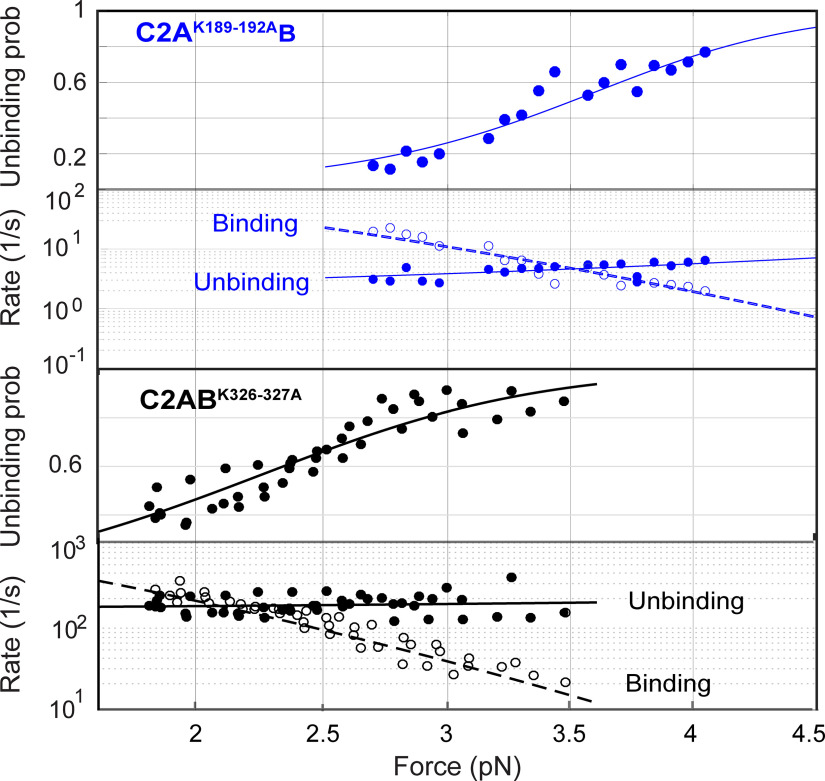
Synaptotagmin-1 (Syt1) is a vesicular calcium sensor required for synchronous neurotransmitter release, composed of a single-pass transmembrane domain linked to two C2 domains (C2A and C2B) that bind calcium, acidic lipids, and SNARE proteins that drive fusion of the synaptic vesicle with the plasma membrane. Despite its essential role, how Syt1 couples calcium entry to synchronous release is poorly understood. Calcium binding to C2B is critical for synchronous release, and C2B additionally binds the SNARE complex. The C2A domain is also required for Syt1 function, but it is not clear why. Here, we asked what critical feature of C2A may be responsible for its functional role and compared this to the analogous feature in C2B. We focused on highly conserved poly-lysine patches located on the sides of C2A (K189-192) and C2B (K324-327). We tested effects of charge-neutralization mutations in either region (Syt1K189-192A and Syt1K326-327A) side by side to determine their relative contributions to Syt1 function in cultured cortical neurons from mice of either sex and in single-molecule experiments. Combining electrophysiological recordings and optical tweezers measurements to probe dynamic single C2 domain-membrane interactions, we show that both C2A and C2B polybasic patches contribute to membrane binding, and both are required for evoked release. The size of the readily releasable vesicle pool and the rate of spontaneous release were unaffected, so both patches are likely required specifically for synchronization of release. We suggest these patches contribute to cooperative membrane binding, increasing the overall affinity of Syt1 for negatively charged membranes and facilitating evoked release.SIGNIFICANCE STATEMENT Synaptotagmin-1 is a vesicular calcium sensor required for synchronous neurotransmitter release. Its tandem cytosolic C2 domains (C2A and C2B) bind calcium, acidic lipids, and SNARE proteins that drive fusion of the synaptic vesicle with the plasma membrane. How calcium binding to Synaptotagmin-1 leads to release and the relative contributions of the C2 domains are unclear. Combining electrophysiological recordings from cultured neurons and optical tweezers measurements of single C2 domain-membrane interactions, we show that conserved polybasic regions in both domains contribute to membrane binding cooperatively, and both are required for evoked release, likely by increasing the overall affinity of Synaptotagmin-1 for acidic membranes.

Keywords: calcium-triggered exocytosis; exocytosis; membrane–protein interactions; neurotransmitter release; synaptotagmin.


Figures

Figure 1.
Figure 1.
Expression and targeting of Syt1 polybasic patch mutants are similar to those of wild-type Syt1. A, Schematic of the structure of Syt1, with the polybasic patches marked with ball-and-stick representation in green. The numbering refers to the mouse sequence. Calcium ions are depicted as dark yellow spheres. The C2A and C2B domains are rendered from Protein Data Bank entry 5CCG using PyMOL (PyMOL Molecular Graphics System, Schrödinger), whereas the rest of the molecule is schematically drawn using CorelDRAW. B, Multiple alignment of synaptotagmin-1 protein sequences from various species as indicated, using ClustalW (Sievers et al., 2011). The uniprot access codes are shown in parentheses (https://www.uniprot.org/). C, Western blot analysis of the expression of wild-type or mutant Syt1 transgenes in syt1−/− mouse neonatal cortical cultures. A representative result from three separate experiments is shown. D, Quantification of the Western blots, showing that all syt1 constructs were expressed at similar levels. For each condition, the integrated pixel intensity for the Syt1 band was normalized to that of GAPDH, and the mean ± SEM from three independent experiments is shown; ***p < 0.01, n.s. at 5% level (1-way ANOVA, followed by Dunnett's test to compare mutants against WT Syt1; WT vs Syt1K189-192A, p = 0.81; WT vs Syt1K326327A, p = 0.56). E, Exogenously expressed wild-type or mutant Syt1 are correctly targeted. Immunofluorescence signals of Syt1 variants were compared with those of Syph1, a synaptic vesicle marker. The boxed regions in the third column are shown expanded on the right. F, Quantification of colocalization of Syph1 and Syt1 immunofluorescence signals using Pearson's correlation coefficient (a value of 1 indicates perfect colocalization). There were no significant differences among the groups (1-way ANOVA, followed by Dunnett's test to compare mutants against WT Syt1; WT vs Syt1K189-192A, p = 0.14; WT vs Syt1K326327A, p = 0.18).
Figure 2.
Figure 2.
Syt1 C2A and C2B polybasic patch mutations dramatically reduce evoked release. A, Schematic of the recording configuration. B, Representative examples of IPSCs recorded from cultured syt1−/− cortical neurons expressing the indicated transgenes. Neurons expressing the Syt1 C2A (Syt1K189-192A) or C2B (Syt1K326-327A) polybasic patch mutations had greatly diminished responses compared with neurons expressing wild-type Syt1. Neurons lacking Syt1 expression had nearly all evoked release abolished. C–F, Quantification of evoked release parameters. eIPSC amplitudes were (mean ± SEM; in nA) GFP alone, 0.21 ± 0.03; WT, 3.9 ± 0.40; syt1K189-192A, 0.65 ± 0.12; syt1K326,327A, 0.31 ± 0.07 (C). eIPSC charges (time integrals of the IPSC traces, mean ± SEM; in nC) were GFP alone, 55.48 ± 8.12; WT, 531.5 ± 80.84; syt1K189-192A, 88.98 ± 22.38; syt1K326,327A, 38.97 ± 9.30 (D). Time to reach the negative eIPSC peak from the time stimulation is applied (mean ± SEM; in ms) GFP alone, 82.91 ± 8.12 (data not shown); WT, 8.471 ± 0.51; syt1K189-192A, 15.95 ± 1.47; syt1K326,327A, 14.19 ± 1.29 (E). Five traces (GFP alone), two traces (syt1K189-192A), and two traces (syt1K326,327A) with very little response were excluded from analysis as the time to peak could not be determined accurately. F, eIPSC decay times were (mean ± SEM; ms) GFP alone, 263.8 ± 50.34; WT, 290.3 ± 26.80; syt1K189-192A, 228.1 ± 27.53; syt1K326,327A, 178.6 ± 29.19 (n = 28, 17, 24, and 18 cells tested for GFP alone, WT syt1, syt1K189-192A, and syt1K326,327A, respectively). The same traces excluded from analysis in E were also excluded here. G, Averaged eIPSCs, normalized to the negative peak value for the conditions as indicated. The shaded patches represent SEM. Inset, Short time scales. Cells were prepared from 5 syt1−/− pups. For C–F we used Kruskal–Wallis test, followed by Dunn's multiple comparisons test to compare mutants against WT Syt1; *p < 0.05, **p < 0.01, ***p < 0.001, respectively. See Extended Data Figure 2-1 for effect size estimation of evoked release parameters.
Figure 3.
Figure 3.
Syt1 C2A and C2B polybasic patch mutations do not affect spontaneous release. A, Representative current traces from voltage-clamped, resting cortical mouse syt−/− neurons expressing the indicated transgenes. B–E, Quantification of mIPSC parameters from traces such as the ones shown in A. Apart from an increase in the mIPSC frequency for neurons lacking Syt1 (B), there are no significant differences among the experimental groups for mIPSC amplitude (C), rise time (D), or decay time (E). mIPSC frequencies were (mean ± SEM; Hz) GFP alone, 2.74 ± 0.10; WT, 1.04 ± 0.15; syt1K189-192A, 1.1 ± 0.09; syt1K326,327A, 1.07 ± 0.15. mIPSC amplitudes were (mean ± SEM; pA) GFP alone, −35.54 ± 2.04; WT, −40.00 ± 2.69; syt1K189-192A, −36.95 ± 2.42; syt1K326,327A, −35.22 ± 2.13. mIPSC rise times were (mean ± SEM; ms) GFP alone 5.52 ± 0.41; WT, 5.80 ± 0.27; syt1K189-192A. 5.77 ± 0.26; syt1K326,327A, 6.31 ± 0.40. mIPSC decay times were (mean ± SEM; ms) GFP alone, 7.81 ± 0.57; WT, 8.183 ± 0.56; syt1K189-192A, 7.74 ± 0.42; syt1K326,327A, 7.536 ± 0.53 (n = 18, 18, 28, and 18 cells tested for GPF alone, WT syt1, syt1K189-192A, and syt1K326,327A, respectively. Cells were prepared from three syt1−/− pups. For B–E, we used Kruskal–Wallis test, followed by Dunn's multiple comparisons test to compare mutants against WT Syt1; ***p < 0.001.
Figure 4.
Figure 4.
Polybasic patch mutations do not affect the readily releasable pool. A, Representative current traces elicited by application of a 0.5 m sucrose solution for 15 s, indicated by the gray bars above each trace, for syt1 KO neurons expressing the indicated transgenes. B, Integral of the hypertonic sucrose-induced currents to estimate the size of the RRP. The RRP size is indistinguishable for Syt1WT, Syt1K189-192A, and Syt1K326-327A, but is lower by ∼2.4-fold for neurons lacking Syt1. Sucrose-induced total charges (RRP sizes) were (mean ± SEM; nC) GFP alone, 2.82 ± 0.28; WT, 6.59 ± 0.375; syt1K189-192A, 6.16 ± 0.43; syt1K326,327A, 6.13 ± 0.54 (n = 24, 23, 23, and 21 cells tested for GFP alone, syt1 WT, syt1K189-192A, and syt1K326,327A, respectively). We used the Kruskal–Wallis test, followed by Dunn's multiple comparisons test to compare mutants against WT Syt1. ***p < 0.001. Extended Data Figure 4-1 shows estimation of effect sizes.
Figure 5.
Figure 5.
The neutralization mutations in Syt1 C2AB domain impair its membrane binding as revealed by optical tweezers. A, Schematic of the experimental setup. The Syt1 construct was directly attached to the supported bilayer via biotin-streptavidin interactions at the N terminus and cross-linked to a DNA handle via a disulfide bond. The other end of the DNA was attached to a polystyrene bead (data not shown). Membrane binding and unbinding of the C2AB domain was detected by the corresponding extension change of the protein-DNA tether. The bilayer is composed of 85 mol% POPC, 10 mol% DOPS, 5 mol% PI(4,5)P2, and 0.03% mol% biotin-PEG-DSPE. B–E, Extension-time trajectories at the indicated constant mean forces showing dynamic C2AB binding of wild-type StyI C2AB (B), C2AK189-192AB (C), or C2ABK326-327A (D), or no membrane binding of C2ABD309N (E). Note that the extension-time trajectories in B and C and D and E share the same scale bars.
Figure 6.
Figure 6.
Circular dichroism analysis shows the purified recombinant proteins are well folded, and the polybasic patch mutations do not affect protein stability. A, C, E, Molar ellipticity as a function of wavelength for purified recombinant wild-type Syt1 C2AB domains (A) and Syt1 C2AB domains bearing mutations in the C2A (C2AK189-192AB; C) or the C2B (C2ABK326-327A; E) polybasic patch as indicated. Data were collected in the absence (1 mm EGTA, black) or presence of 1 mm Ca2+ (blue) at 25°C. Each spectrum represents the average of three separate recordings. B, D, F, Thermal denaturation curves for WT (B), C2AK189-192AB (D), or C2ABK326-327A (F), measured at 217 nm.
Figure 7.
Figure 7.
The charge neutralization mutations do not significantly alter folding of the C2 domains. A, Diagram showing force-induced unfolding of C2 domains to access their structure and stability based on the unfolding force and extension change associated with the C2 domain unfolding. B, Force-extension curves obtained by pulling a single Syt1 C2AB, C2A, or C2B domain with a trap separation speed of 10 nm/s. The C2 domain was attached to the lipid bilayer coated on the silica bead in the presence of 100 µm Ca2+. Different C2 transitions are marked with red dashed ovals for reversible membrane binding and unbinding, magenta arrows for C2A domain unfolding, and red arrows for C2B domain unfolding. The C2 domain unfolding force (Fu) and its associated extension change (Δx) were determined for each C2 unfolding event, as indicated. C, Unfolding force histograms of C2A and C2B domains in the wild-type or mutant Syt1 C2AB constructs. The total number of unfolding events (N) and the average unfolding force (F) and its SD (in parenthesis) are shown. The close average unfolding force for the mutant or wild-type C2A or C2B domain indicates that the mechanical stability of the C2 domain is not altered by charge neutralization mutations. D, Extension change histograms of C2A and C2B domains. Comparisons of the extension changes between wild-type and mutant C2 domains suggest that the charge neutralization mutations barely affect the structures of the C2 domains.
Figure 8.
Figure 8.
Force-dependent C2AB unbinding probabilities and binding and unbinding rates. All the experimental measurements (symbols) are simultaneously nonlinearly fit by a theoretical model to account for the effect of force on protein binding and unbinding (curves) to derive the membrane binding energy and the rate constants (see above, Materials and Methods) for Syt1 C2AK189-192AB (top two rows) and C2ABK326-327A (bottom two rows).

References

    1. Bai H, Xue R, Bao H, Zhang L, Yethiraj A, Cui Q, Chapman ER (2016) Different states of synaptotagmin regulate evoked versus spontaneous release. Nat Commun 7:10971. 10.1038/ncomms10971 - DOI - PMC - PubMed
    1. Bai J, Earles CA, Lewis JL, Chapman ER (2000) Membrane-embedded synaptotagmin penetrates cis or trans target membranes and clusters via a novel mechanism. J Biol Chem 275:25427–25435. 10.1074/jbc.M906729199 - DOI - PubMed
    1. Bai J, Tucker WC, Chapman ER (2004a) PIP2 increases the speed of response of synaptotagmin and steers its membrane-penetration activity toward the plasma membrane. Nat Struct Mol Biol 11:36–44. 10.1038/nsmb709 - DOI - PubMed
    1. Bai J, Wang CT, Richards DA, Jackson MB, Chapman ER (2004b) Fusion pore dynamics are regulated by synaptotagmin*t-SNARE interactions. Neuron 41:929–942. 10.1016/S0896-6273(04)00117-5 - DOI - PubMed
    1. Bommert K, Charlton MP, DeBello WM, Chin GJ, Betz H, Augustine GJ (1993) Inhibition of neurotransmitter release by C2-domain peptides implicates synaptotagmin in exocytosis. Nature 363:163–165. 10.1038/363163a0 - DOI - PubMed

Publication types

Associated data