

Review
doi: 10.1101/cshperspect.a041046.
The Mitochondrial Pathway of Apoptosis Part II: The BCL-2 Protein Family
Affiliations
- PMID: 35701220
- PMCID: PMC9248827
- DOI: 10.1101/cshperspect.a041046
Item in Clipboard
Review
The Mitochondrial Pathway of Apoptosis Part II: The BCL-2 Protein Family
Cold Spring Harb Perspect Biol.
.
No abstract available
Figures
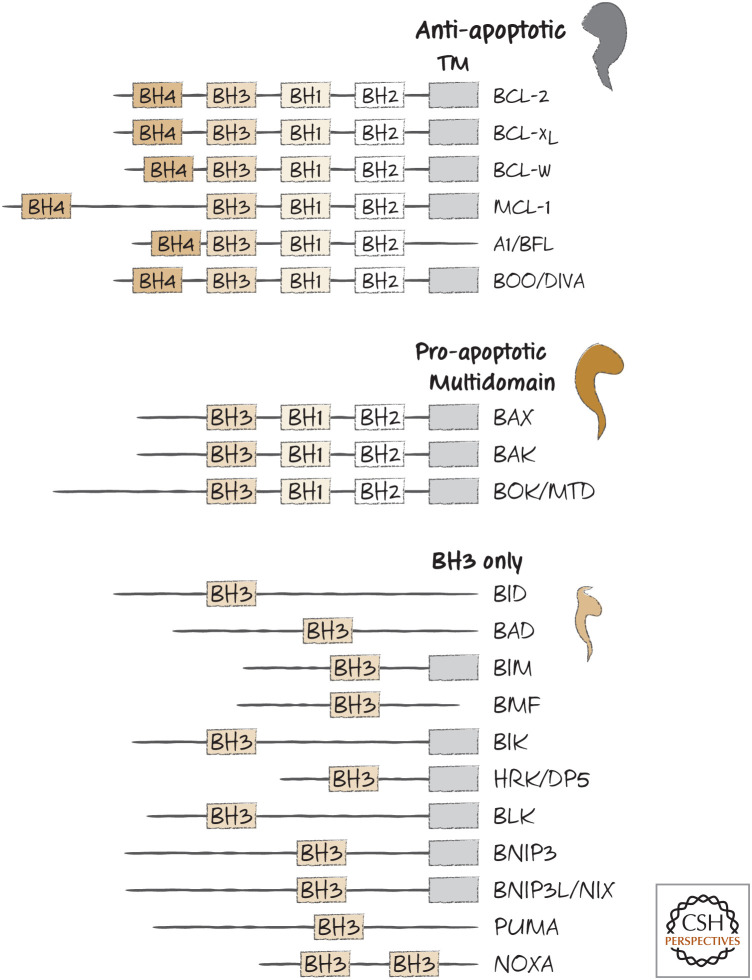
BH domain organization of selected members of the BCL-2 family. TM, transmembrane domain (although in some cases, this is sequestered by the BH groove).
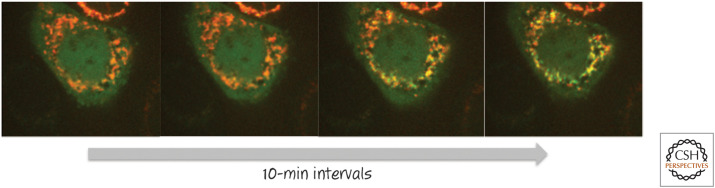
BAX moves from the cytosol to the mitochondrial outer membrane during apoptosis. A cell engineered to express both BAX linked to green fluorescent protein (BAX–GFP) and a red fluorescent protein (RFP) that localizes to mitochondria was induced to undergo apoptosis. BAX (green) moves onto the mitochondria (red), revealed as the development of a yellow signal (i.e., merging of red and green emissions) over time. The first image was taken several hours after the initial stress. (Courtesy of Dr. Stephen Tait, University of Glasgow, Scotland, United Kingdom).
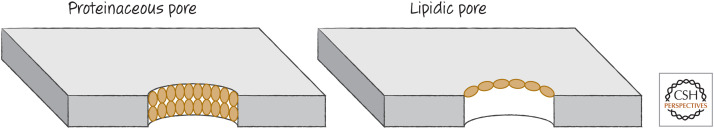
Proteinaceous versus lipidic pores. In a proteinaceous pore, the pore-forming protein “coats” the pore, penetrating the membrane. In a lipidic pore, the protein causes changes in the membrane lipids to produce the opening. Although some models propose a proteinaceous pore comprising the effector proteins (BAX, BAK, or BOK) for MOMP, most evidence supports the idea that these proteins induce the formation of lipidic pores to effect MOMP.
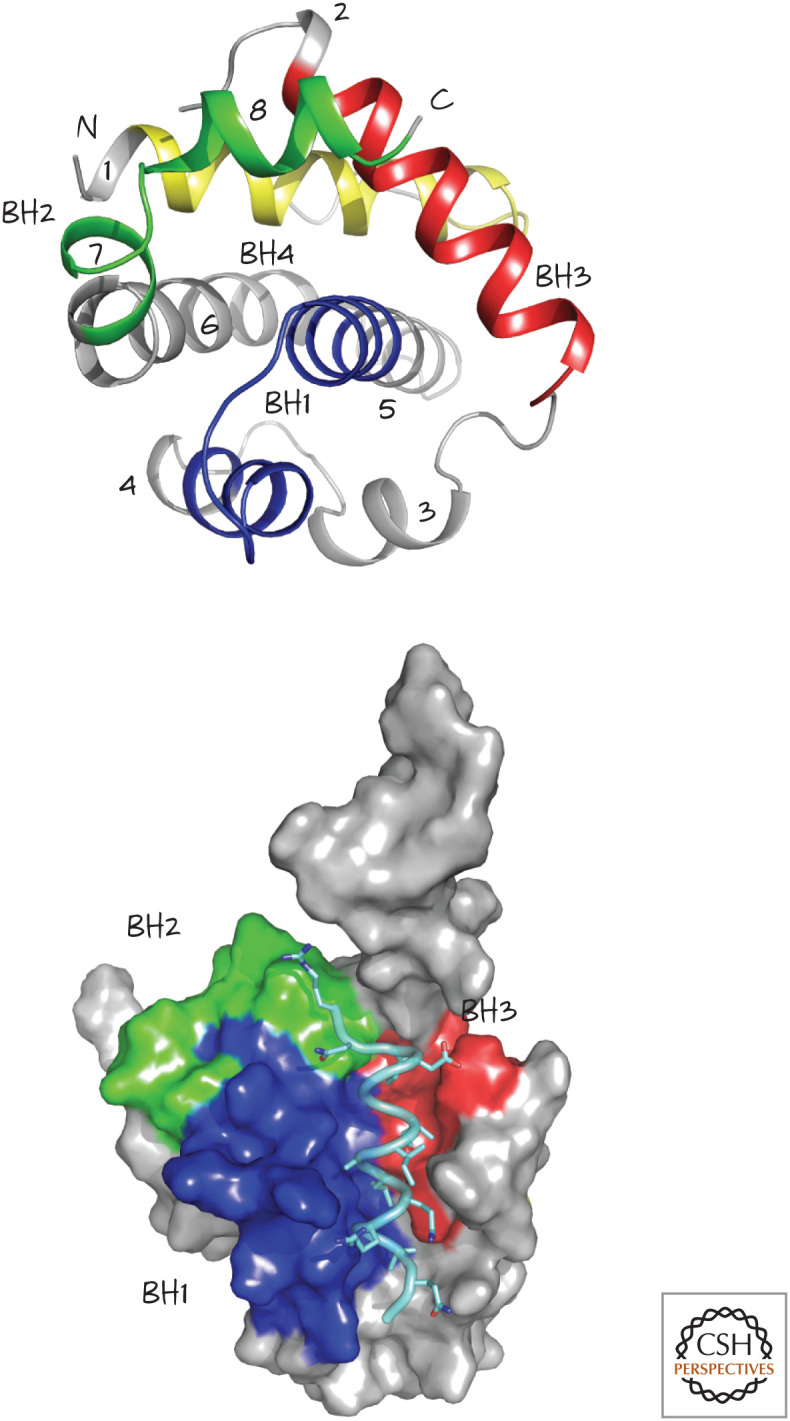
Structure of BCL-xL, a globular protein with eight α-helices (numbered 1–8, top). The four BCL-2 homology (BH) regions, BH1–BH4, are also shown. The structure on the bottom shows the groove formed by BH1, BH2, and BH3, bound to a BH3 peptide from BAK (pale blue). (Top, PDB 1MAZ [Muchmore et al. 1996]; bottom, PDB 1BXL [Sattler et al. 1997].)
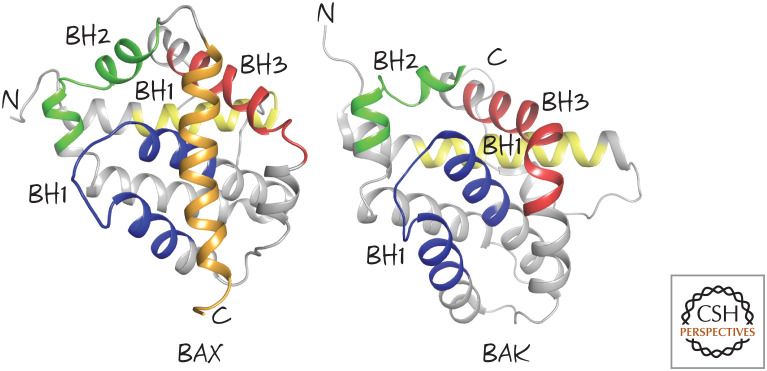
Effector BCL-2 family members BAX and BAK. The BCL-2 homology (BH) regions BH1, BH2, and BH3 are shown, as is the carboxy-terminal tail of BAX (gold). (Left, PDB 1F16 [Suzuki et al. 2000]; right, PDB 2IMS [Moldoveanu et al. 2006].)
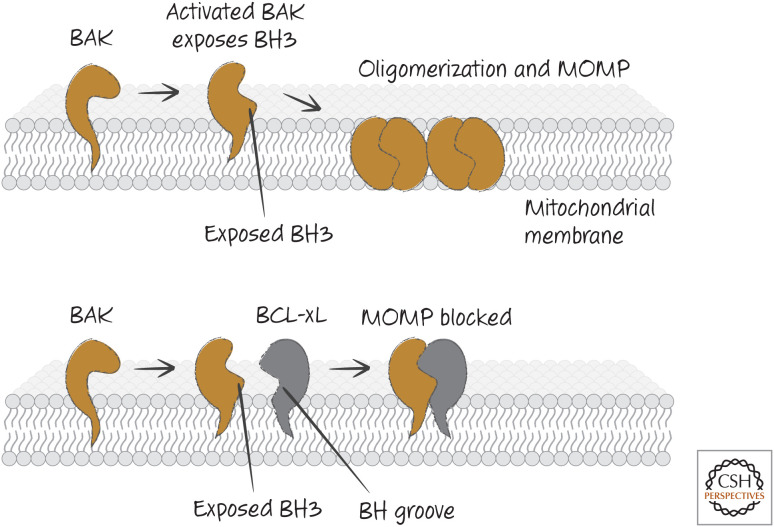
BAK activation and inhibition. When BAK is activated, it exposes its BH3 region and appears to create a BH groove. This allows BAK–BAK oligomerization (upper) or binding of anti-apoptotic BCL-2 proteins that block oligomerization (lower).
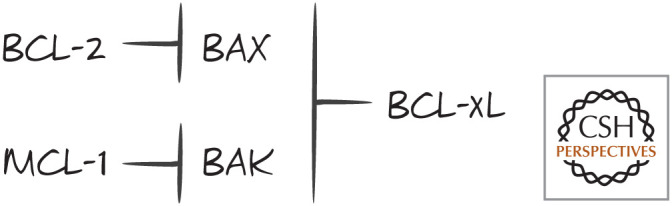
BAX/BAK specificity of anti-apoptotic BCL-2 proteins. The binding differences are relative, not absolute.
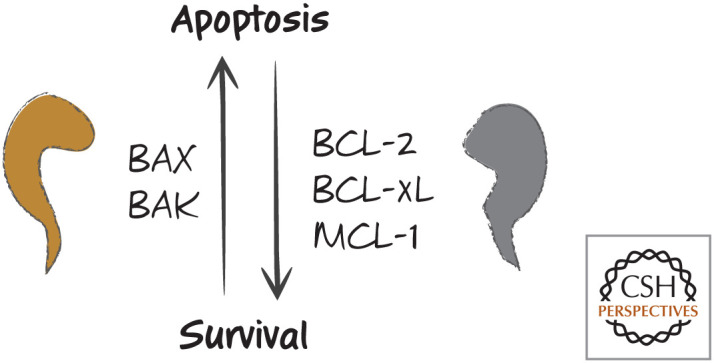
The simple rheostat model. An increase in BAX or BAK causes apoptosis, whereas an increase in BCL2, BCL-xL, or MCL-1 results in survival. Problems with this simple model include the specificities of anti-apoptotic proteins for binding to the pro-apoptotic effectors.
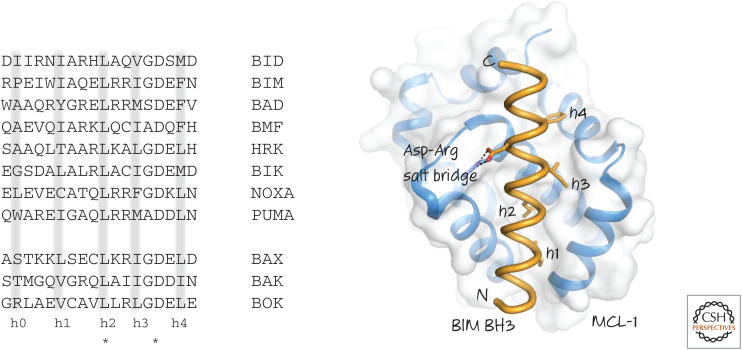
(Left) BH3 regions of several human BH3-only proteins. BH3 regions of BAX, BAK, and BOK are shown for comparison. Note the conserved leucine (L) and aspartate (D) residues (*). Hydrophobic residues (h0–h4) are often (but not always) present where indicated. (Right) The binding of the BH3 region of BIM to MCL-1. The hydrophobic residues and the conserved aspartate interact with the BH groove of MCL-1.
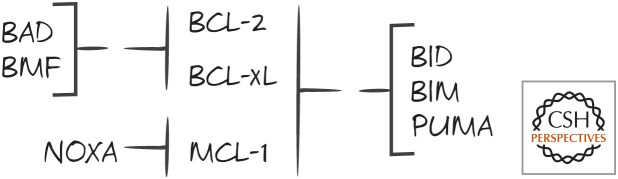
Specificities of some BH3-only proteins for binding to anti-apoptotic BCL-2 proteins Bcl-2, BCL-xL, and MCL-1.
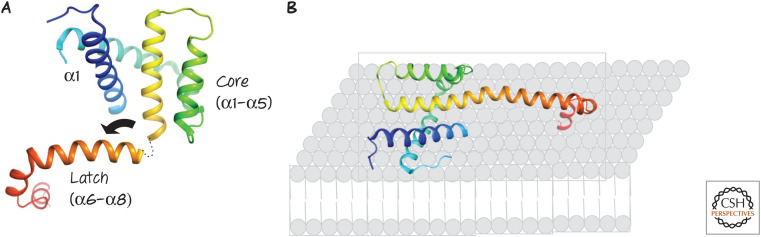
(A) Structure of activated BAX. Following activation, the “latch” of the protein (α6–α8) moves away from the core (α2–α5), ultimately straightening α5–α6, and (B) exposed hydrophobic residues in the protein presumably interact with the lipids of the outer mitochondrial membrane. Similar events occur during activation of BAK.
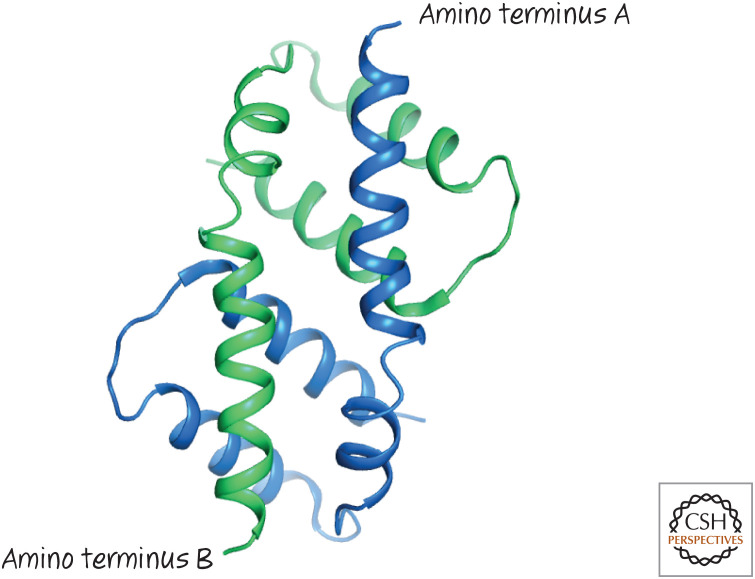
Activated BAX forms dimers by mutual BH3–groove interactions. The structure of the dimer formed by two BAX α2–α5 proteins (blue and green, respectively) showing the symmetrical binding of the BH3 from one in the groove of the other.
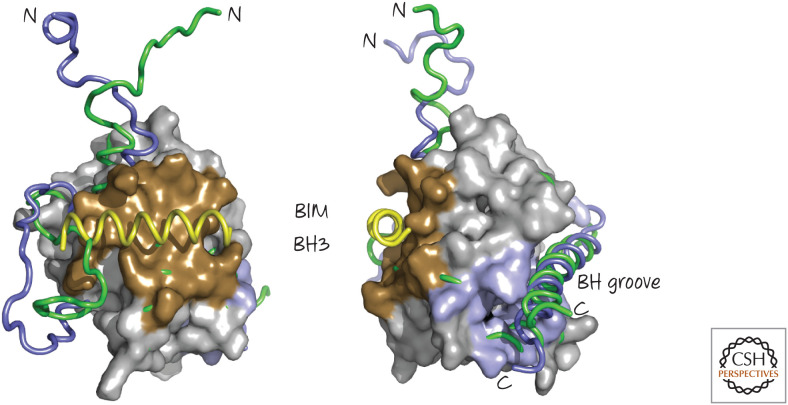
The BIM BH3 region binds to BAX and induces conformational changes. Two views are shown. A BIM BH3 peptide (yellow) binds to the “back” face of BAX (brown), opposite the BH groove, where it displaces a loop to cause several subtle rearrangements in BAX. Illustrated are regions of the free (green) and BIM-bound (blue) BAX that undergo conformational changes. (PDB 1F16 [Suzuki et al. 2000]; overlay, PDB 2K7W [Gavathiotis et al. 2008].)
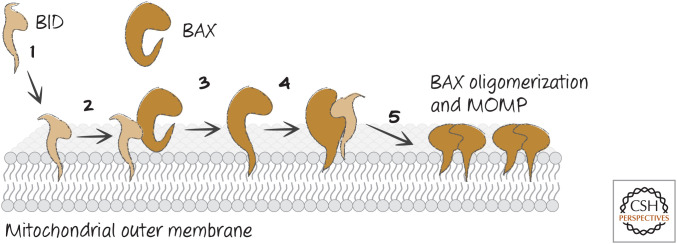
Order of events for BAX activation and MOMP. (1) Active BID binds very rapidly to the mitochondrial outer membrane, and then (2) BID binds to the back of BAX, whereupon (3) BAX inserts its α-helix 9 (α9) into the membrane. Then (4) BID binds to the BH groove of BAX, “unlatching” BAX and exposing its BH3, and finally (5) BAX oligomerizes by binding to additional, active BAX molecules, inducing MOMP.
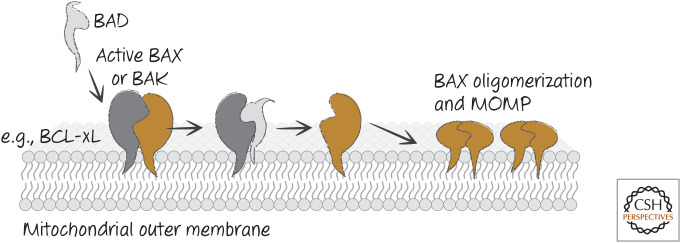
Neutralization model for BH3-only function. BH3-only proteins such as BAD bind to anti-apoptotic BCL-2 proteins (e.g., BCL-xL) to prevent or disrupt the binding of the latter to active BAX or BAK, and MOMP ensues.
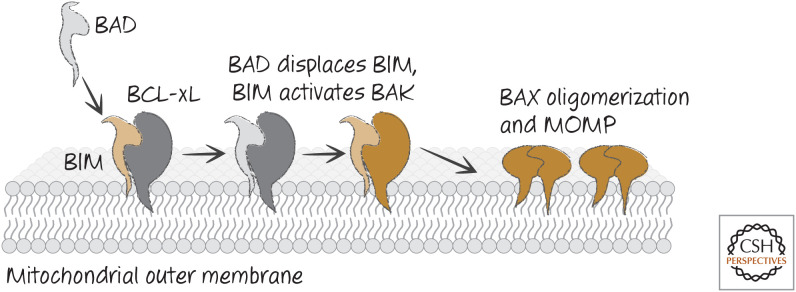
Direct activator/derepressor model of BH3-only function. Derepressor BH3-only proteins, such as BAD, bind to anti-apoptotic BCL-2 proteins, preventing or disrupting the binding of the latter to direct activators of BAX and BAK (such as BIM). BAX and BAK are then activated, and MOMP ensues.
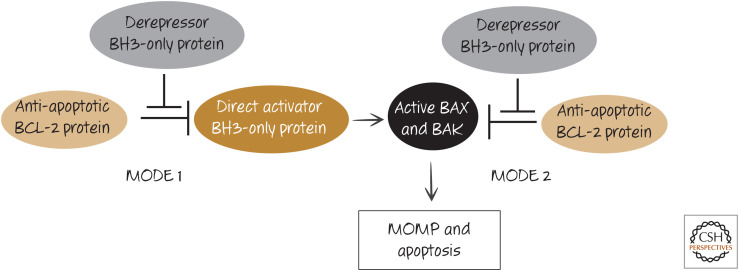
Two modes of action of anti-apoptotic BCL-2 proteins. Anti-apoptotic BCL-2 proteins can prevent apoptosis either by binding to BH3-only direct activator proteins (MODE 1) or by binding to active BAX or BAK (MODE 2). Additional BH3-only protein interactions can neutralize the function of the anti-apoptotic BCL-2 protein, allowing apoptosis to proceed. MODE 1 is more readily derepressed than MODE 2 (i.e., MODE 2 is functionally more stable).
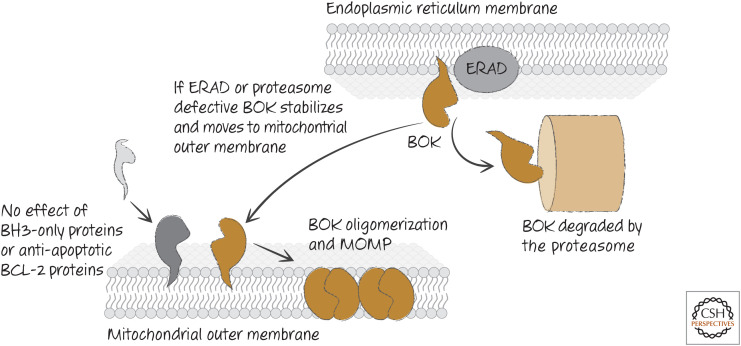
Regulation of BOK. BOK is not regulated by other BCL-2 proteins, but is controlled by endoplasmic reticulum–associated degradation (ERAD), which induces degradation of BOK. Disruption of ERAD or the degradation machinery allows BOK to accumulate and oligomerize on the outer mitochondrial membrane to cause mitochondrial outer membrane permeabilization (MOMP).
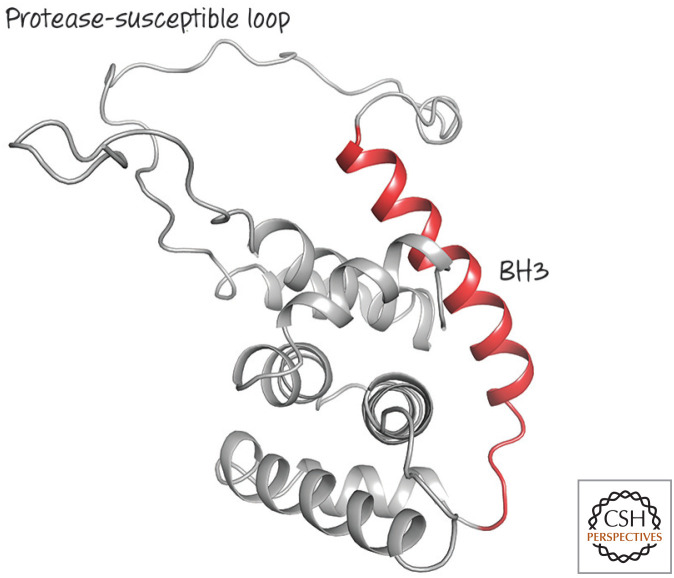
Structure of BID, a structured BH3-only protein with one of the most divergent BCL-2 cores. The BH3 region (red) is next to a protease-susceptible loop, the digestion of which is required for activation. (PDB 2BID [Chou et al. 1999].)
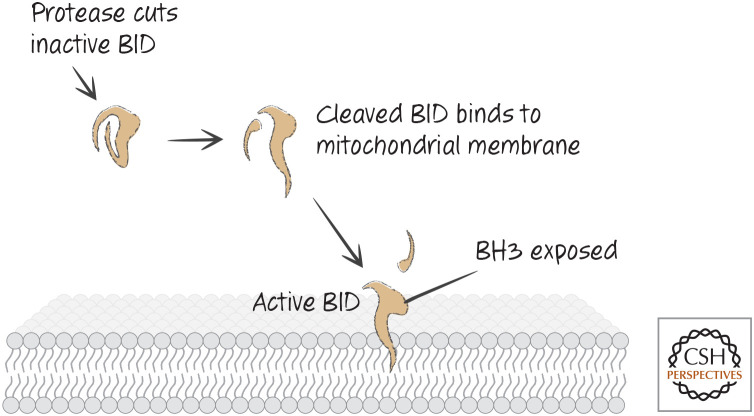
The pathway for cleavage and activation of BID.
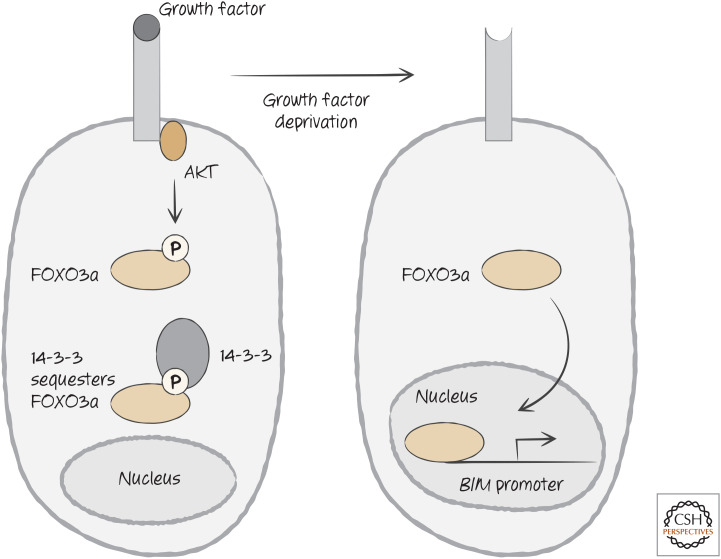
Growth factor signaling controls BIM expression through the sequestration of FOX3a, a transcription factor required for transcriptional activation of the promoter for the gene encoding BIM.
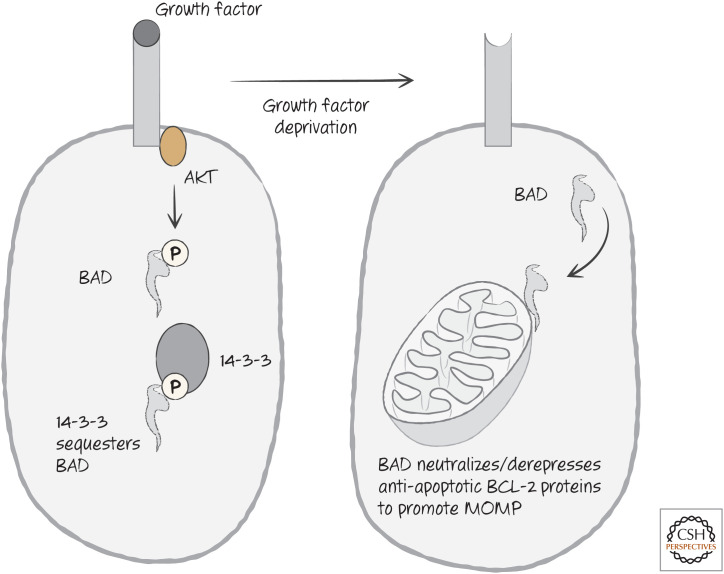
Growth factor signaling controls BAD function through the sequestration of BAD.
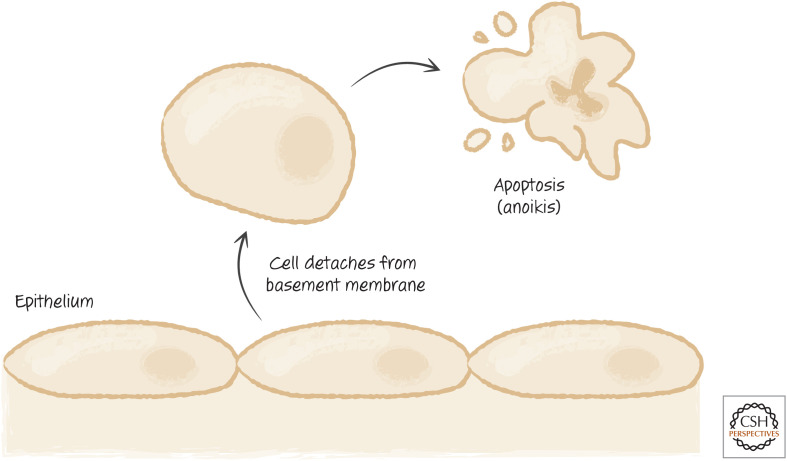
The pathway of anoikis allowing detached cells to be eliminated.
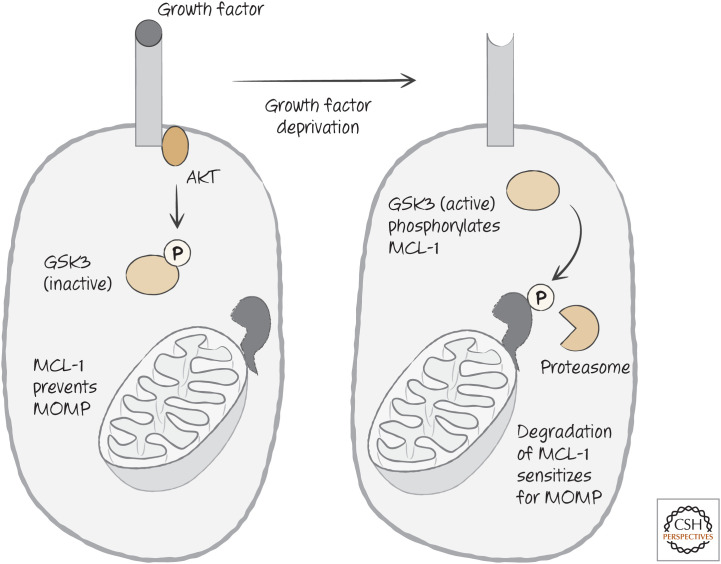
Growth factor receptor signaling regulates the stability of MCL-1, either preventing or enhancing mitochondrial outer membrane permeabilization (MOMP), according to the presence (left) or absence (right) of growth factors.

CED9 is a BCL-2 protein. The BH1–BH4 domains of CED9 and BCL2 are shown for comparison. Structural studies confirm that CED9 and BCL-2 are similar.
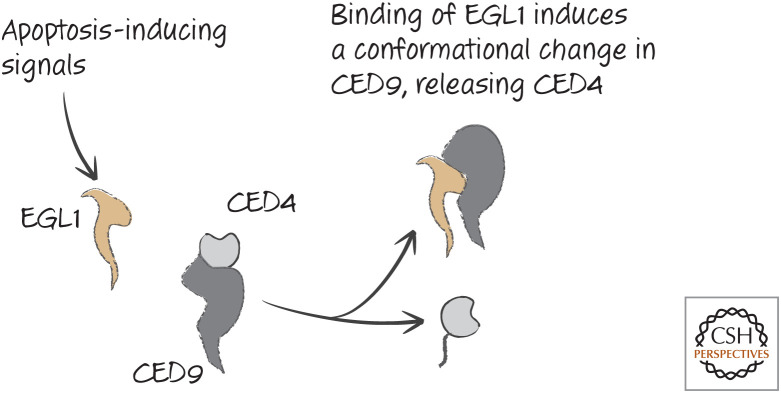
EGL1 functions to release CED4 from CED9.
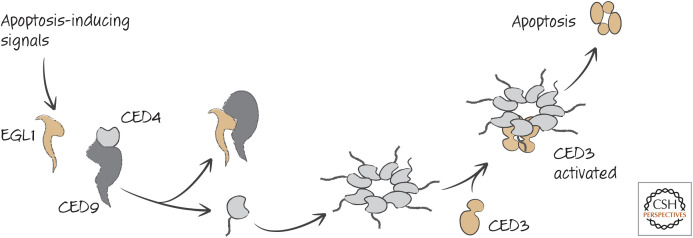
The action of participants in apoptotic signaling in nematodes.

Viral BCL-2 proteins. All are from human viruses except where indicated. Some of the BH regions are based on structural considerations despite low amino acid homology. (Reprinted from Hardwick et al. 2009, ©2009 with permission from Elsevier.)
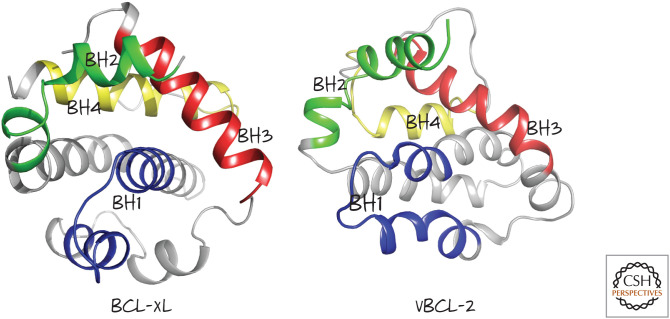
Structures of mammalian BCL-xL and Kaposi sarcoma virus vBCL-2 showing the arrangement of the BH1–BH4 regions. (Left, PDB 1MAZ [Muchmore et al. 1996]; right, PDB 1K3K [Huang et al. 2002].)
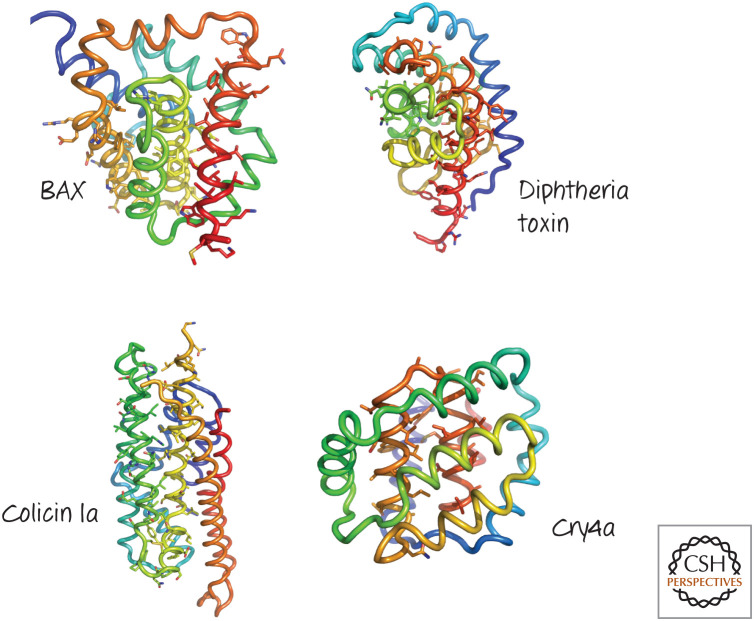
Structures of several pore-forming regions of bacterial toxins, compared with that of BAX. Several α-helical pore-forming toxins have a globular domain reminiscent of the BCL-2 core of BAX. The structures are colored blue to red from the amino to the carboxyl terminus, and the putative pore-forming helices are identified by their side-chain sticks. (Top left, PDB1MAZ [Muchmore et al.1996]; top right, PDB 1F0L [Choe et al. 1992]; lower left, PDB 1CII [Winer et al. 1997]; lower right, PDB 2C9K [Boonserm et al. 2006].)
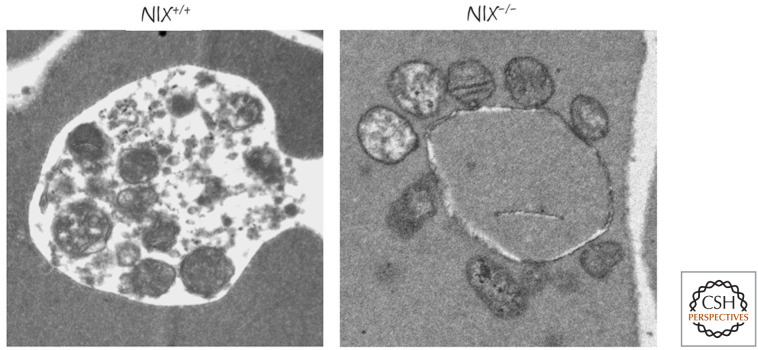
Mitochondria in NIX-deficient red blood cells. In developing wild-type red blood cells, mitochondria are removed by mitophagy (left), and these organelles are not present in the mature cells. In NIX-deficient mature red cells, mitochondria persist, many showing signs of damage (right). (Image courtesy of Paul A. Ney, MD, St. Jude Children's Research Hospital, Memphis, Tennessee.)
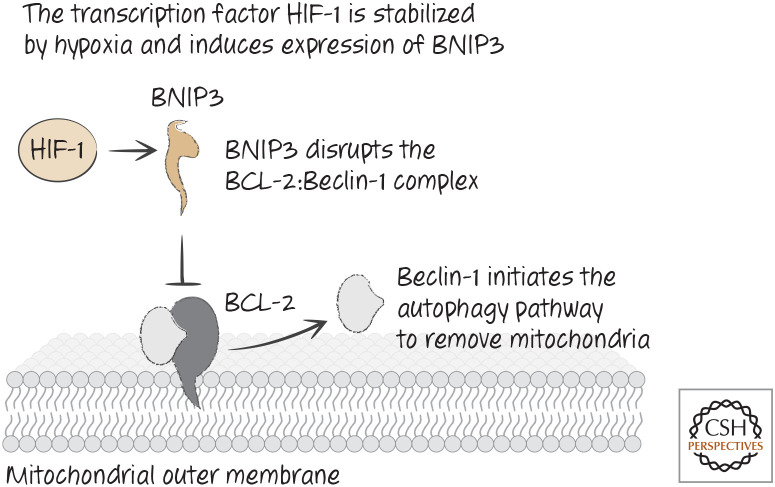
Hypoxia leads to stabilization of hypoxia-induced factor HIF and removal of mitochondria by autophagy.
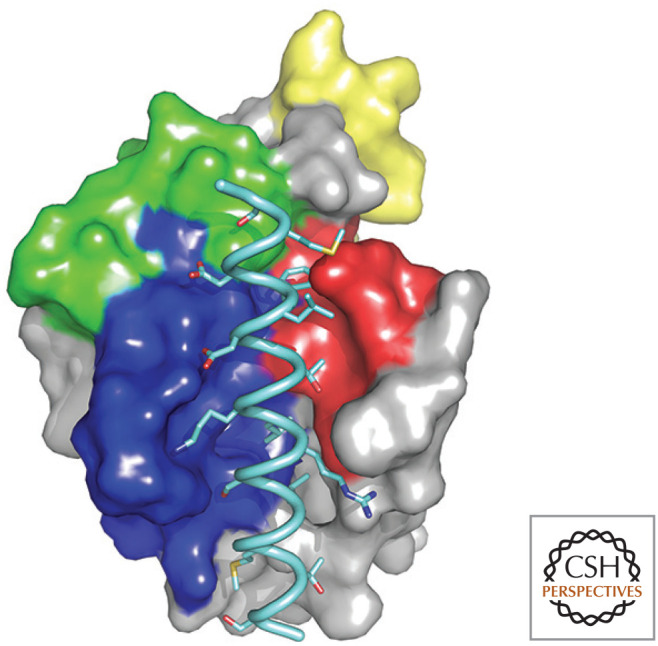
Beclin-1 BH3 region bound to BCL-xL. The BH regions of BCL-xL are colored as in Figure 4, and the BH3 peptide is pale blue. (PDB2P1L [Oberstein et al. 2007].)
References
-
- Green DR. 2022. a. Cell death and cancer. Cold Spring Harb Perspect Biol 10.1101/cshperspect.a041103 - DOI
FIGURE CREDITS
Publication types
MeSH terms
Substances
LinkOut - more resources
Full Text Sources