. 2022 Jun 14;13(1):3433.
doi: 10.1038/s41467-022-30977-2.

Morphological pseudotime ordering and fate mapping reveal diversification of cerebellar inhibitory interneurons

Affiliations

Morphological pseudotime ordering and fate mapping reveal diversification of cerebellar inhibitory interneurons

Wendy Xueyi Wang et al. Nat Commun. .

Abstract

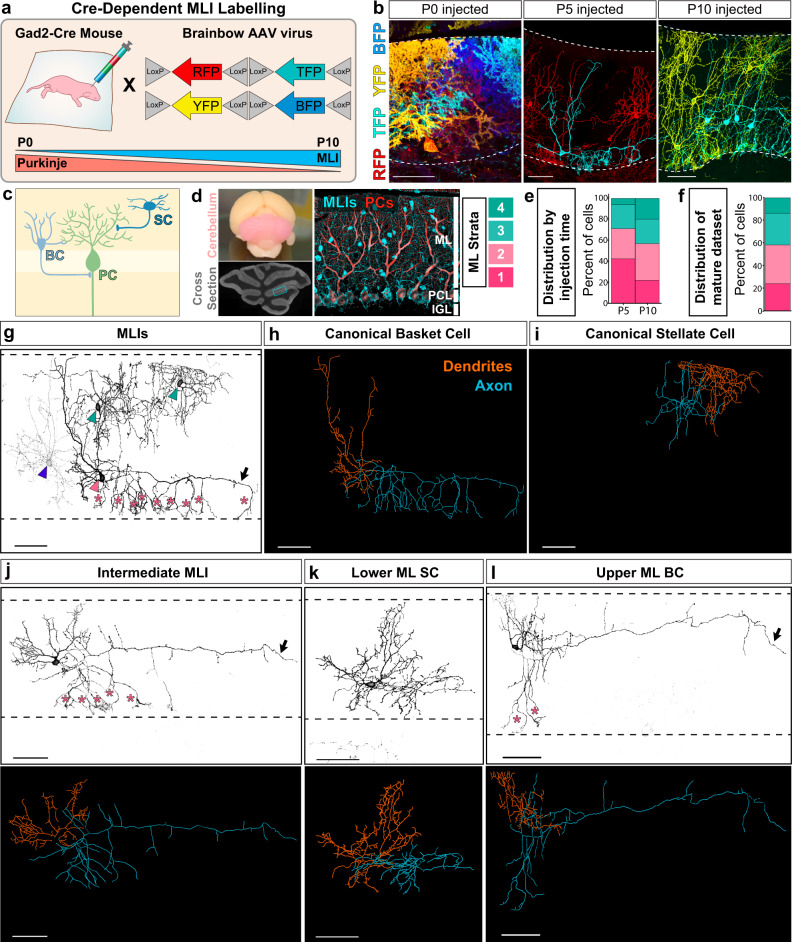
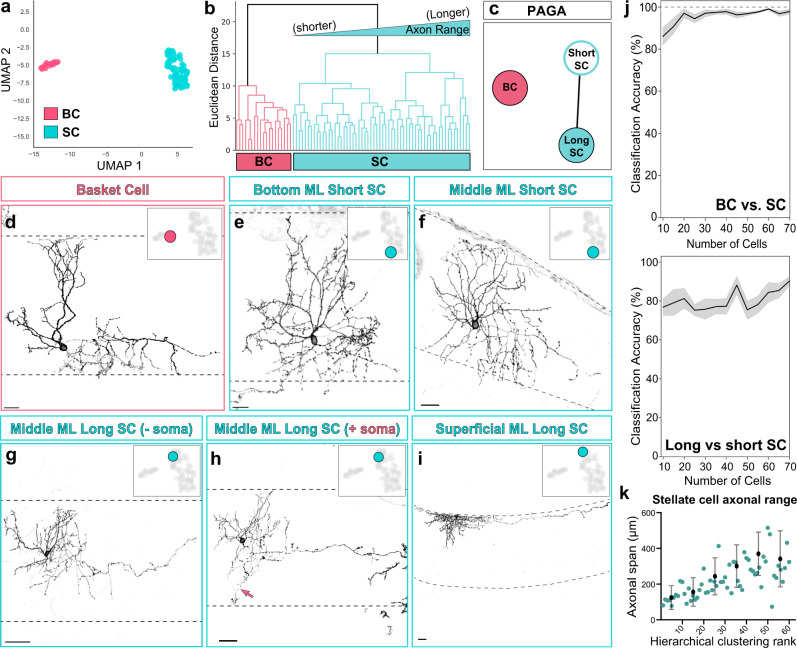
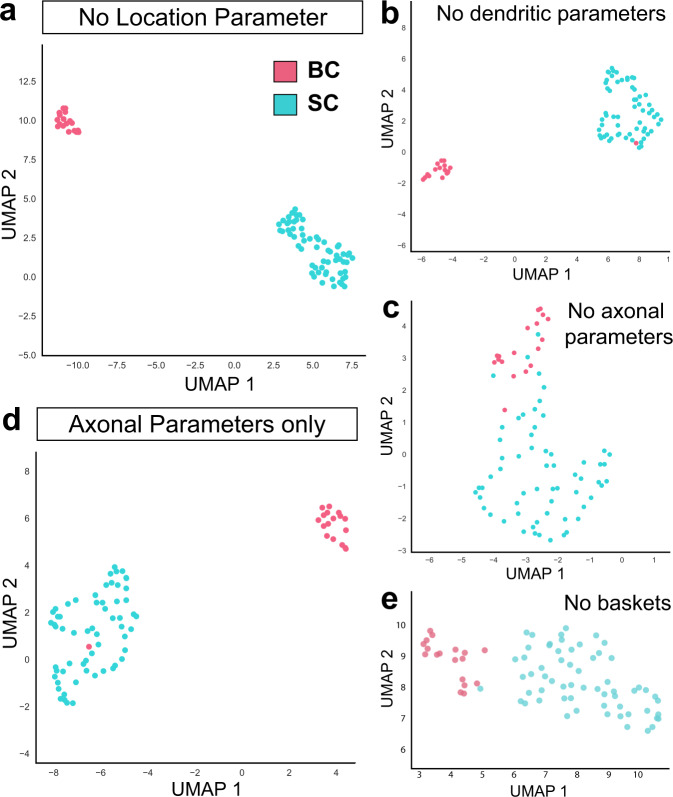
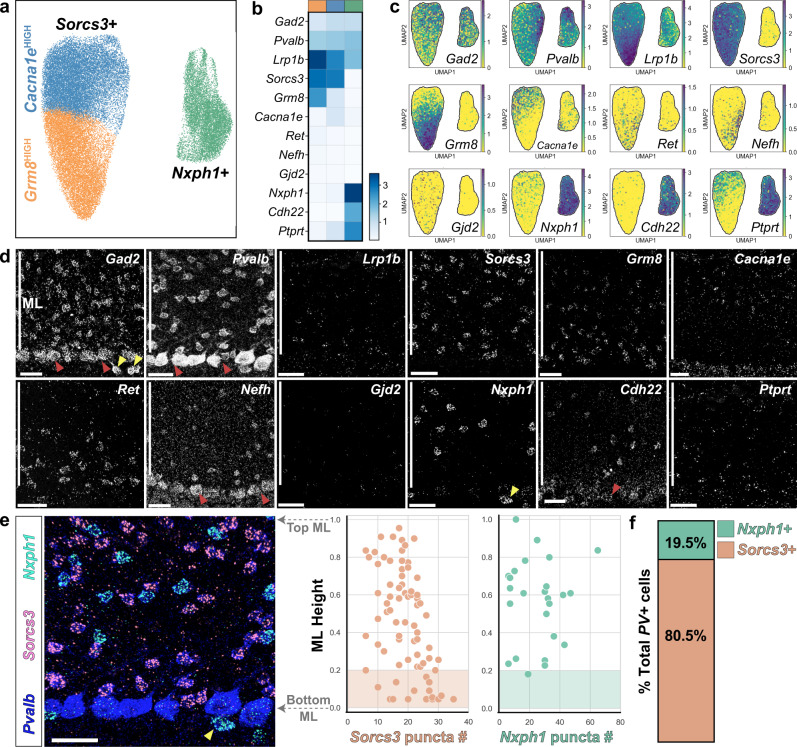
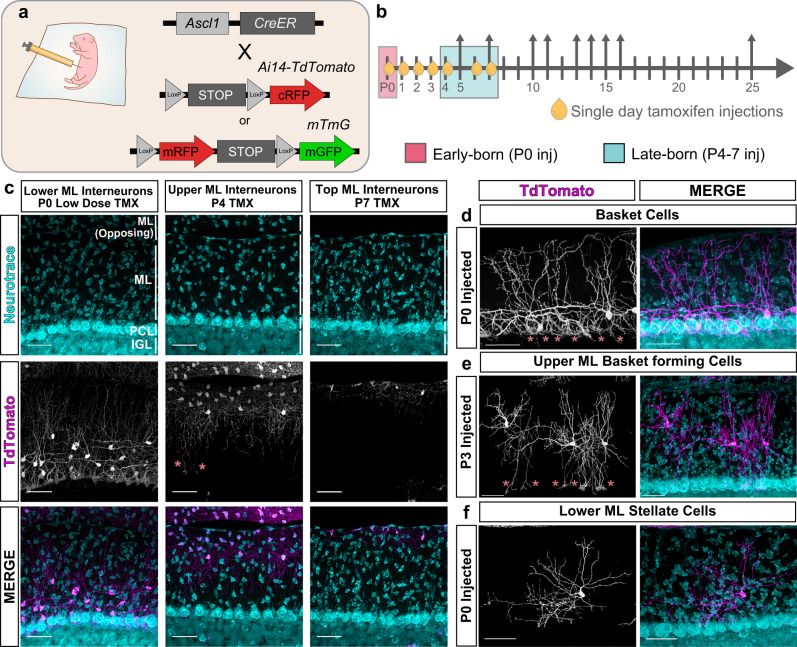
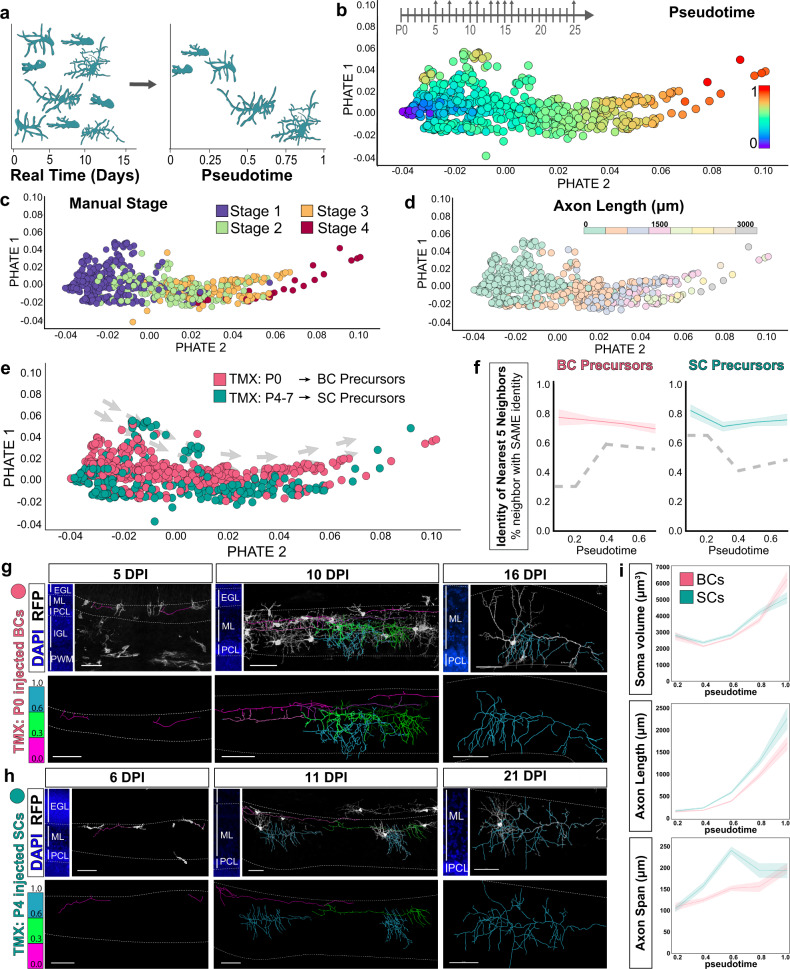
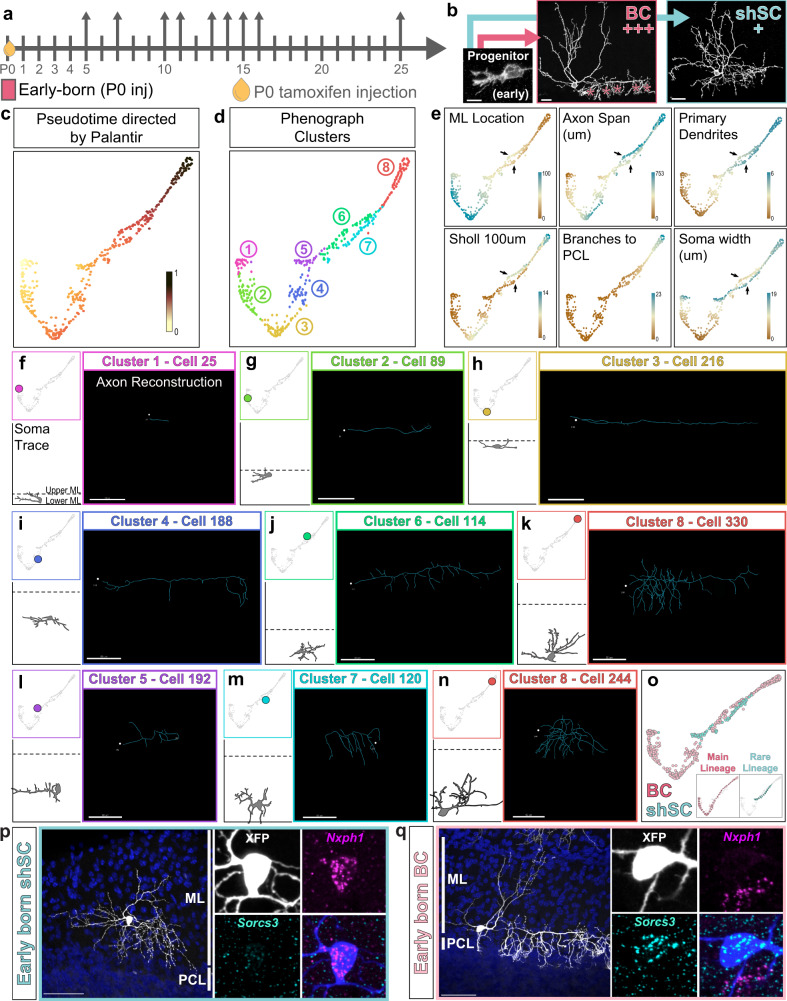
Understanding how diverse neurons are assembled into circuits requires a framework for describing cell types and their developmental trajectories. Here we combine genetic fate-mapping, pseudotemporal profiling of morphogenesis, and dual morphology and RNA labeling to resolve the diversification of mouse cerebellar inhibitory interneurons. Molecular layer interneurons (MLIs) derive from a common progenitor population but comprise diverse dendritic-, somatic-, and axon initial segment-targeting interneurons. Using quantitative morphology from 79 mature MLIs, we identify two discrete morphological types and presence of extensive within-class heterogeneity. Pseudotime trajectory inference using 732 developmental morphologies indicate the emergence of distinct MLI types during migration, before reaching their final positions. By comparing MLI identities from morphological and transcriptomic signatures, we demonstrate the dissociation between these modalities and that subtype divergence can be resolved from axonal morphogenesis prior to marker gene expression. Our study illustrates the utility of applying single-cell methods to quantify morphology for defining neuronal diversification.


Conflict of interest statement

The authors declare no competing interests.

Figures

Fig. 1
Fig. 1. A platform for labeling MLI morphologies in the cerebellum.
a Single MLI labeling with Cre-dependent Brainbow AAVs encoding multiple fluorescent proteins injected into Gad2-Cre mice between P0 to P10. b Cross-sections of mature cerebellar cortex show enriched labeling of Gad2-Cre positive subpopulations. AAV delivery at P0 predominantly labels Purkinje cells (PC); P5, lower MLIs; P10, upper MLIs. Dashed lines denote molecular layer (ML) boundaries. c Schematic of canonical innervation patterns of basket (BC, light blue) and stellate (SC, dark blue) cells residing in the lower and upper ML, respectively (adapted with permission from ref. ). d Mouse cerebellum (pink), and its cross-sectional morphology. ML outlined in cyan. Immunostaining of MLIs (anti-Parvalbumin (PV), cyan) shows distribution throughout the ML. PCs are co-labeled with PV (cyan) and calbindin (red). ML was divided into four strata to record the laminar position of labeled MLI soma. e Percent laminar distribution of AAV-labeled single MLIs. Representative images (b) and quantifications (e) are from at least three animals per injection time point. f Percent laminar distribution of the 79 mature single MLI reconstructions. gi Canonical MLI morphologies. g Inverted fluorescent image of four labeled MLIs. The lower MLI (pink arrowhead) displays canonical BC morphology, including axonal basket terminals targeting the PC somas and axon initial segments (AIS; asterisks). The upper MLIs (teal arrowhead) have canonical SC morphologies. The faintly labeled MLI (blue arrowhead) has SC morphological characteristics but resides within the lower ML. h Reconstruction of canonical BC and, i SC from panel g with dendritic (orange) and axonal arbor traces (blue). jl Representative images (top) and reconstructions (bottom) of MLIs showing mixtures of BC and SC characteristics. j MLI located in the middle ML with SC dendritic features and a long axon (arrow) with collaterals that reach the PC soma base or AIS (asterisks). k MLI in the lower ML with SC-like arbors. l MLI in the upper ML with a long axon (arrow) and two collaterals enveloping PC somas (asterisks). Images (gl) and quantifications (f) are from 79 cells, N = 9 animals. Scale bars are 50 µm.
Fig. 2
Fig. 2. Clustering of mature MLI morphologies reveals discrete and continuous heterogeneity.
a UMAP plot separates 79 mature MLI morphological reconstructions into discrete basket (BC, pink) and stellate cell (SC, teal) clusters. Each data point represents a single MLI based on morphometric measurements. b Hierarchical clustering separates MLIs into two BC (pink) and SC (teal) clades. Within the broad SC cluster, the dendrogram ordered MLIs from shorter to longer axonal range cells. c PAGA separates MLIs into discrete BC and SC clusters. SCs are subdivided into two nodes connected through an edge, denoting continuous variation in morphology. di Examples of MLIs and their locations within the UMAP manifold. ML boundaries are outlined by dashed lines. d MLI from the BC cluster displays canonical BC morphology. e An MLI at one pole of the SC cluster displays short-range axonal morphology and its soma resides within the lower ML. f An MLI plotted within similar coordinates of the UMAP manifold as e, displays short-range axonal morphology but resides within the middle ML. g An MLI at the opposite pole of the SC cluster displays long-range axonal morphology. h An MLI which resides within similar coordinates of the UMAP as g, extends descending PC soma-targeting axon collaterals (pink arrow at PC soma; axon terminal reaches the PC soma base). i An MLI located in the very superficial ML extends long axonal range collaterals. j Iterative clustering using random subsamples shows that MLI classification into BC/SC clades is robust, as cross-validation using as few as 20 subsampled cells replicates the BC/SC division. By similar measures, classification of SCs into long- and short-range subclades is not robust. Lines show means drawn from 20 trials for each sample size, with SEM represented by shaded regions. k Axonal span of SCs vary continuously from shorter-range to longer-range cells, ranked by hierarchical clustering rank. Error bars represent mean and SD of the data, n = 61 SCs in UMAP, 60 in hierarchical clustering; 18 BCs in UMAP, 19 in hierarchical clustering. Scale bars are 20 µm in df, 40 µm in gi.
Fig. 3
Fig. 3. Axonal information is necessary and sufficient for MLI morphological subtyping.
a UMAP plots of BC (pink) and SC (cyan) clusters following recursive elimination of morphometric parameters describing MLI location. b UMAP following elimination of dendritic parameters. c UMAP following elimination of axonal parameters. d UMAP with only six axonal parameters is sufficient for BC/SC clustering. e UMAP following elimination of PC soma terminal/weighted basket feature.
Fig. 4
Fig. 4. Clustering and in situ analyses of mature MLI transcriptional signatures reveal discrete and laminar organization of MLI t-types.
a UMAP showing 43,479 MLIs separating into two clusters (Sorcs3+ and Nxph1+) based on public single nuclei-extracted RNA sequencing data. The Sorcs3+ cluster subdivides into Grm8HIGH and Cacna1eHIGH subclusters. b MatrixPlot showing the scaled expression level for transcripts of interest among transcriptional subtypes, Sorcs3+; Grm8HIGH (orange column), Sorcs3+; Cacna1eHIGH (blue column), and Nxph1+ (green column). c Transcript levels projected onto UMAP. d smFISH images of MLI transcripts within the cerebellar cortex (ML marked by white bars). Red and yellow arrowheads mark Purkinje cells and Purkinje layer interneurons, respectively. N = 2–6 animals. e Left, three-color smFISH for Pvalb (blue), Sorcs3 (magenta), and Nxph1 (cyan). Sorcs3 and Nxph1 are expressed in non-overlapping cells within the ML. Nxph1+ cells observed below the Purkinje cell layer are likely Purkinje layer interneurons (yellow arrowheads). Right, MLI smFISH quantification and mapping show that Sorcs3+ cells are distributed throughout ML while Nxph1+ cells are enriched in the upper 80% of the ML (n = 95 total MLIs from two animals). f Pvalb+ cells are either Nxph1+ (green) or Sorcs3+ (orange). Scale bars are 30 µm.
Fig. 5
Fig. 5. Morphologically defined MLI types do not align with transcriptionally defined signatures but can be described by marker combinations.
ac morFISH co-staining of single fluorescently-labeled MLIs with smFISH for t-type markers Sorcs3, Nxph1, Grm8, or Cacna1e. Each panel (i.e. a, a′, a″) shows three MLI soma from separate morFISH co-stainings. a m-type basket cell expresses Sorcs3 but not Nxph1, and expresses high Grm8 and low Cacna1e (a′, a″). b m-type stellate cells with long-range axons express Sorcs3 but not Nxph1, and express Cacna1e and lower Grm8 (b′, b″). c m-type stellate cells with short-range axons express Nxph1 and lower Sorcs3; Grm8 is absent but low levels of Cacna1e are detected (c′, c″). d Violin plot summarizing smFISH puncta quantifications for markers within morphologically defined BCs (left, n = 16 cells), long-range SCs (middle, n = 24 cells), and short-range SCs (right, n = 5 cells). Note the Sorcs3+; Grm8HIGH; Cacna1eLOW pattern among the BCs, the Sorcs3+; Grm8LOW; Cacna1eHIGH among m-type long SCs, and the exclusion of Grm8 in short-range SCs (c′). e SCs with long-range axons in the upper ML are either Sorcs3+ or Nxph1+. Images and quantifications from ae are from four animals. f Comparison of MLI transcriptional and morphological identities, as assessed through PAGA. By transcriptional signatures, continuous heterogeneity is present between long-range BCs (orange) and SCs (blue), while short-range SCs (teal) are discretely separated from both transcriptional subtypes. By morphological signatures, there is a discrete division between BCs and SCs, with continuous heterogeneity spanning long-range and short-range SCs. g Schematic summarizes the expression patterns of t-type transcriptional markers among m-type MLIs. Scale bars are 35 µm in ad; 20 µm in e; 5 µm in inset, a′, a″–c′, c″.
Fig. 6
Fig. 6. Spatial-temporal analysis of markers show that MLI t-type identities appear late in development.
a Top, four-color smFISH image for MLI t-type markers Sorcs3, Nxph1, Grm8, and Cacna1e, in cerebellar cortex. Bottom, single-cell smFISH spot quantification for each transcript within segmented cell boundaries. b UMAP clustering using smFISH RNA data for 232 P55 MLIs. c Projection of ML locations, and d transcript levels for each cell onto the P55 UMAP plot. The Sorcs3+ cluster contains two domains: cells within the orange subcluster are located in the lower ML and express high Grm8; cells in the blue subcluster are enriched within the mid-upper ML and show graded Grm8 and Cacna1e. Cells within the green cluster are located lower-mid to high ML and express Nxph1. e UMAP clustering using smFISH RNA data for 126 P17 MLIs. f ML locations, and g transcript levels for each cell projected onto the P17 UMAP manifold. h Representative smFISH image for P55 MLIs showing Sorcs3 (cyan) and Cacna1e (right, magenta), and another with Nxph1 (green). i smFISH image for P17 MLIs showing co-expression of Cacna1e and Grm8 (top cell, red), and co-expression of Nxph1, Grm8, and Cacna1e (bottom cell). j Violin plot summarizing the transcript levels of individual markers within each smFISH-marker-defined subcluster for P17 (unfilled bars) and P55 data (filled bars). Images and quantifications for P17 data are: n = 126 cells, two animals; P55 data: 232 cells, two animals. Nxph1+ t-type: p = 0.0004 (P17 vs. P55 Sorcs3 expression); p < 0.00001 (Grm8); p < 0.00001 (Cacna1e). Sorcs3+; Grm8HIGH t-type: p = 0.000022 (Nxph1); p < 0.00001 (Cacna1e). Sorcs3+; Cacna1eHIGH t-type: p < 0.00001 (Nxph1); 0.000045 (Sorcs3); 0.0012 (Grm8); <0.00001 (Cacna1e). Means of two groups were compared using the two-tailed Mann-Whitney nonparametric test. k smFISH image of P10 coronal cerebellum for both MLI t-type markers (Sorcs3 in cyan, Nxph1 in magenta) and maturity markers (Pvalb in green, Pax2 in red). Sorcs3 and Nxph1 RNA are absent within migratory Pax2+ MLIs, but are expressed within post-migratory Pvalb+ cells. l morFISH confirms that Sorcs3 is not observed within cells with migratory morphology (N = 2 animals). Scale bars are 5 µm in h and i, 35 µm in k and l.
Fig. 7
Fig. 7. Birthdate-dependent targeting of morphological MLI subtypes by Ascl1-CreER.
a MLI labeling strategy by tamoxifen (TMX) inducible Ascl1-CreERT2 and fluorescent Cre reporters, Ai14-TdTomato (cytosolic) or mTmG (membrane-targeted). b Schematic for TMX-induced subtype-enriched MLI labeling, with postnatal time points of single dose TMX injections (oil droplets) and collection (arrows). Injection at P0 predominantly labels BC populations (early-born, pink), while P4-7 injections label SCs in the upper ML (late-born, teal). c Confocal images of cerebellar sections from P25 Ascl1-CreER; Ai14-TdTomato mice with TMX induction at P0, P4, or P7. d P0-induced BCs in the lower ML. e P3-induced SCs in the mid-upper ML with descending basket terminals. Pink asterisks denote basket formations enveloping PC soma in ce. f P0-induced non-basket forming SC in the lower ML. Representative images were taken at P25. N = 3–5 animals per injection time point (cf). Scale bars are 50 µm.
Fig. 8
Fig. 8. PHATE trajectory inference reveals divergent m-type MLI identities during axonogenesis.
a Schematic depicting pseudotime trajectory inference. Ordering cells and their maturation by animal age (left) is complicated by the developmental variability within any given time point. Pseudotime orders snapshots of developing neurons by morphological maturity (right). b PHATE-generated pseudotime ordering of 732 developing MLI morphologies. Each data point represents the developmental morphometry of one MLI reconstruction and color-coded by pseudotime stage. c Validation of PHATE ordering by projecting expert-directed maturity for each cell. d Projection of total axonal lengths onto PHATE manifold. e Projection of inferred MLI identity based on TMX-induced lineage tracing: BC, early-born identity (P0 TMX; n = 423 cells; pink) or SC, late-born identity (P4–P7 TMX; n = 309 cells; teal) from N = 32 mice. f Nearest 5 neighbors were obtained for each cell in the PHATE coordinate space. Proportion of neighbors with the same identity were plotted for BC (left) and SC (right) m-type identities. Line plot shows mean with shaded lines for SEM. Dashed gray line represents the null distribution within each pseudotime bin. For pseudotime 0–0.2: p < 0.0001 (BCs) and p < 0.05 (SCs); 0.2–0.4: p < 0.01 (BCs) and p < 0.001 (SCs); 0.4–0.6: p < 0.05 (BCs) and p < 0.0001 (SCs); 0.6–0.8: p < 0.001 (BCs) and p < 0.0001 (SCs) based on one-way t-test. g Confocal images show progression of axon morphogenesis of P0-injected RFP-labeled MLIs (greyscale) at 5, 10, 16 days post injection (DPI). Cerebellar layers are marked by DAPI (blue, left). Axon arbor reconstructions are colorized based on the cell’s PHATE pseudotime maturity (magenta cells, 0–0.29; green cells, 0.3–0.59; teal cells, 0.6+). h Pseudotime annotation of late-born MLIs, similar to g. i Line plots of individual morphometric measurements along pseudotime show differences in soma volume, axon length and horizontal axon span between BC- and SC-fated populations (mean ± 95% CI). Scale bars are 50 µm. EGL external granule layer, PWM prospective white matter.
Fig. 9
Fig. 9. Pseudotime ordering indicates divergent early-born MLI populations.
a Scheme for the TMX induction (P0, oil droplet) and collection (arrows) of early-born MLIs. b Summary for the mature morphology and identities of P0 TMX labeled MLIs, based on Ascl1-CreER fate mapping in Fig. 7. Most P0-labeled MLIs mature into m-type BCs (+++) with smaller numbers of lower ML short axonal range SCs (shSCs, +). c Palantir-generated pseudotime ordering of early-born MLIs (n = 423 cells). d Phenograph-generated division of the axonal dataset into eight clusters that reflect different morphological stages. e Heatmap representation of single morphometric parameters corresponding to Palantir-ordered MLIs. Arrows highlight differences between the BC and early-born SC trajectories. BCs occupy higher positions within the ML during migration (ML location) with axons that span a greater distance (axon span and Sholl at 100 µm). fn Examples of single MLI morphologies plotted within each cluster 1–8. Top left, position of cell in pseudotime trajectory. Bottom left, Camera Lucida illustration of cell soma and dendrites, positioned to scale by ML location, to validate progressive maturation of cells. Right, Axonal reconstruction with soma outlined by white dot. Representative examples of the BC morphogenesis trajectory are shown in fk. Representative examples of the short-range SC morphogenesis trajectory are shown in ln. o Inferred pseudotime trajectories for early-born MLIs. BCs form the main lineage, highlighted in pink, while short-range early-born SCs form a rare lineage, teal. p morFISH co-staining of P0-induced MLIs in Ascl1-CreER; Ai14-TdTomato mice confirm labeling of short-range Nxph1+ SCs in the lower ML (magenta), and q Sorcs3+ basket cells (cyan). n = 3 cells (p) and 16 cells (q) from four animals. Scale bars are 50 µm.

Similar articles

Cited by

References

    1. Zeng H, Sanes JR. Neuronal cell-type classification: challenges, opportunities and the path forward. Nat. Rev. Neurosci. 2017;18:530–546. doi: 10.1038/nrn.2017.85. - DOI - PubMed
    1. Cembrowski MS, Spruston N. Heterogeneity within classical cell types is the rule: lessons from hippocampal pyramidal neurons. Nat. Rev. Neurosci. 2019;20:193–204. doi: 10.1038/s41583-019-0125-5. - DOI - PubMed
    1. Geirsdottir L, et al. Cross-species single-cell analysis reveals divergence of the primate microglia program. Cell. 2019;179:1609–1622.e16. doi: 10.1016/j.cell.2019.11.010. - DOI - PubMed
    1. Lefebvre JL, Sanes JR, Kay JN. Development of dendritic form and function. Annu. Rev. Cell Dev. Biol. 2015;31:741–777. doi: 10.1146/annurev-cellbio-100913-013020. - DOI - PubMed
    1. Trapnell C, et al. The dynamics and regulators of cell fate decisions are revealed by pseudotemporal ordering of single cells. Nat. Biotechnol. 2014;32:381–386. doi: 10.1038/nbt.2859. - DOI - PMC - PubMed

Publication types

Grants and funding

LinkOut - more resources