

Implementing the reuse of public DIA proteomics datasets: from the PRIDE database to Expression Atlas
- PMID: 35701420
- PMCID: PMC9197839
- DOI: 10.1038/s41597-022-01380-9
Implementing the reuse of public DIA proteomics datasets: from the PRIDE database to Expression Atlas
Abstract
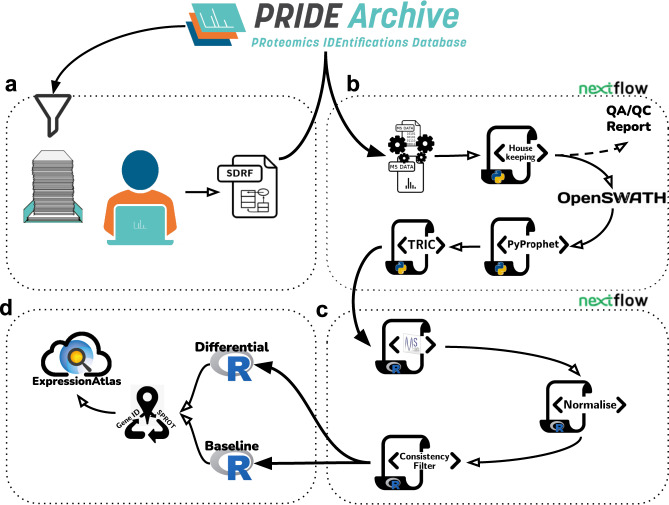
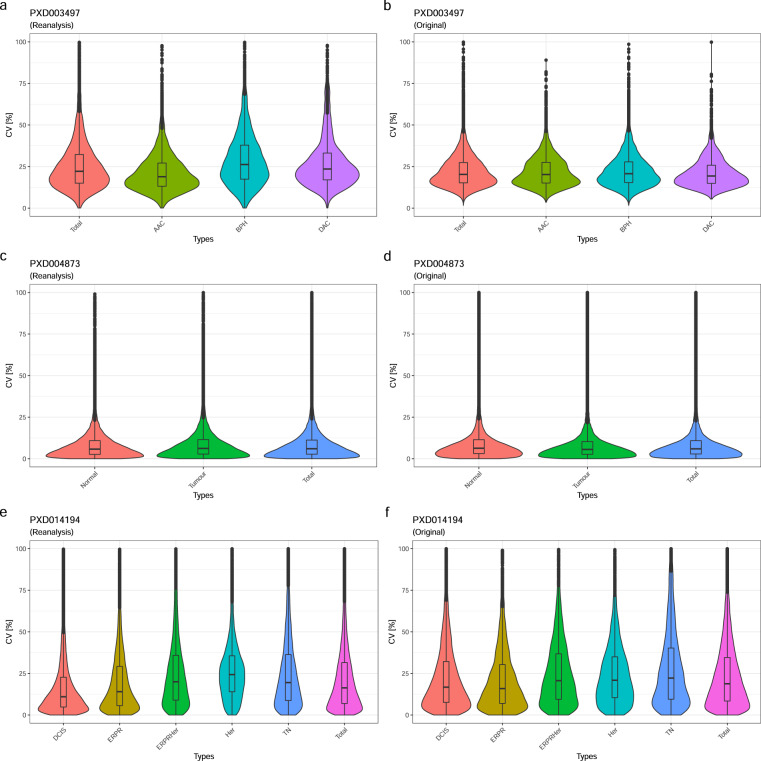
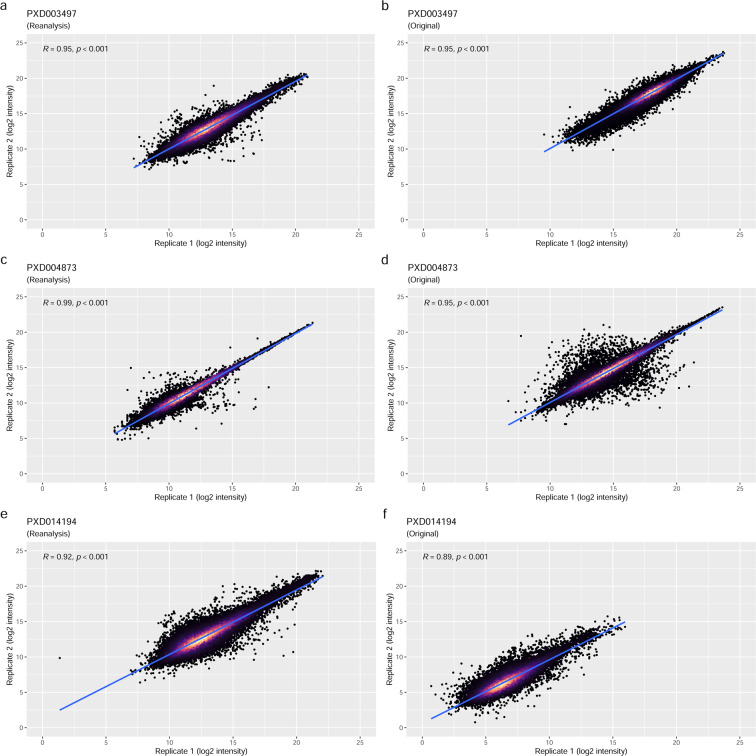
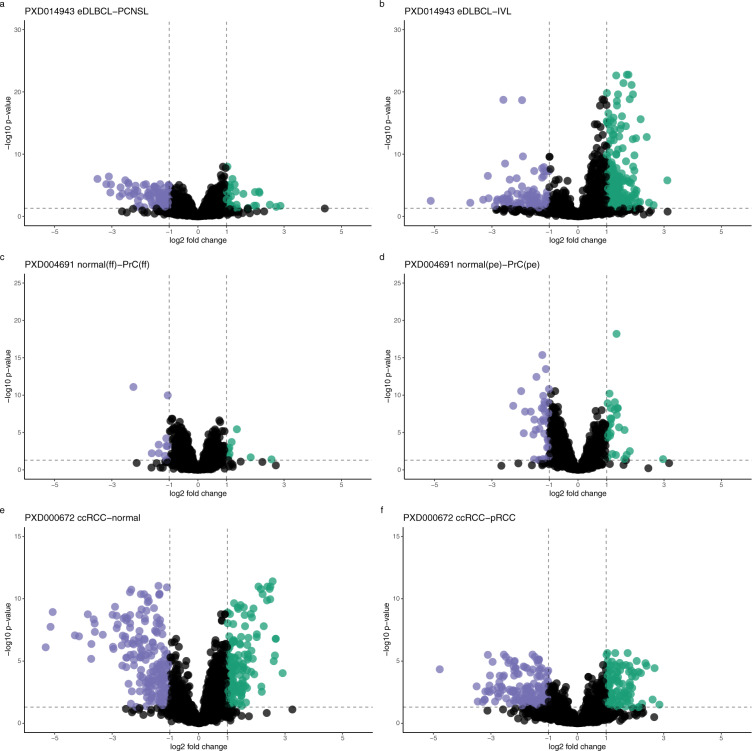
The number of mass spectrometry (MS)-based proteomics datasets in the public domain keeps increasing, particularly those generated by Data Independent Acquisition (DIA) approaches such as SWATH-MS. Unlike Data Dependent Acquisition datasets, the re-use of DIA datasets has been rather limited to date, despite its high potential, due to the technical challenges involved. We introduce a (re-)analysis pipeline for public SWATH-MS datasets which includes a combination of metadata annotation protocols, automated workflows for MS data analysis, statistical analysis, and the integration of the results into the Expression Atlas resource. Automation is orchestrated with Nextflow, using containerised open analysis software tools, rendering the pipeline readily available and reproducible. To demonstrate its utility, we reanalysed 10 public DIA datasets from the PRIDE database, comprising 1,278 SWATH-MS runs. The robustness of the analysis was evaluated, and the results compared to those obtained in the original publications. The final expression values were integrated into Expression Atlas, making SWATH-MS experiments more widely available and combining them with expression data originating from other proteomics and transcriptomics datasets.
© 2022. The Author(s).
Conflict of interest statement
The authors declare no competing interests.
Figures

Similar articles
-
The PRIDE database resources in 2022: a hub for mass spectrometry-based proteomics evidences.Nucleic Acids Res. 2022 Jan 7;50(D1):D543-D552. doi: 10.1093/nar/gkab1038. Nucleic Acids Res. 2022. PMID: 34723319 Free PMC article.
-
Ibaqpy: A scalable Python package for baseline quantification in proteomics leveraging SDRF metadata.J Proteomics. 2025 Jun 15;317:105440. doi: 10.1016/j.jprot.2025.105440. Epub 2025 Apr 21. J Proteomics. 2025. PMID: 40268243
-
Data-Independent Acquisition Peptidomics.Methods Mol Biol. 2024;2758:77-88. doi: 10.1007/978-1-0716-3646-6_4. Methods Mol Biol. 2024. PMID: 38549009
-
Acquisition and Analysis of DIA-Based Proteomic Data: A Comprehensive Survey in 2023.Mol Cell Proteomics. 2024 Feb;23(2):100712. doi: 10.1016/j.mcpro.2024.100712. Epub 2024 Jan 3. Mol Cell Proteomics. 2024. PMID: 38182042 Free PMC article. Review.
-
Data-Independent Acquisition Mass Spectrometry-Based Proteomics and Software Tools: A Glimpse in 2020.Proteomics. 2020 Sep;20(17-18):e1900276. doi: 10.1002/pmic.201900276. Epub 2020 May 19. Proteomics. 2020. PMID: 32275110 Review.
Cited by
-
Integrated view and comparative analysis of baseline protein expression in mouse and rat tissues.PLoS Comput Biol. 2022 Jun 17;18(6):e1010174. doi: 10.1371/journal.pcbi.1010174. eCollection 2022 Jun. PLoS Comput Biol. 2022. PMID: 35714157 Free PMC article.
-
The PRIDE database resources in 2022: a hub for mass spectrometry-based proteomics evidences.Nucleic Acids Res. 2022 Jan 7;50(D1):D543-D552. doi: 10.1093/nar/gkab1038. Nucleic Acids Res. 2022. PMID: 34723319 Free PMC article.
-
Computational and Systems Biology Advances to Enable Bioagent Agnostic Signatures.Health Secur. 2024 Mar-Apr;22(2):130-139. doi: 10.1089/hs.2023.0076. Epub 2024 Mar 13. Health Secur. 2024. PMID: 38483337 Free PMC article. No abstract available.
-
Integrated View of Baseline Protein Expression in Human Tissues.J Proteome Res. 2023 Mar 3;22(3):729-742. doi: 10.1021/acs.jproteome.2c00406. Epub 2022 Dec 28. J Proteome Res. 2023. PMID: 36577097 Free PMC article.
-
PM2.5, component cause of severe metabolically abnormal obesity: An in silico, observational and analytical study.Heliyon. 2024 Apr 3;10(7):e28936. doi: 10.1016/j.heliyon.2024.e28936. eCollection 2024 Apr 15. Heliyon. 2024. PMID: 38601536 Free PMC article.
References
MeSH terms
Grants and funding
LinkOut - more resources
Full Text Sources
Molecular Biology Databases
