. 2022 Jun 14;13(1):3416.
doi: 10.1038/s41467-022-31147-0.

Influenza A virus undergoes compartmentalized replication in vivo dominated by stochastic bottlenecks

Affiliations

Influenza A virus undergoes compartmentalized replication in vivo dominated by stochastic bottlenecks

Katherine A Amato et al. Nat Commun. .

Abstract

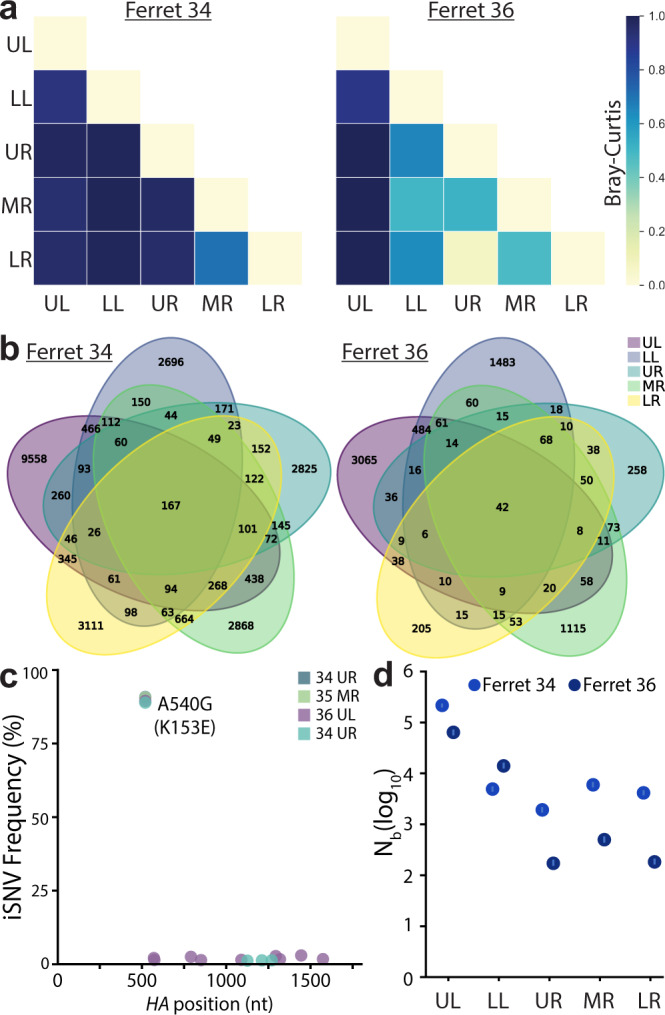
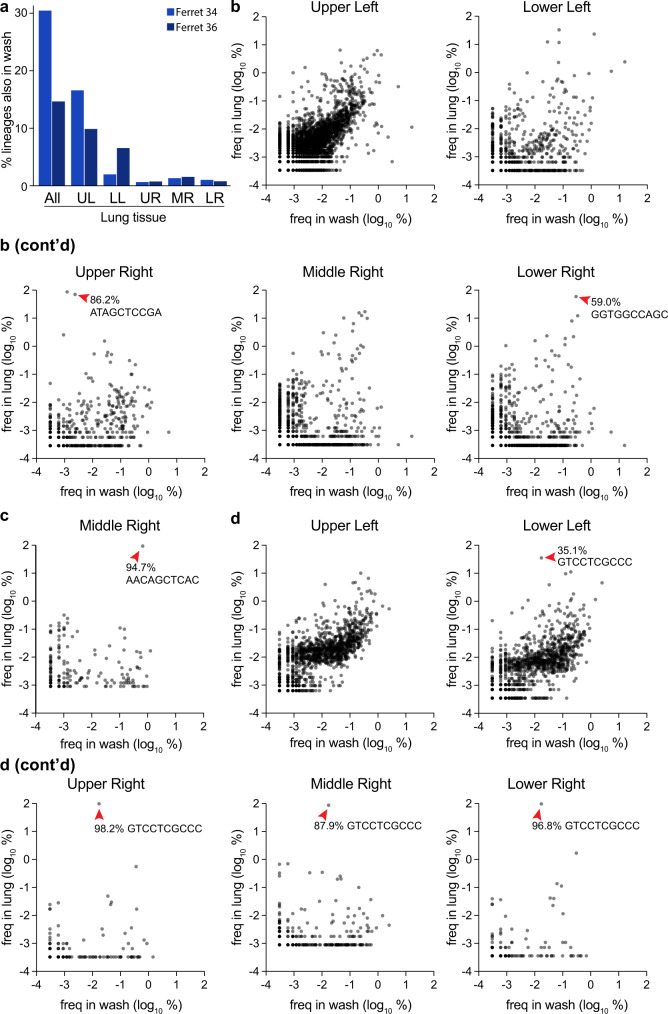
Transmission of influenza A viruses (IAV) between hosts is subject to numerous physical and biological barriers that impose genetic bottlenecks, constraining viral diversity and adaptation. The bottlenecks within hosts and their potential impacts on evolutionary pathways taken during infection are poorly understood. To address this, we created highly diverse IAV libraries bearing molecular barcodes on two gene segments, enabling high-resolution tracking and quantification of unique virus lineages within hosts. Here we show that IAV infection in lungs is characterized by multiple within-host bottlenecks that result in "islands" of infection in lung lobes, each with genetically distinct populations. We perform site-specific inoculation of barcoded IAV in the upper respiratory tract of ferrets and track viral diversity as infection spreads to the trachea and lungs. We detect extensive compartmentalization of discrete populations within lung lobes. Bottleneck events and localized replication stochastically sample individual viruses from the upper respiratory tract or the trachea that become the dominant genotype in a particular lobe. These populations are shaped strongly by founder effects, with limited evidence for positive selection. The segregated sites of replication highlight the jackpot-style events that contribute to within-host influenza virus evolution and may account for low rates of intrahost adaptation.


Conflict of interest statement

The authors declare no competing interests.

Figures

Fig. 1
Fig. 1. Creation of molecularly barcoded influenza A virus populations.
a Molecular barcodes containing 10 randomized nucleotides were encoded downstream of the open reading frame in the PA and HA genes, shown as cRNAs. A registration mark was also added to HA to distinguish unique barcode libraries. Sequences were repeated downstream of the barcode to maintain contiguous packaging signals required for replication, and silent mutations were introduced into the open reading frame to avoid direct repeats. b Experimental overview where randomized barcodes were cloned into reverse genetics vectors followed by large-scale, parallel virus rescues to ensure unbiased barcode distribution. c Optimized rescue plasmids enhance viral yield. Rescue efficiency was determined by measuring viral titers at the indicated times post-transfection with the standard 8-plasmid system, a consolidated 3-plasmid system, or the 3-plasmid system plus a vector expressing TMPRSS2. (data presented as the mean of n = 3 ± sd. ANOVA with Tukey’s post hoc, *p < 0.05 relative to 8-plasmid rescue, #p < 0.05 relative to three-plasmid system.) Source data are provided as a Source Data file.
Fig. 2
Fig. 2. Single viruses seed selective sweeps in HA.
a Creation of two dual-barcode libraries with distinct registration marks and uniquely addressable members. b Frequency of each lineage as a fraction of total population size. Colors indicate unique barcode identities. c Whole-genome sequencing identifies adaptive variants in HA. Individual single nucleotide variant (SNV) frequencies are indicated at each nucleotide position in a concatenated IAV genome for each library. d Long-read sequencing reveals selective sweeps by linking adaptive mutants in HA to single dominant barcodes. The frequencies of mutations coding for the indicated change that is linked to the dominant barcode are shown for both libraries (left). The actual frequency of K > Q and K > stop mutants versus the contribution from long-read sequencing errors to their appearance is unknown. The frequencies of all barcodes linked to the adaptive glutamic acid variant are indicated (right), with the dominant barcode in each library colored as in b. Source data are provided as a Source Data file.
Fig. 3
Fig. 3. Generation of large and evenly distributed dual-barcoded virus libraries.
a, b Properties of the A/CA/07/2009 HA-K153E PASTN virus libraries. Data are from a single sequencing replicate; see Supplemental Figs. 1, 2 for additional analyses. c Multistep growth curves of dual-barcoded PASTN libraries compared to the parental strain A/CA/07/2009 HA-K153E. Viral titer was measured by plaque assay (mean of n = 3 ± sd, two-way ANOVA with Tukey’s post hoc, *p < 0.05 and **p < 0.01 compared to the parental). d Frequency distribution of unique barcodes on HA and PA binned in 0.1% increments. e Whole-genome sequencing was performed on amplified viral stocks and SNV frequencies are indicated at each nucleotide position for each library. Source data are provided as a Source Data file.
Fig. 4
Fig. 4. Replication of diverse virus populations in mice.
a Mice were inoculated with 105 TCIDGlo50 of virus-containing barcoded PASTN with either HA-K153E or barcoded variants and body weights were measured daily. Half of the mice were killed at 3 dpi. Data presented as mean ± sd for n = 6 1–3 dpi, and n = 3 for 4–6 dpi. b Viral titers in mouse lungs harvested at 3 and 6 dpi were determined by plaque assay (left) or TCIDGlo50/mL (right). Data presented as the mean of n = 3 ± sd and analyzed by one-way ANOVA. n.s. = not significant. c Barcodes in the viral stock and mouse lungs were quantified and the frequency of clustered HA barcodes as a fraction of total population size is indicated. Each color in a series represents an individual barcode cluster. A total number of unique barcode clusters per sample and the most abundant barcode with its frequency is listed on right. d Shannon’s diversity index (left) and Gini–Simpson index (right) for viral populations in the stock and mouse lungs (mean of n = 3 ± sd). e Venn diagrams displaying the number of unique and shared lineages within each mouse for NheI and PstI libraries. Source data are provided as a Source Data file.
Fig. 5
Fig. 5. Population diversity is reduced when the influenza virus moves from the upper to the lower respiratory tract in ferrets.
a Ferrets were inoculated with a site-specific intranasal dose of 105 PFU of dual-barcoded A/CA/07/2009 HA-K153E PASTN virus containing the NheI registration mark. Ferret weight was monitored daily. b Viral titer in ferret nasal washes were determined by TCIDGlo50. c Changes in frequency for HA (top) and PA (bottom) barcodes present in nasal wash samples over the course of infection. d Evenness, Shannon’s diversity index, and Gini-Simpson index for the indicated viral populations. e The richness of each tissue is indicated by the number of distinct barcodes in each sample. N.A. = not attempted. f Virus was recovered from the trachea at 5 dpi and the frequency of barcodes was determined. Distinct dominant barcodes are identified by colored asterisks. g HA barcode frequencies were compared between the nasal wash (3 dpi) and trachea (5 dpi) for ferret 34, 35, and 36. Red arrowheads highlight dominant barcodes with frequency > 30%. R = Pearson’s correlation coefficient. Note that barcodes unique to the nasal wash or trachea are not plotted here. h Virus was recovered from lung lobes 5 dpi and the frequency of barcodes was determined. Lung lobes: upper left (UL), lower left (LL), upper right (UR), middle right (MR), lower right (LR). Distinct dominant barcodes are identified by colored asterisks, matching those in g where appropriate. The limit of detection for viral titer assays is indicated by a dashed line in b. Source data are provided as a Source Data file.
Fig. 6
Fig. 6. Lung lineage diversity and population bottlenecks are dominated by stochastic pressures.
a Pair-wise Bray-Curtis dissimilarity for lung lobes within single animals. b The number of barcode lineages common and unique to lung lobes are illustrated. c Whole-HA sequencing of virus in lung homogenates identified multiple iSNVs, but did not rose above the 3% threshold set for accurate estimation of iSNV frequency. d Transmission bottlenecks (Nb) from nasal wash 3 dpi to each lung lobe at 5 dpi were calculated by maximum likelihood estimation. 95% confidence intervals are shown by the lines within the dots. Source data are provided as a Source Data file.
Fig. 7
Fig. 7. Compartmentalized infections establish replication islands within the lung.
a Overlap between barcodes in the nasal wash 3 dpi and those present in distinct lobes, or composite data for all barcodes in the lung. bd The frequency of barcodes within the nasal wash is compared to frequencies within individual lobes for b ferret 34, c ferret 35, and d ferret 36. Red arrowheads highlight dominant barcodes with frequency >30%, which for ferret 36 is the same barcode that dominated in multiple lobes of the lung. Note that barcodes unique to the nasal wash or lung are not plotted here and can be found in Supplemental Fig. 6. Source data are provided as a Source Data file.

References

    1. Smith DJ, et al. Mapping the antigenic and genetic evolution of influenza virus. Science. 2004;305:371–376. doi: 10.1126/science.1097211. - DOI - PubMed
    1. Ghedin E, et al. Large-scale sequencing of human influenza reveals the dynamic nature of viral genome evolution. Nature. 2005;437:1162–1166. doi: 10.1038/nature04239. - DOI - PubMed
    1. Rambaut A, et al. The genomic and epidemiological dynamics of human influenza A virus. Nature. 2008;453:615–619. doi: 10.1038/nature06945. - DOI - PMC - PubMed
    1. Dinis JM, et al. Deep sequencing reveals potential antigenic variants at low frequencies in influenza A virus-infected humans. J. Virol. 2016;90:3355–3365. doi: 10.1128/JVI.03248-15. - DOI - PMC - PubMed
    1. Debbink K, et al. Vaccination has minimal impact on the intrahost diversity of H3N2 influenza viruses. PLoS Pathog. 2017;13:e1006194. doi: 10.1371/journal.ppat.1006194. - DOI - PMC - PubMed

Publication types