. 2022 Jun 14;13(1):3417.
doi: 10.1038/s41467-022-31072-2.

Brain-wide reconstruction of inhibitory circuits after traumatic brain injury

Affiliations

Brain-wide reconstruction of inhibitory circuits after traumatic brain injury

Jan C Frankowski et al. Nat Commun. .

Abstract

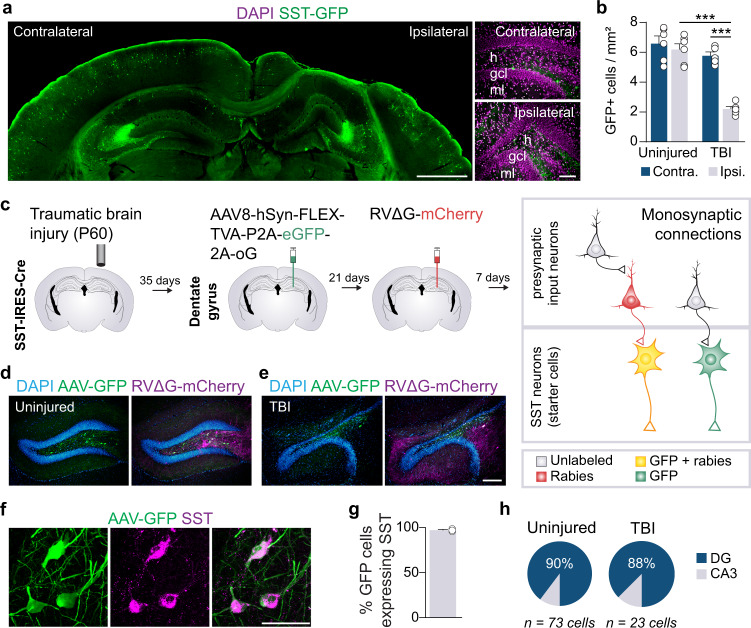
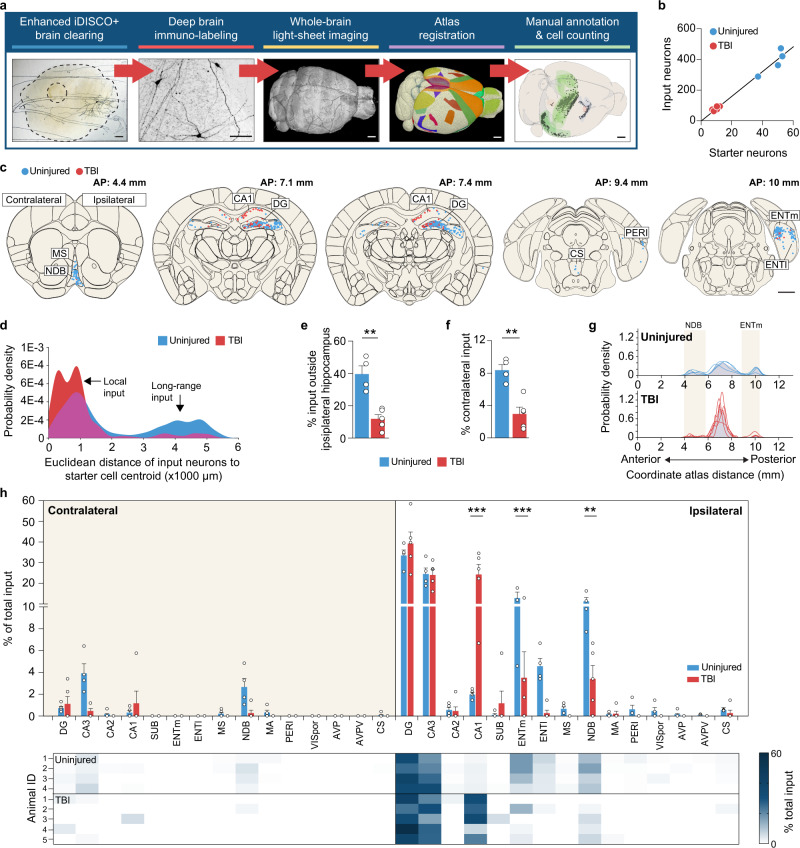
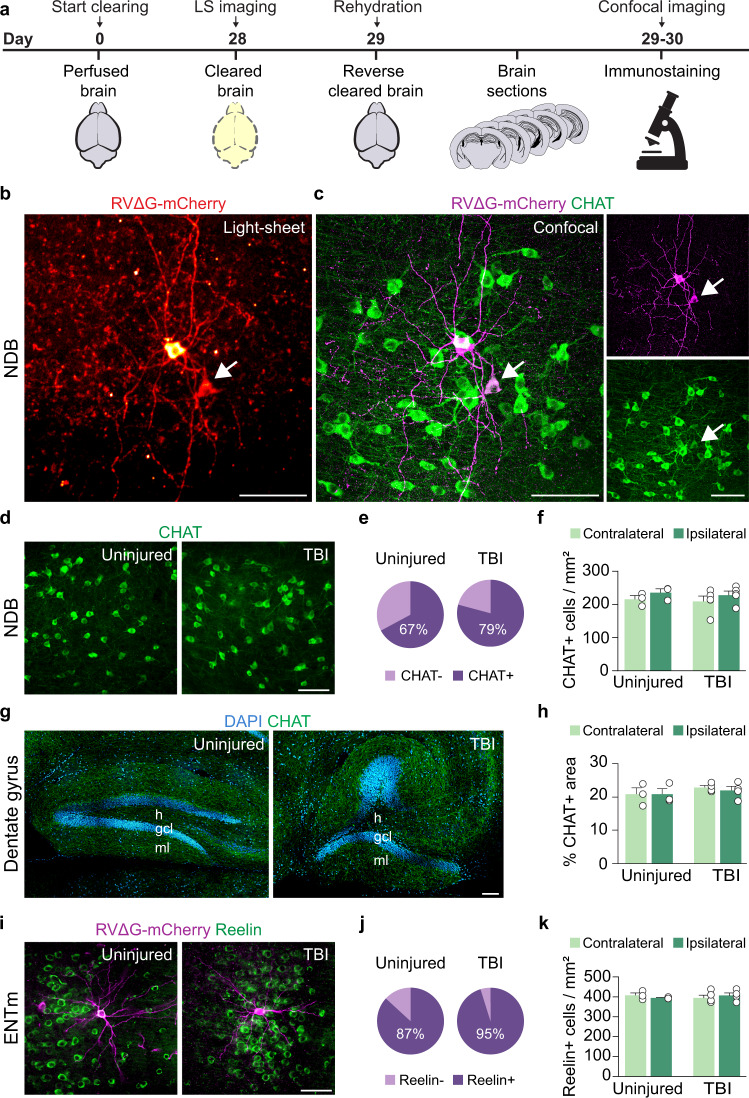
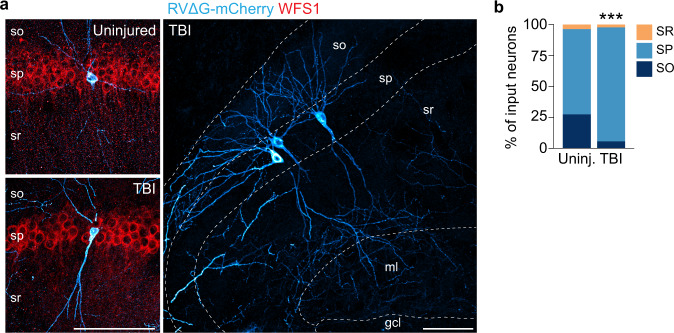
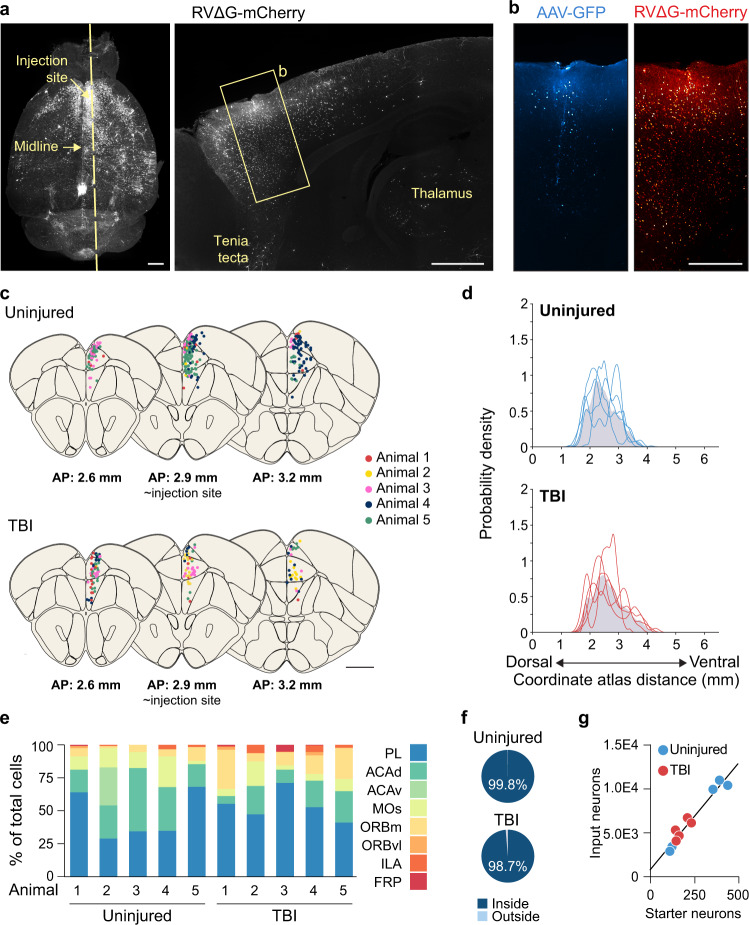
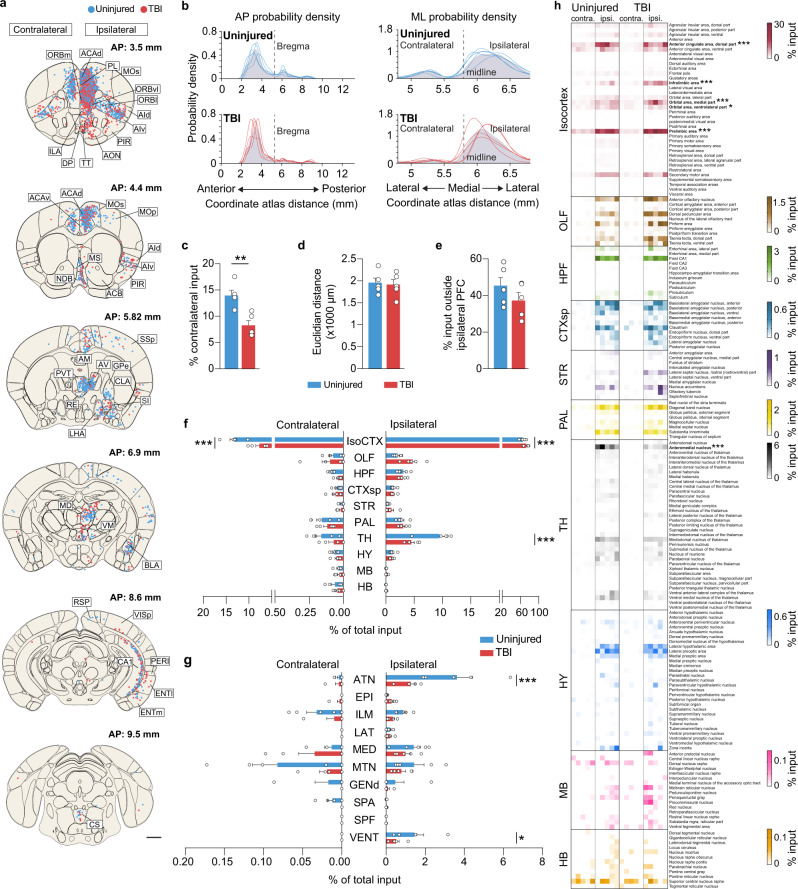
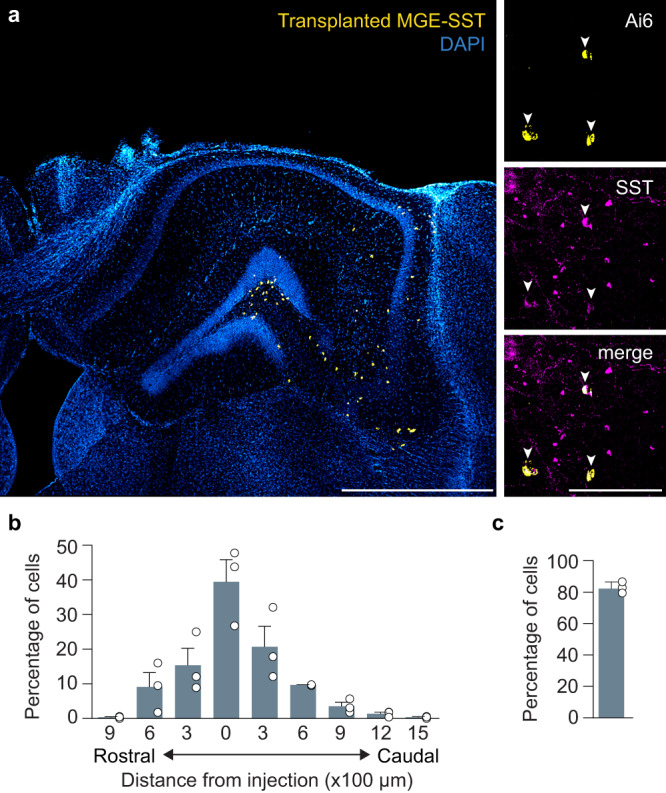
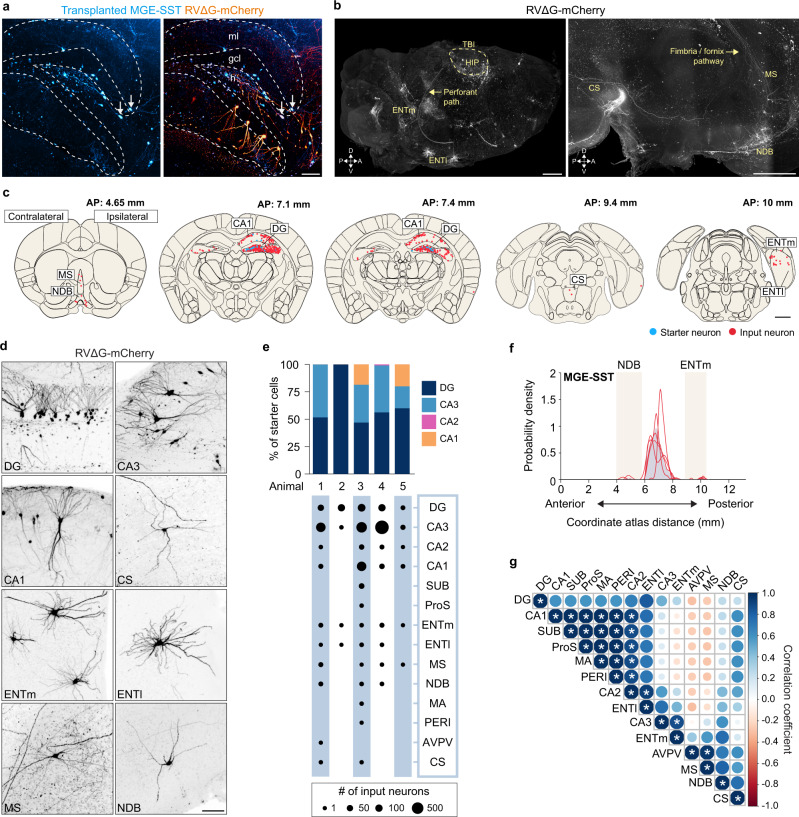
Despite the fundamental importance of understanding the brain's wiring diagram, our knowledge of how neuronal connectivity is rewired by traumatic brain injury remains remarkably incomplete. Here we use cellular resolution whole-brain imaging to generate brain-wide maps of the input to inhibitory neurons in a mouse model of traumatic brain injury. We find that somatostatin interneurons are converted into hyperconnected hubs in multiple brain regions, with rich local network connections but diminished long-range inputs, even at areas not directly damaged. The loss of long-range input does not correlate with cell loss in distant brain regions. Interneurons transplanted into the injury site receive orthotopic local and long-range input, suggesting the machinery for establishing distant connections remains intact even after a severe injury. Our results uncover a potential strategy to sustain and optimize inhibition after traumatic brain injury that involves spatial reorganization of the direct inputs to inhibitory neurons across the brain.


Conflict of interest statement

The authors declare no competing interests.

Figures

Fig. 1
Fig. 1. SST interneuron loss after focal TBI.
a Coronal section 8 wks after TBI labeled for SST-GFP (green) and DAPI (magenta). h, hilus; gcl, granule cell layer; ml, molecular layer. Representative animal from n = 5 TBI mice b Quantification of SST-GFP interneurons in uninjured control and brain-injured animals. ***P = 1.62E-06, ipsilateral uninjured control versus ipsilateral TBI, ***P = 1.31E-05, contralateral TBI versus ipsilateral TBI; two-way ANOVA with Tukey’s post hoc test, n = 6 uninjured and 5 TBI mice. c. Schematic showing the two-virus experimental retrograde tracing strategy. d, e Dentate gyrus of an uninjured control (d) and CCI injured animal (e) labeled for DAPI (blue), AAV helper virus (green) and RVΔG-mCherry (magenta). Representative animals from n = 4 uninjured and 2 TBI mice. f. Coronal section of dentate gyrus labeled for AAV helper virus (green) and somatostatin (magenta). Representative animal from n = 3 uninjured mice. g Quantification of SST expression in neurons labeled with AAV helper virus; n = 3 mice. h Distribution of dual color-labeled starter cells in hippocampus; n = 73 cells from 4 uninjured controls, n = 23 cells from 2 animals with TBI. Error bars, s.e.m.; scale bars, 1 mm (a, left), 100 μm (a, right; d and e) and 50 μm (f). See also Supplementary Figs. 1, 2 and Supplementary Data 1. Source data are provided as a Source Data file.
Fig. 2
Fig. 2. Reorganization of brain-wide input to hippocampal SST interneurons after TBI.
a Experimental design for enhanced iDISCO+ brain clearing and whole-brain light-sheet imaging. b Linear regression analysis for number of starter cells and pre-synaptic input neurons in the whole brain (n = 4 uninjured controls, 5 TBI mice; R2 = 0.98). c Schematic coronal sections (250 μm) showing individual rabies-labeled cells registered in standardized atlas space for uninjured controls (blue) and brain-injured animals (red). One dot represents one neuron. n = 4 uninjured control and 5 TBI animals. A list of abbreviations is provided in Supplementary Data 2. d Gaussian kernel cell density plots showing pooled Euclidian distances of input neurons to nearest starter neuron centroid. e. Proportion of input neurons found outside ipsilateral hippocampus (DG, CA3, CA2, CA1). Uninjured: 39.6  ± 5.2%, n = 4 mice; TBI: 11.8 ± 2.7 %, n = 5 mice; **P = 1.5E-3; two-tailed t-test. f Proportion of input neurons found in the contralateral hemisphere. Uninjured: 8.4 ± 0.7%, n = 4 mice; TBI: 3.0 ± 0.8 %, n = 5 mice; **P = 2.0E-3; two-tailed t-test. g Gaussian kernel cell density plot of the whole-brain distribution of input neurons along the anterior-posterior axis. Grey shading represents the pooled population with individual lines representing each animal. Quantification is provided in Supplementary Data 3. h Proportion of input neurons found in each discrete brain area. ***P < 1.0E-15, uninjured versus TBI (CA1), ***P = 2.25E-04, uninjured versus TBI (ENTm), **P = 4.69E-03, uninjured versus TBI (NDB); two-way repeated-measures ANOVA with Bonferroni’s post-hoc test; n = 4 uninjured and 5 TBI mice. Quantification is provided in Supplementary Data 4. Error bars, s.e.m.; scale bars, 1 mm (except deep immunolabeling in a, 100 μm). See also Supplementary Figs. 3 to 7, Supplementary Data 5, and Supplementary Movies 1 and 2. Source data are provided as a Source Data file.
Fig. 3
Fig. 3. Distant brain regions remain structurally intact.
a Schematic showing the experimental protocol for reverse brain clearing and immunolabeling. b Two rabies-labeled input neurons (red) identified in a sagittal optical section of NDB in an intact control brain. Representative animal from n = 3 uninjured controls. 50 μm maximum intensity projection obtained by whole-brain light-sheet imaging. c Sagittal section containing the same input neurons (magenta) labeled for CHAT (green) after processing for traditional immunostaining and confocal imaging. Representative animal from n = 3 uninjured controls. Arrow indicates co-labeled cell. d NDB of uninjured control (left) and brain-injured animal (right) labeled for CHAT (green). Representative animals from n = 3 uninjured and 4 TBI mice. e Proportion of mCherry+ rabies-labeled input neurons that expressed CHAT. f Quantification of CHAT+ neuron density in ipsilateral and contralateral NDB in uninjured controls and brain-injured animals. n = 3 uninjured and 5 TBI animals. g Sagittal section of dentate gyrus in uninjured control (left) and brain injured animal (right) labeled for CHAT (green) and DAPI (blue). Representative animals from n = 3 uninjured and 4 TBI mice. h, hilus; gcl, granule cell layer; ml, molecular layer. h. Quantification of CHAT+ axon density in ipsilateral and contralateral dentate gyrus in uninjured controls and brain-injured animals. n = 3 uninjured and 4 TBI animals. i ENTm of uninjured control (left) and brain-injured animal (right) labeled for reelin (green) and mCherry (magenta). Representative animals from n = 3 uninjured and 5 TBI animals. j Proportion of mCherry+ rabies-labeled input neurons that expressed reelin. k Quantification of reelin+ cell density in ipsilateral and contralateral ENTm. n = 3 uninjured and 5 TBI animals. Error bars, s.e.m.; scale bars, 100 μm. See also Supplementary Fig. 8 and Supplementary Data 1. Source data are provided as a Source Data file.
Fig. 4
Fig. 4. Identification of CA1 input neurons.
a CA1 in uninjured control (top) and brain injured animal (bottom) labeled for rabies (blue) and WFS1 (red). Representative animals from n = 3 uninjured and 4 TBI mice. so, stratum oriens; sp, stratum pyramidale; sr, stratum radiatum; ml, molecular layer; gcl, granule cell layer. b Proportion of input neurons found in each layer of CA1. ***P = 1.29E-07, uninjured versus TBI, two-sided Chi-squared test. n = 45 cells from 3 uninjured controls, 183 cells from 4 TBI mice. Scale bars, 100 μm. See also Supplementary Data 1. Source data are provided as a Source Data file.
Fig. 5
Fig. 5. Distribution of starter neurons in PFC.
a Left: Whole brain cleared using iDISCO+ and labeled for neurons providing input to PFC SST interneurons (white). Right: 100 μm sagittal optical section of the same brain showing rabies-labeled input neurons at the injection site. b Boxed region shown in (a) labeled for starter cells (blue) and input neurons (red). c. Schematic coronal sections (100 μm) showing individual starter cells registered in standardized atlas space for uninjured controls and brain injured animals. Each color corresponds to a different animal. One dot represents one neuron. n = 5 animals per group. d Gaussian kernel cell density plots of the whole-brain distribution of starter neurons along the dorsal-ventral axis. Grey shading represents the pooled population with individual lines representing each animal. e Regional distribution of starter cells in uninjured controls and brain injured animals. f Proportion of starter cells identified within PFC (PL, ACAd, ACAv, MOs, ORBm, ORBvl, ILA). g Linear regression analysis for number of starter cells and pre-synaptic input neurons (n = 5 mice per group; R2 = 0.95). Scale bars, 1 mm (a and c), 500 μm (b). A list of abbreviations is provided in Supplementary Data 2. See also Supplementary Fig. 9 to 12. Source data are provided as a Source Data file.
Fig. 6
Fig. 6. Input to SST interneurons in PFC is reorganized after TBI.
a Schematic coronal sections (100 μm) showing individual input neurons registered in standardized atlas space for uninjured controls (blue) and brain injured animals (red). One dot represents one neuron. n = 5 animals per group. b Gaussian kernel cell density plots of the whole-brain distribution of input neurons along the anterior-posterior (AP) and medial-lateral (ML) axis. Grey shading represents the pooled population with individual lines representing each animal. Bregma, 5.3 mm; midline, 5.7 mm. c Proportion of input neurons found in contralateral hemisphere. Uninjured: 14.00  ± 1.02%; TBI: 8.22 ± 0.98 %; n = 5 mice per group; **P = 3.41E-03; two-tailed t-test. d Quantification of average Euclidian distance between starter cell centroid and input neuron positions. n = 5 animals per group. e Proportion of input neurons found outside ipsilateral PFC. n = 5 animals per group. f Proportion of total input arising from high-level brain regions. ***P = 2.84E-06, uninjured versus TBI (IsoCTX, contralateral), ***P = 4.46E-10, uninjured versus TBI (IsoCTX, ipsilateral), ***P = 4.12E-05, uninjured versus TBI (TH, ipsilateral); n = 5 mice per group; two-way repeated measures ANOVA with Bonferroni’s post hoc test. g Proportion of total presynaptic input arising from thalamic areas. ***P = 1.16E-11, uninjured versus TBI (ATN, ipsilateral), *P = 4.46E-02, uninjured versus TBI (VENT, ipsilateral); n = 5 mice per group; two-way repeated measures ANOVA with Bonferroni’s post hoc test. h Heatmap showing the proportion of input neurons identified in all discrete brain regions innervating PFC. ***P = 1.00E-15, uninjured versus TBI (ACAd, ipsilateral), ***P = 1.00E-15, uninjured versus TBI (ILA, ipsilateral), ***P = 1.00E-15, uninjured versus TBI (ORBm, ipsilateral), *P = 1.25E-02, uninjured versus TBI (ORBvl, ipsilateral), ***P = 1.00E-15, uninjured versus TBI (PL, ipsilateral), ***P = 1.18E-04, uninjured versus TBI (PL, contralateral), ***P = 1.07E-05, uninjured versus TBI (AM, ipsilateral); n = 5 mice per group; two-way repeated measures ANOVA with Bonferroni’s post-hoc test. Error bars, s.e.m.; scale bar, 1 mm. A list of abbreviations is provided in Supplementary Data 2. See also Supplementary Figs. 12 to 14, Supplementary Data 7 to 9, and Supplementary Movies 3 and 4. Source data are provided as a Source Data file.
Fig. 7
Fig. 7. Transplanted SST interneurons integrate into brain-injured hippocampus.
a Left: Coronal section of dorsal hippocampus five weeks after transplantation labeled for Ai6-expressing transplanted interneurons (yellow) and DAPI (blue). Representative animal from n = 3 mice. Scale bar, 1 mm. Right: Ai6-expressing neurons (yellow) co-labeled for somatostatin (magenta). Scale bar, 100 μm. b Distribution of transplanted SST interneurons 35 DAT, n = 3 mice. c Proportion of Ai6-expressing cells that expressed somatostatin, n = 3 mice. Error bars, s.e.m. See also Supplementary Fig. 15. Source data are provided as a Source Data file.
Fig. 8
Fig. 8. Transplanted SST interneurons receive local and long-range input.
a A 100 μm sagittal optical section of dentate gyrus labeled for transplanted cells (blue) and input neurons (orange). White arrows, starter cells. h, hilus; gcl, granule cell layer; ml, molecular layer. b Left: whole-brain render of the entire ipsilateral hemisphere of the same animal shown in (a) labeled for input neurons (white). Dotted circle outlines the injury border overlying hippocampus (HIP). Right: Whole-brain render showing input neurons in superior central nucleus raphae (CS), medial septum (MS), and diagonal band nucleus (NDB). Representative animal from n = 5 mice. c Schematic coronal sections (250 μm) showing individual starter cells (red) and input neurons (blue) registered in standardized atlas space. One dot represents one neuron. n = 5 animals. d Maximum intensity projections (100 μm) of neurons providing input to transplanted SST interneurons in the intact injured brain. Representative animals from n = 5 mice. e Top: proportion of transplanted starter cells found in each layer of hippocampus. Bottom: bubble plot of brain areas containing rabies-labeled input neurons. f Gaussian kernel cell density plot of the whole-brain distribution of input neurons along the anterior-posterior axis. Grey shading represents the pooled population with individual lines representing each animal. g Correlation matrix of input to transplanted SST interneurons. Size and color, correlation coefficient. *P < 0.05, exact P-values are provided in Source Data file; two-sided Pearson’s correlation. Scale bars, 100 μm (a, g), 1 mm (b, c). A list of abbreviations is provided in Supplementary Data 2. See also Supplementary Fig. 16 and 17, Source Data and Supplementary Movie 5. Source data are provided as a Source Data file.

Comment in

Similar articles

Cited by

References

    1. Klausberger T, Somogyi P. Neuronal diversity and temporal dynamics: the unity of hippocampal circuit operations. Science. 2008;321:53–57. doi: 10.1126/science.1149381. - DOI - PMC - PubMed
    1. Kepecs A, Fishell G. Interneuron cell types are fit to function. Nature. 2014;505:318–326. doi: 10.1038/nature12983. - DOI - PMC - PubMed
    1. Tremblay R, Lee S, Rudy B. GABAergic Interneurons in the Neocortex: From Cellular Properties to Circuits. Neuron. 2016;91:260–292. doi: 10.1016/j.neuron.2016.06.033. - DOI - PMC - PubMed
    1. Freund TF, Buzsáki G. Interneurons of the hippocampus. Hippocampus. 1996;6:347–470. doi: 10.1002/(SICI)1098-1063(1996)6:4<347::AID-HIPO1>3.0.CO;2-I. - DOI - PubMed
    1. Ascoli GA, et al. Petilla terminology: nomenclature of features of GABAergic interneurons of the cerebral cortex. Nat. Rev. Neurosci. 2008;9:557–568. doi: 10.1038/nrn2402. - DOI - PMC - PubMed

Publication types