Randomized Controlled Trial
. 2022 Jun 14;12(1):9890.
doi: 10.1038/s41598-022-13749-2.

Disruption of spatiotemporal clustering in dengue cases by wMel Wolbachia in Yogyakarta, Indonesia

Affiliations
Randomized Controlled Trial

Disruption of spatiotemporal clustering in dengue cases by wMel Wolbachia in Yogyakarta, Indonesia

Suzanne M Dufault et al. Sci Rep. .

Abstract

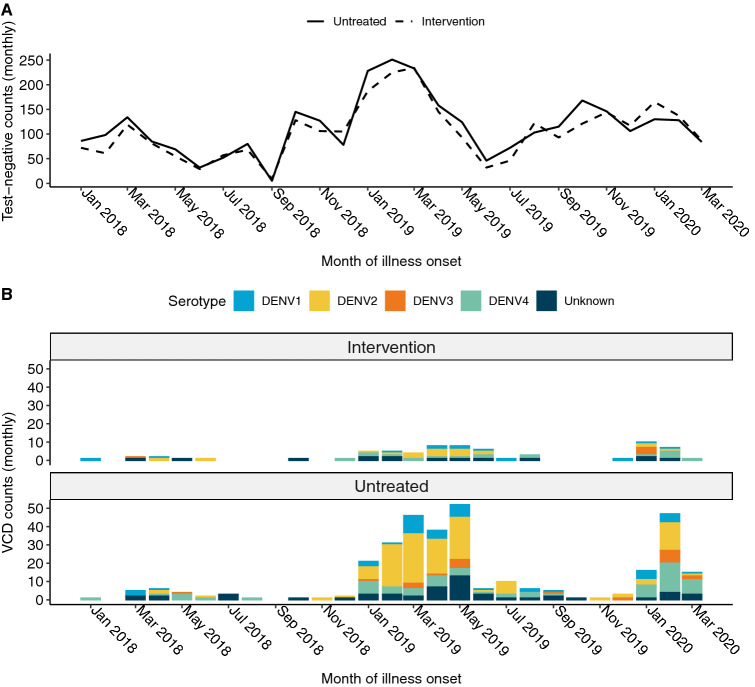
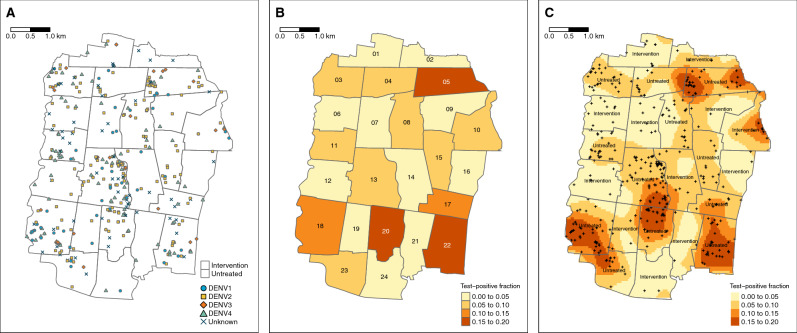
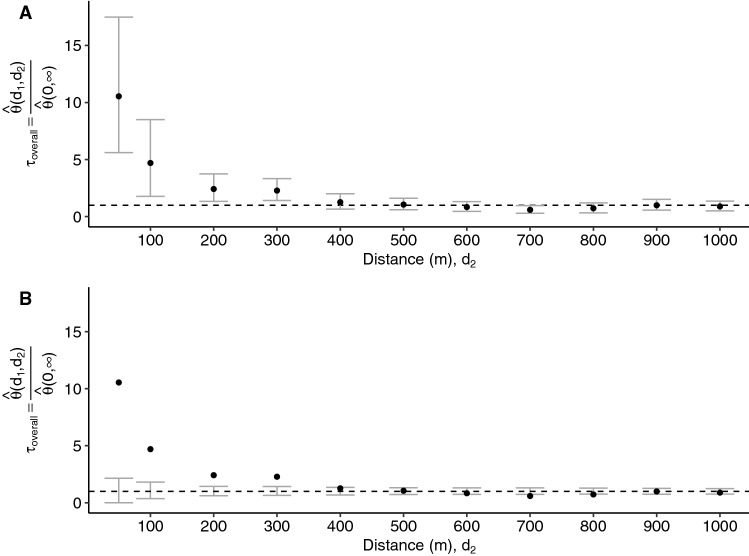
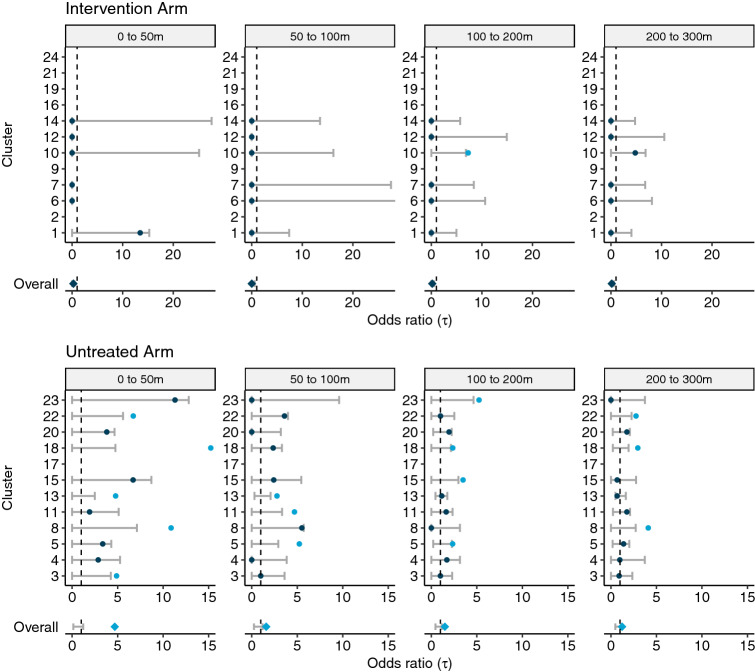
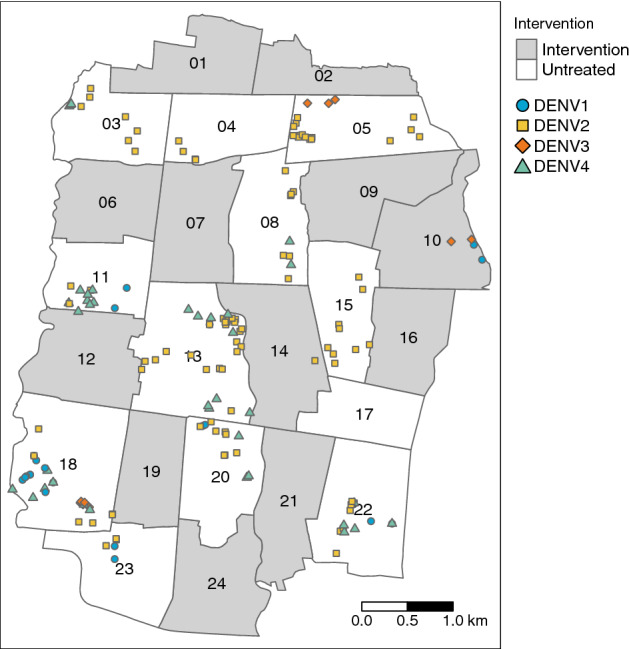
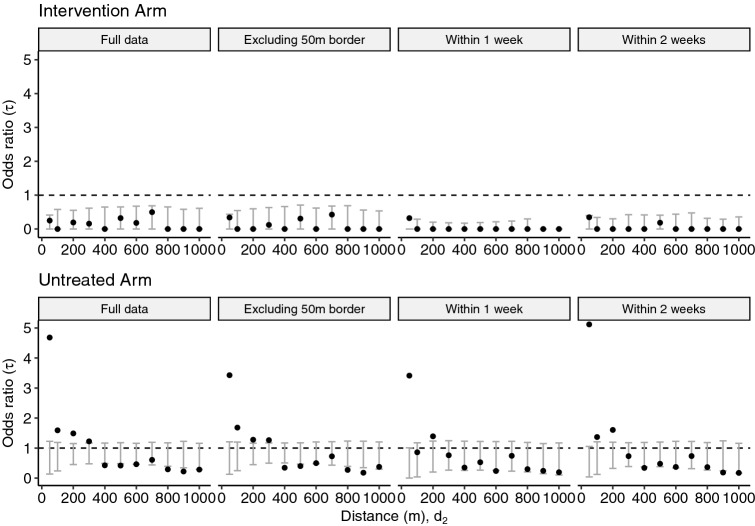
Dengue exhibits focal clustering in households and neighborhoods, driven by local mosquito population dynamics, human population immunity, and fine scale human and mosquito movement. We tested the hypothesis that spatiotemporal clustering of homotypic dengue cases is disrupted by introduction of the arbovirus-blocking bacterium Wolbachia (wMel-strain) into the Aedes aegypti mosquito population. We analysed 318 serotyped and geolocated dengue cases (and 5921 test-negative controls) from a randomized controlled trial in Yogyakarta, Indonesia of wMel deployments. We find evidence of spatial clustering up to 300 m among the 265 dengue cases (3083 controls) in the untreated trial arm. Participant pairs enrolled within 30 days and 50 m had a 4.7-fold increase (compared to 95% CI on permutation-based null distribution: 0.1, 1.2) in the odds of being homotypic (i.e. potentially transmission-related) as compared to pairs occurring at any distance. In contrast, we find no evidence of spatiotemporal clustering among the 53 dengue cases (2838 controls) resident in the wMel-treated arm. Introgression of wMel Wolbachia into Aedes aegypti mosquito populations interrupts focal dengue virus transmission leading to reduced case incidence; the true intervention effect may be greater than the 77% efficacy measured in the primary analysis of the Yogyakarta trial.


Conflict of interest statement

The authors declare no competing interests.

Figures

Figure 1
Figure 1
Time series plot for illness onset among (A) test-negative controls and (B) virologically-confirmed dengue cases included in the primary analysis of the AWED trial in Yogyakarta, Indonesia from January 2018 until March 2020, by intervention arm. No dengue cases were enrolled in September 2018 and, in accordance with the trial protocol, the test-negatives enrolled during that month were excluded from the analysis dataset.
Figure 2
Figure 2
Spatial distribution of (A) enrolled dengue cases by serotype across Yogyakarta City, (B) the cluster-aggregate test-positive fraction, i.e., the proportion of enrolled dengue cases among the total number of individuals enrolled in each cluster, and (C) kernel smoothing estimates of the spatially-varying test-positive fraction. Each map includes participants enrolled from January 2018 through March 2020. The borders in each map represent the cluster boundaries for the AWED trial. Clusters are labelled with their numerical code in panel B and their intervention status in panel C. Points represent the geolocated households of virologically confirmed dengue cases. Areas with darker shading in panels B and C have a higher proportion of dengue cases among enrolled AWED participants than areas with lighter shading. Smoothing bandwidth was selected by cross-validation.
Figure 3
Figure 3
Estimated odds ratio, τ, comparing the odds of a homotypic dengue case pair within (d1,d2) versus the odds of a homotypic dengue case pair at any distance across the entire study area among participant pairs with illness onset occurring within 30 days. Variability in estimation is visualized in two distinct ways. (A) displays the pointwise 95% confidence interval (CI) based on 1000 bootstrap resamples of the data and (B) shows the pointwise 95% CI on the permutation-based null rejection region based on 1000 permutations of the data.
Figure 4
Figure 4
Cluster-specific and pooled arm-level estimates of the τ-statistic (points) and 95% CIs on the null distribution (error bar) generated from 1000 simulations where the geolocation of participants is randomly permuted within each cluster. Each panel displays the estimated spatial dependence for homotypic case pairs with illness onset occurring within 30 days and resident within a given distance interval (meters) from each other. Estimated spatial dependence that is inconsistent with the null hypothesis is present when the point estimate falls outside of the 95% CIs of the null distribution and, for improved visibility, is marked by the light blue points. The overall point estimate for each trial arm is found by taking the geometric mean of the cluster-level estimates and is then compared against the 95% CIs of the null distribution of the permuted geometric mean.
Figure 5
Figure 5
Residential locations of the 160 enrolled serotyped dengue cases involved in homotypic pairs with residences within 300 m and illness onset within 30 days, including pairs that cross cluster boundaries.
Figure 6
Figure 6
Sensitivity analyses and comparison with the primary analysis. Modified geometric mean odds ratio, τ, comparing the odds of a homotypic dengue case pair within the distance interval (d1,d2) versus the odds of a homotypic dengue case pair at any distance across the entire study area for (1) the full dataset, (2) the dataset excluding those within 50 m of a cluster border, (3) participant pairs with illness onset occurring within 1 week of each other, and (4) participant pairs with illness onset occurring within 2 weeks of each other. The error bars denote the 95% CI on the null distribution generated by 1000 permutations of the data.

References

    1. Bhatt, S. et al. The global distribution and burden of dengue. Nature. 10.1038/nature12060 (2013). - PMC - PubMed
    1. Mammen MP, et al. Spatial and temporal clustering of dengue virus transmission in Thai villages. PLoS Med. 2008;5:1605–1616. doi: 10.1371/journal.pmed.0050205. - DOI - PMC - PubMed
    1. Vazquez-Prokopec GM, Kitron U, Montgomery B, Horne P, Ritchie SA. Quantifying the spatial dimension of dengue virus epidemic spread within a tropical urban environment. PLoS Negl. Trop. Dis. 2010;4:1–14. doi: 10.1371/journal.pntd.0000920. - DOI - PMC - PubMed
    1. Aldstadt J, et al. Space-time analysis of hospitalised dengue patients in rural Thailand reveals important temporal intervals in the pattern of dengue virus transmission. Trop. Med. Int. Health. 2012;17:1076–1085. doi: 10.1111/j.1365-3156.2012.03040.x. - DOI - PMC - PubMed
    1. Salje H, et al. Revealing the microscale spatial signature of dengue transmission and immunity in an urban population. Proc. Natl. Acad. Sci. U.S.A. 2012;109:9535–9538. doi: 10.1073/pnas.1120621109. - DOI - PMC - PubMed

Publication types