

Heart rate and age modulate retinal pulsatile patterns
- PMID: 35701487
- PMCID: PMC9197857
- DOI: 10.1038/s42003-022-03441-6
Heart rate and age modulate retinal pulsatile patterns
Abstract
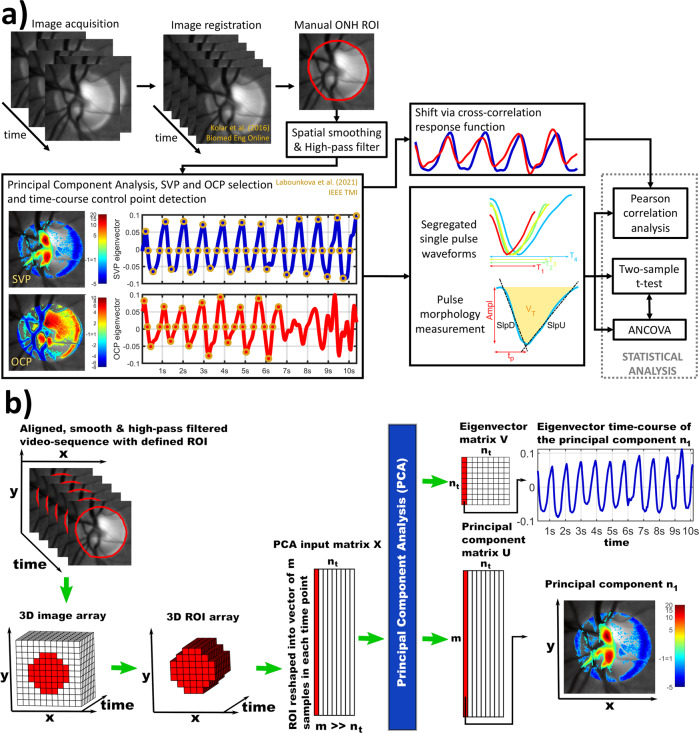
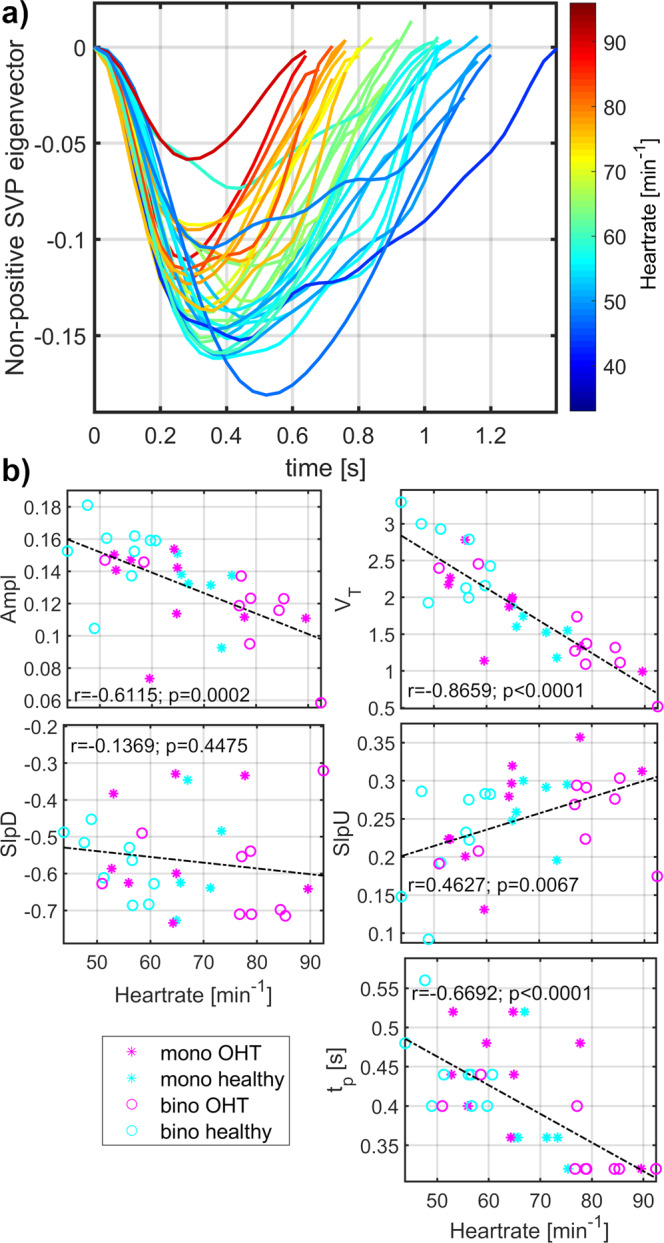
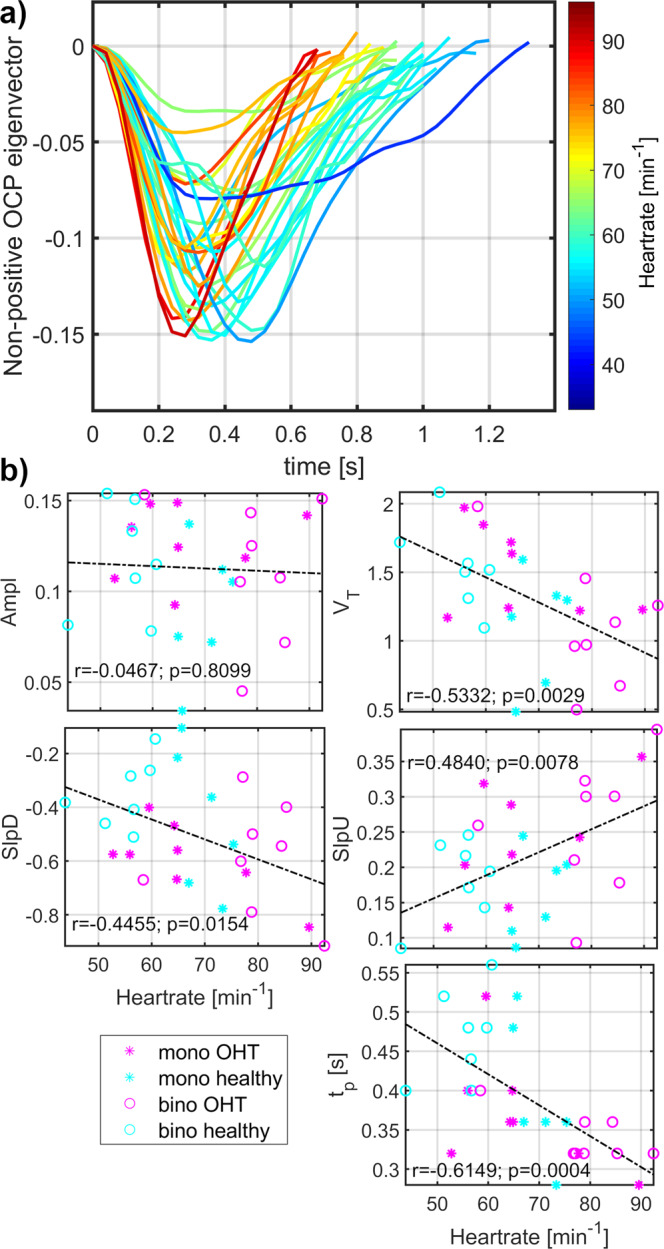
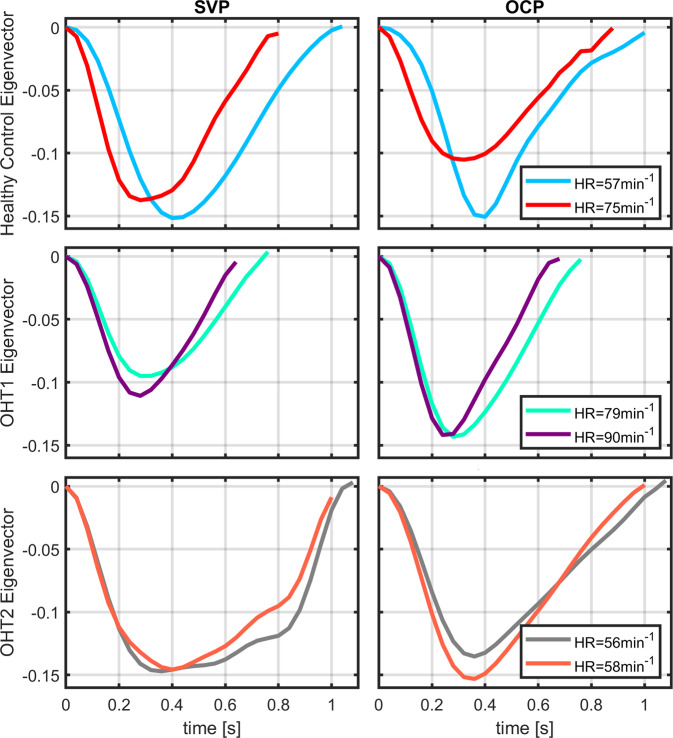
Theoretical models of retinal hemodynamics showed the modulation of retinal pulsatile patterns (RPPs) by heart rate (HR), yet in-vivo validation and scientific merit of this biological process is lacking. Such evidence is critical for result interpretation, study design, and (patho-)physiological modeling of human biology spanning applications in various medical specialties. In retinal hemodynamic video-recordings, we characterize the morphology of RPPs and assess the impact of modulation by HR or other variables. Principal component analysis isolated two RPPs, i.e., spontaneous venous pulsation (SVP) and optic cup pulsation (OCP). Heart rate modulated SVP and OCP morphology (pFDR < 0.05); age modulated SVP morphology (pFDR < 0.05). In addition, age and HR demonstrated the effect on between-group differences. This knowledge greatly affects future study designs, analyses of between-group differences in RPPs, and biophysical models investigating relationships between RPPs, intracranial, intraocular pressures, and cardiovascular physiology.
© 2022. The Author(s).
Conflict of interest statement
The authors declare no competing interests.
Figures


Similar articles
-
Spontaneous retinal venous pulsation: aetiology and significance.J Neurol Neurosurg Psychiatry. 2003 Jan;74(1):7-9. doi: 10.1136/jnnp.74.1.7. J Neurol Neurosurg Psychiatry. 2003. PMID: 12486256 Free PMC article. Review.
-
Relationship of intraocular pressure and frequency of spontaneous retinal venous pulsation in primary open-angle glaucoma.Ophthalmology. 2012 Nov;119(11):2254-60. doi: 10.1016/j.ophtha.2012.06.007. Epub 2012 Sep 12. Ophthalmology. 2012. PMID: 22980741
-
Structural characteristics of the optic nerve head influencing human retinal venous pulsations.Exp Eye Res. 2016 Apr;145:341-346. doi: 10.1016/j.exer.2016.02.003. Epub 2016 Feb 15. Exp Eye Res. 2016. PMID: 26892807
-
Visualization of fundus vessel pulsation using principal component analysis.Invest Ophthalmol Vis Sci. 2011 Jul 23;52(8):5457-64. doi: 10.1167/iovs.10-6806. Invest Ophthalmol Vis Sci. 2011. PMID: 21467181
-
Retinal venous pulsation: Expanding our understanding and use of this enigmatic phenomenon.Prog Retin Eye Res. 2016 Nov;55:82-107. doi: 10.1016/j.preteyeres.2016.06.003. Epub 2016 Jul 11. Prog Retin Eye Res. 2016. PMID: 27417037 Review.
Cited by
-
Compact Monocular Video-Ophthalmoscope to Measure Retinal Reflectance Changes to Flicker Light Stimuli.J Biophotonics. 2025 Jun;18(6):e202400494. doi: 10.1002/jbio.202400494. Epub 2025 Mar 11. J Biophotonics. 2025. PMID: 40065742 Free PMC article.
-
Synchronous functional magnetic resonance eye imaging, video ophthalmoscopy, and eye surface imaging reveal the human brain and eye pulsation mechanisms.Sci Rep. 2024 Jan 26;14(1):2250. doi: 10.1038/s41598-023-51069-1. Sci Rep. 2024. PMID: 38278832 Free PMC article.
-
A Novel Approach to Non-Invasive Intracranial Pressure Wave Monitoring: A Pilot Healthy Brain Study.Sensors (Basel). 2025 Jun 28;25(13):4042. doi: 10.3390/s25134042. Sensors (Basel). 2025. PMID: 40648297 Free PMC article.
-
Assessment of retinal vein pulsation through video-ophthalmoscopy and simultaneous biosignals acquisition.Biomed Opt Express. 2023 May 12;14(6):2645-2657. doi: 10.1364/BOE.486052. eCollection 2023 Jun 1. Biomed Opt Express. 2023. PMID: 37342721 Free PMC article.
References
-
- Tornow RP, Kolar R, Odstrcilik J, Labounkova I, Horn F. Imaging video plethysmography shows reduced signal amplitude in glaucoma patients in the area of the microvascular tissue of the optic nerve head. Graefes Arch. Clin. Exp. Ophthalmol. 2021;259:483–494. doi: 10.1007/s00417-020-04934-y. - DOI - PMC - PubMed
Publication types
MeSH terms
LinkOut - more resources
Full Text Sources
