

Insights into nitrogen metabolism in the wild and cultivated lettuce as revealed by transcriptome and weighted gene co-expression network analysis
- PMID: 35701518
- PMCID: PMC9197935
- DOI: 10.1038/s41598-022-13954-z
Insights into nitrogen metabolism in the wild and cultivated lettuce as revealed by transcriptome and weighted gene co-expression network analysis
Abstract
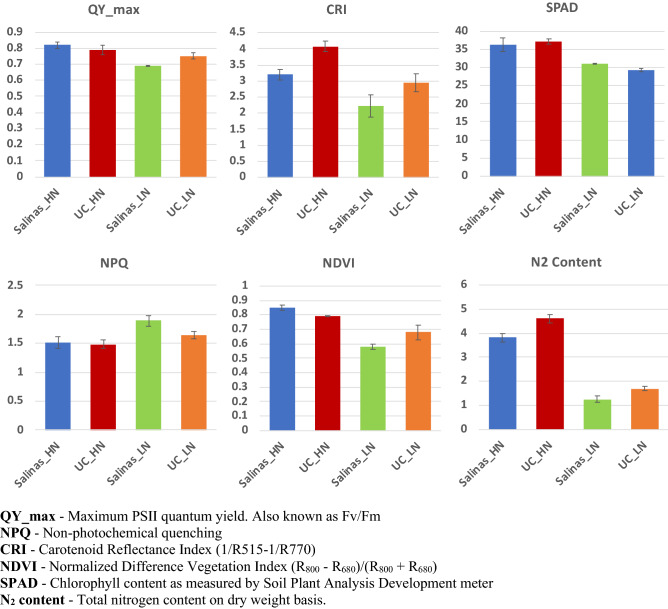
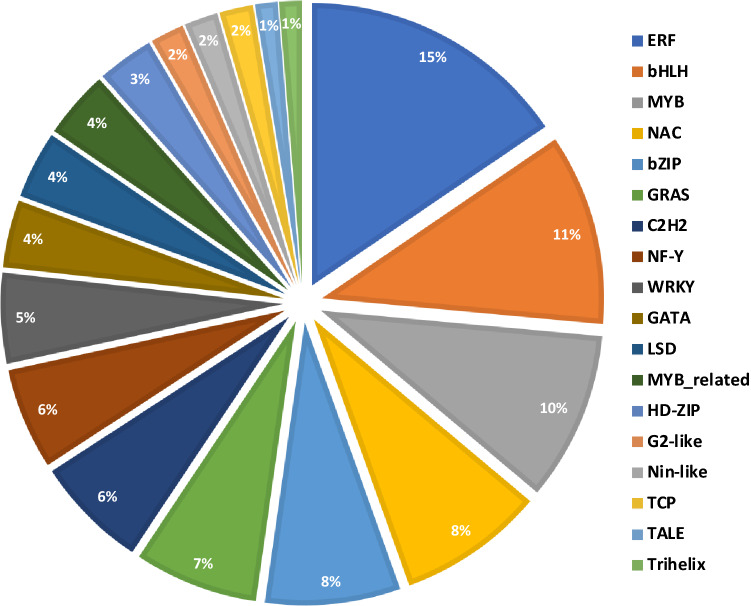
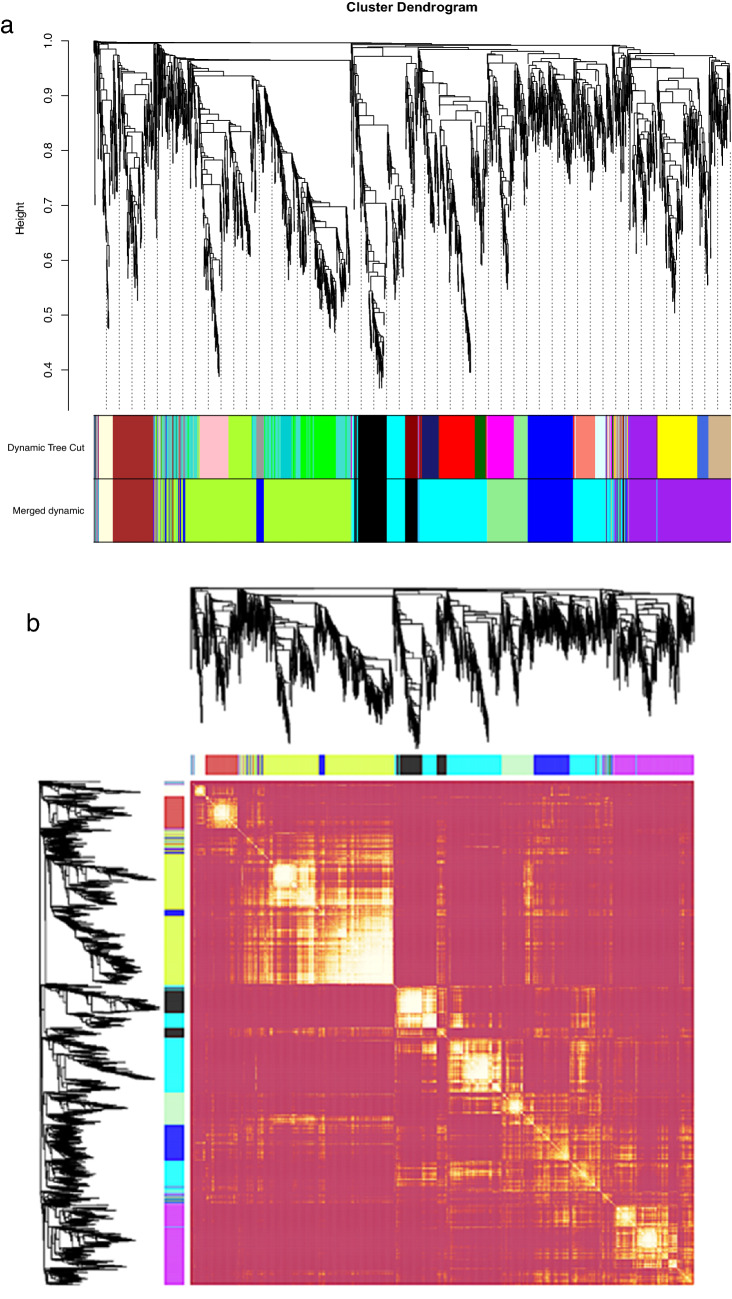
Large amounts of nitrogen fertilizers applied during lettuce (Lactuca sativa L.) production are lost due to leaching or volatilization, causing severe environmental pollution and increased costs of production. Developing lettuce varieties with high nitrogen use efficiency (NUE) is the eco-friendly solution to reduce nitrogen pollution. Hence, in-depth knowledge of nitrogen metabolism and assimilation genes and their regulation is critical for developing high NUE varieties. In this study, we performed comparative transcriptomic analysis of the cultivated lettuce (L. sativa L.) and its wild progenitor (L. serriola) under high and low nitrogen conditions. A total of 2,704 differentially expressed genes were identified. Key enriched biological processes included photosynthesis, oxidation-reduction process, chlorophyll biosynthetic process, and cell redox homeostasis. The transcription factors (TFs) belonging to the ethylene responsive factor family and basic helix-loop-helix family were among the top differentially expressed TFs. Using weighted gene co-expression network analysis we constructed nine co-expression modules. Among these, two modules were further investigated because of their significant association with total nitrogen content and photosynthetic efficiency of photosystem II. Three highly correlated clusters were identified which included hub genes for nitrogen metabolism, secondary metabolites, and carbon assimilation, and were regulated by cluster specific TFs. We found that the expression of nitrogen transportation and assimilation genes varied significantly between the two lettuce species thereby providing the opportunity of introgressing wild alleles into the cultivated germplasm for developing lettuce cultivars with more efficient use of nitrogen.
© 2022. The Author(s).
Conflict of interest statement
The authors declare no competing interests.
Figures


Similar articles
-
Role of sucrose in modulating the low-nitrogen-induced accumulation of phenolic compounds in lettuce (Lactuca sativa L.).J Sci Food Agric. 2020 Dec;100(15):5412-5421. doi: 10.1002/jsfa.10592. Epub 2020 Jul 23. J Sci Food Agric. 2020. PMID: 32562270
-
Effect of l-amino acid-based biostimulants on nitrogen use efficiency (NUE) in lettuce plants.J Sci Food Agric. 2022 Dec;102(15):7098-7106. doi: 10.1002/jsfa.12071. Epub 2022 Jul 2. J Sci Food Agric. 2022. PMID: 35778944 Free PMC article.
-
RNA-seq reveals the gene expression in patterns in Populus × euramericana 'Neva' plantation under different precision water and fertilizer-intensive management.BMC Plant Biol. 2024 Aug 9;24(1):759. doi: 10.1186/s12870-024-05427-4. BMC Plant Biol. 2024. PMID: 39118015 Free PMC article.
-
Comparative physiological and transcriptomic analyses reveal the mechanisms of CO2 enrichment in promoting the growth and quality in Lactuca sativa.PLoS One. 2023 Feb 3;18(2):e0278159. doi: 10.1371/journal.pone.0278159. eCollection 2023. PLoS One. 2023. PMID: 36735719 Free PMC article.
-
Transporters and transcription factors gene families involved in improving nitrogen use efficiency (NUE) and assimilation in rice (Oryza sativa L.).Transgenic Res. 2022 Feb;31(1):23-42. doi: 10.1007/s11248-021-00284-5. Epub 2021 Sep 15. Transgenic Res. 2022. PMID: 34524604 Review.
Cited by
-
From spectrum to yield: advances in crop photosynthesis with hyperspectral imaging.Photosynthetica. 2025 Jul 8;63(2):196-233. doi: 10.32615/ps.2025.012. eCollection 2025. Photosynthetica. 2025. PMID: 40766744 Free PMC article. Review.
References
-
- Simko I. Genetic variation in response to N, P, or K deprivation in baby leaf lettuce. Horticulturae. 2020;6(1):15. doi: 10.3390/horticulturae6010015. - DOI
Publication types
MeSH terms
Substances
LinkOut - more resources
Full Text Sources
