

Glycaemic variability is associated with all-cause mortality in COVID-19 patients with ARDS, a retrospective subcohort study
- PMID: 35701574
- PMCID: PMC9194894
- DOI: 10.1038/s41598-022-13816-8
Glycaemic variability is associated with all-cause mortality in COVID-19 patients with ARDS, a retrospective subcohort study
Abstract
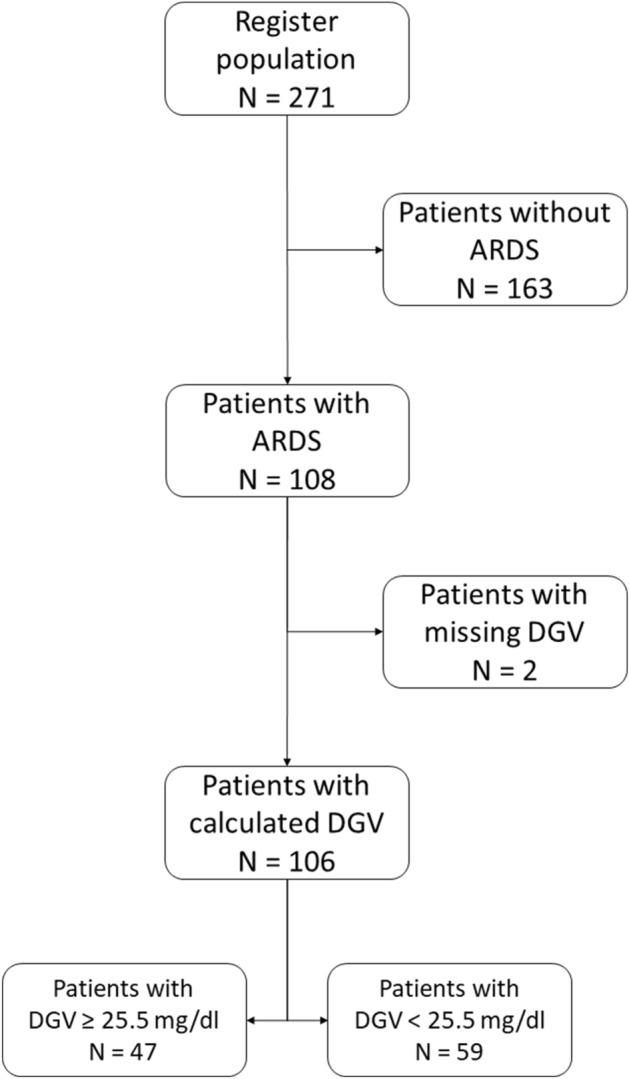
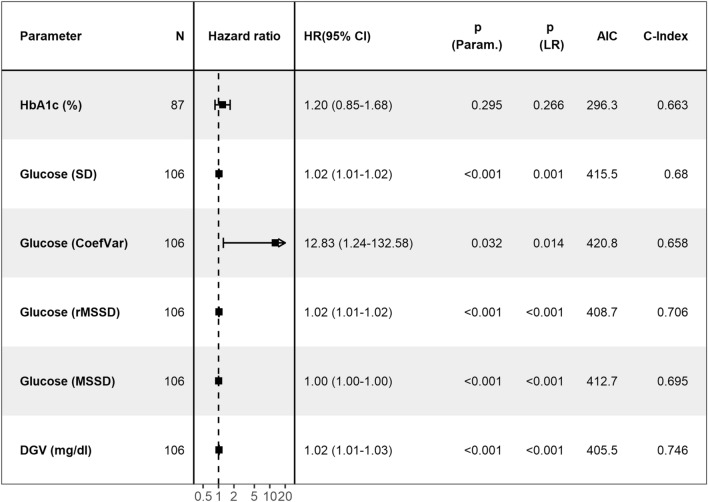
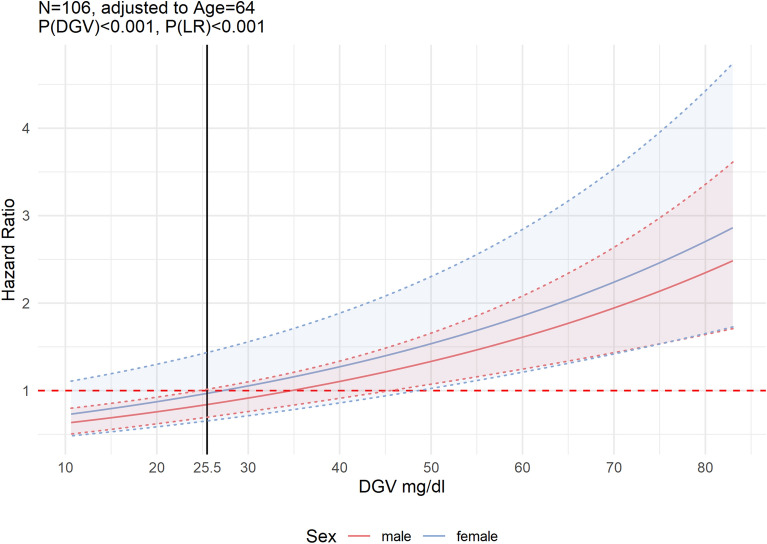
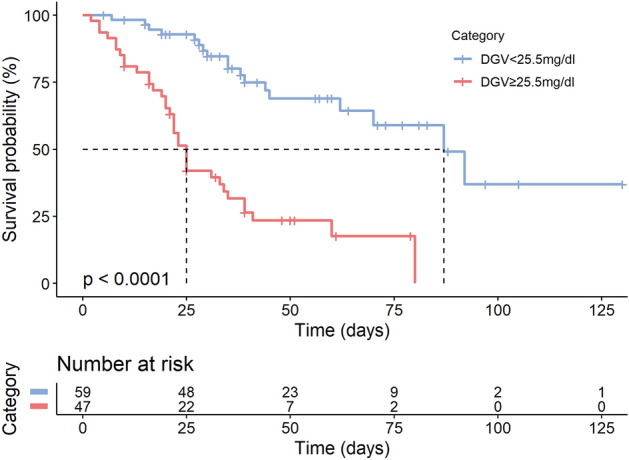
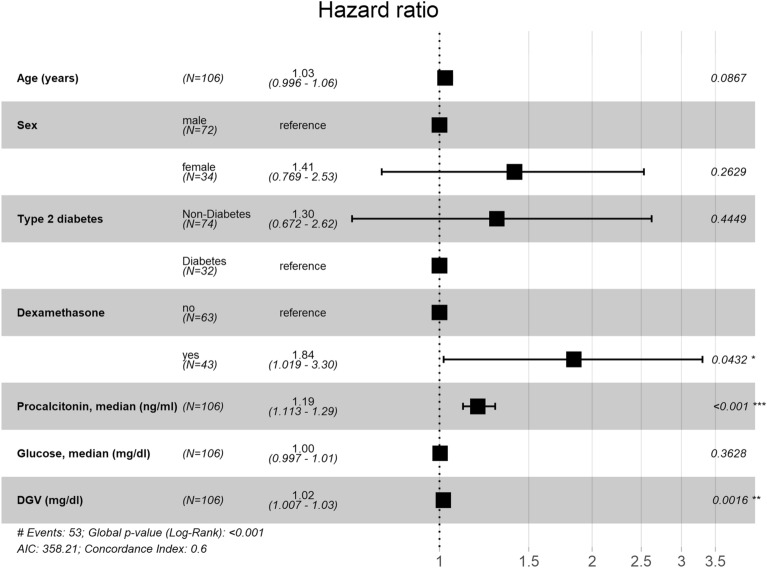
There is high mortality among intensive care unit (ICU) patients with acute respiratory distress syndrome (ARDS) caused by coronavirus disease (COVID-19). Important factors for COVID-19 mortality are diabetes status and elevated fasting plasma glucose (FPG). However, the effect of glycaemic variability on survival has not been explored in patients with COVID-19 and ARDS. This single-centre cohort study compared several metrics of glycaemic variability for goodness-of-fit in patients requiring mechanical ventilation due to COVID-19 ARDS in the ICU at University Hospital Aachen, Germany. 106 patients had moderate to severe ARDS (P/F ratio median [IQR]: 112 [87-148] mmHg). Continuous HRs showed a proportional increase in mortality risk with daily glycaemic variability (DGV). Multivariable unadjusted and adjusted Cox-models showed a statistically significant difference in mortality for DGV (HR: 1.02, (P) < 0.001, LR(P) < 0.001; HR: 1.016, (P) = 0.001, LR(P) < 0.001, respectively). Kaplan-Meier estimators yielded a shorter median survival (25 vs. 87 days) and a higher likelihood of death (75% vs. 31%) in patients with DGV ≥ 25.5 mg/dl (P < 0.0001). High glycaemic variability during ICU admission is associated with significant increase in all-cause mortality for patients admitted with COVID-19 ARDS to the ICU. This effect persisted even after adjustment for clinically predetermined confounders, including diabetes, median procalcitonin and FPG.
© 2022. The Author(s).
Conflict of interest statement
The authors declare no competing interests.
Figures
Similar articles
-
Outcomes of patients with COVID-19 acute respiratory distress syndrome requiring invasive mechanical ventilation admitted to an intensive care unit in South Africa.S Afr Med J. 2022 Feb 2;112(1):13516. S Afr Med J. 2022. PMID: 35140002
-
Clinical characteristics and day-90 outcomes of 4244 critically ill adults with COVID-19: a prospective cohort study.Intensive Care Med. 2021 Jan;47(1):60-73. doi: 10.1007/s00134-020-06294-x. Epub 2020 Oct 29. Intensive Care Med. 2021. PMID: 33211135 Free PMC article.
-
Risk Factors Associated With Mortality Among Patients With COVID-19 in Intensive Care Units in Lombardy, Italy.JAMA Intern Med. 2020 Oct 1;180(10):1345-1355. doi: 10.1001/jamainternmed.2020.3539. JAMA Intern Med. 2020. PMID: 32667669 Free PMC article.
-
Outcomes of acute respiratory distress syndrome in COVID-19 patients compared to the general population: a systematic review and meta-analysis.Expert Rev Respir Med. 2021 Oct;15(10):1347-1354. doi: 10.1080/17476348.2021.1920927. Epub 2021 May 5. Expert Rev Respir Med. 2021. PMID: 33882768 Free PMC article.
-
Effect of prone positioning on oxygenation and static respiratory system compliance in COVID-19 ARDS vs. non-COVID ARDS.Respir Res. 2021 Aug 6;22(1):220. doi: 10.1186/s12931-021-01819-4. Respir Res. 2021. PMID: 34362368 Free PMC article. Review.
Cited by
-
Association between inpatient glycemic variability and COVID-19 mortality: a prospective study.Diabetol Metab Syndr. 2023 Sep 11;15(1):185. doi: 10.1186/s13098-023-01157-z. Diabetol Metab Syndr. 2023. PMID: 37697407 Free PMC article.
-
High glycemic variability is associated with a reduced T cell cytokine response to influenza A virus.iScience. 2024 Oct 11;27(11):111166. doi: 10.1016/j.isci.2024.111166. eCollection 2024 Nov 15. iScience. 2024. PMID: 39524368 Free PMC article.
-
Effect of glucose variability on the mortality of adults aged 75 years and over during the first year of the COVID-19 pandemic.BMC Geriatr. 2024 Jun 20;24(1):533. doi: 10.1186/s12877-024-05149-0. BMC Geriatr. 2024. PMID: 38902647 Free PMC article.
-
Measurement of serum 1,5-AG provides insights for diabetes management and the anti-viral immune response.Cell Mol Life Sci. 2025 Feb 6;82(1):71. doi: 10.1007/s00018-024-05568-7. Cell Mol Life Sci. 2025. PMID: 39912911 Free PMC article.
-
Circulating mid-regional proadrenomedullin is a predictor of mortality in patients with COVID-19: a systematic review and meta-analysis.BMC Infect Dis. 2023 May 8;23(1):305. doi: 10.1186/s12879-023-08275-z. BMC Infect Dis. 2023. PMID: 37158819 Free PMC article.
References
Publication types
MeSH terms
Substances
LinkOut - more resources
Full Text Sources
Medical
Miscellaneous
