. 2022 Jul:49:101495.
doi: 10.1016/j.eclinm.2022.101495. Epub 2022 Jun 9.

A multiplex protein panel assay for severity prediction and outcome prognosis in patients with COVID-19: An observational multi-cohort study

Affiliations

A multiplex protein panel assay for severity prediction and outcome prognosis in patients with COVID-19: An observational multi-cohort study

Ziyue Wang et al. EClinicalMedicine. 2022 Jul.

Abstract

Background: Global healthcare systems continue to be challenged by the COVID-19 pandemic, and there is a need for clinical assays that can help optimise resource allocation, support treatment decisions, and accelerate the development and evaluation of new therapies.

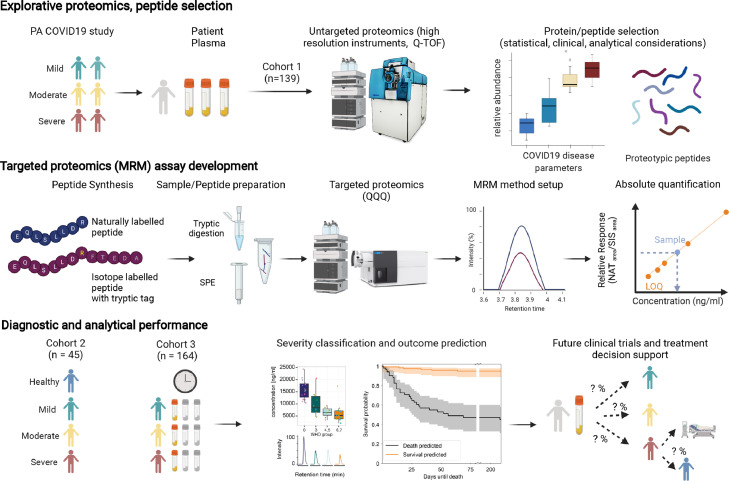
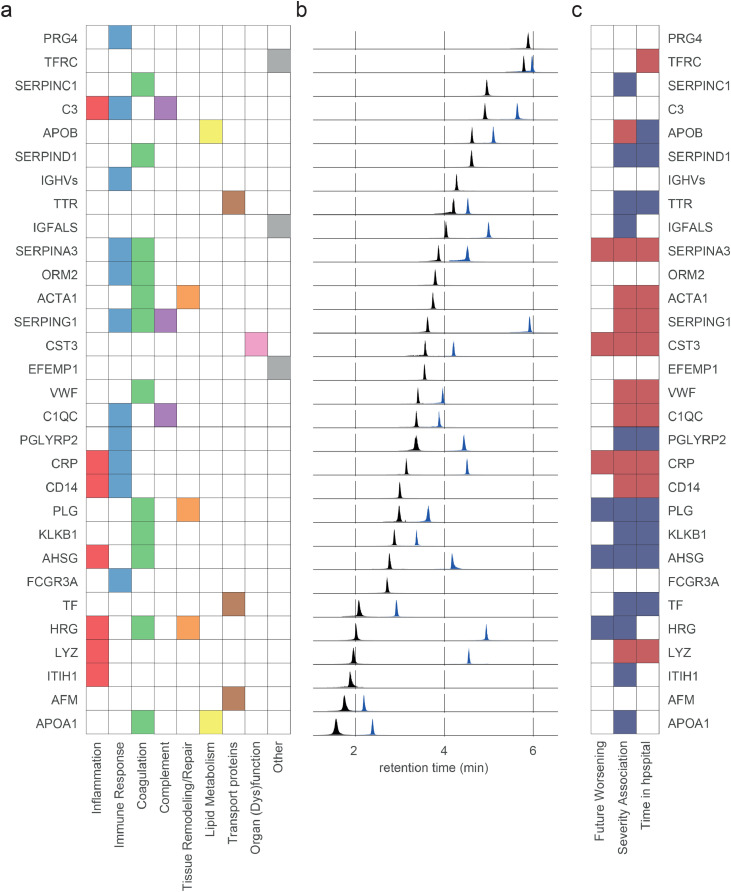
Methods: We developed a multiplexed proteomics assay for determining disease severity and prognosis in COVID-19. The assay quantifies up to 50 peptides, derived from 30 known and newly introduced COVID-19-related protein markers, in a single measurement using routine-lab compatible analytical flow rate liquid chromatography and multiple reaction monitoring (LC-MRM). We conducted two observational studies in patients with COVID-19 hospitalised at Charité - Universitätsmedizin Berlin, Germany before (from March 1 to 26, 2020, n=30) and after (from April 4 to November 19, 2020, n=164) dexamethasone became standard of care. The study is registered in the German and the WHO International Clinical Trials Registry (DRKS00021688).

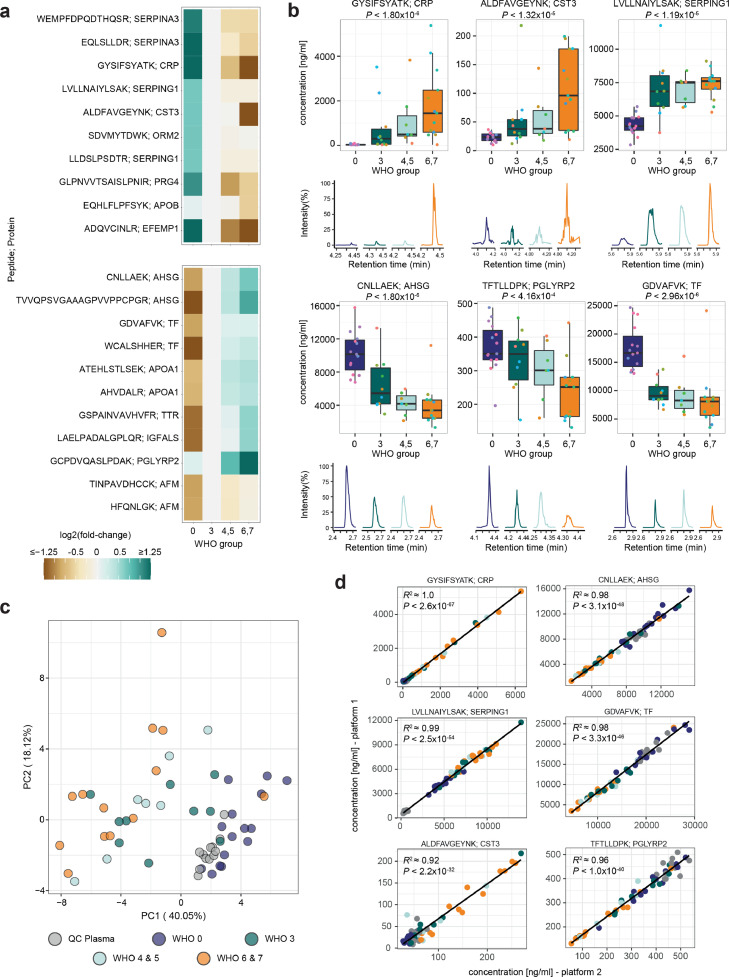
Findings: The assay produces reproducible (median inter-batch CV of 10.9%) absolute quantification of 47 peptides with high sensitivity (median LLOQ of 143 ng/ml) and accuracy (median 96.8%). In both studies, the assay reproducibly captured hallmarks of COVID-19 infection and severity, as it distinguished healthy individuals, mild, moderate, and severe COVID-19. In the post-dexamethasone cohort, the assay predicted survival with an accuracy of 0.83 (108/130), and death with an accuracy of 0.76 (26/34) in the median 2.5 weeks before the outcome, thereby outperforming compound clinical risk assessments such as SOFA, APACHE II, and ABCS scores.

Interpretation: Disease severity and clinical outcomes of patients with COVID-19 can be stratified and predicted by the routine-applicable panel assay that combines known and novel COVID-19 biomarkers. The prognostic value of this assay should be prospectively assessed in larger patient cohorts for future support of clinical decisions, including evaluation of sample flow in routine setting. The possibility to objectively classify COVID-19 severity can be helpful for monitoring of novel therapies, especially in early clinical trials.

Funding: This research was funded in part by the European Research Council (ERC) under grant agreement ERC-SyG-2020 951475 (to M.R) and by the Wellcome Trust (IA 200829/Z/16/Z to M.R.). The work was further supported by the Ministry of Education and Research (BMBF) as part of the National Research Node 'Mass Spectrometry in Systems Medicine (MSCoresys)', under grant agreements 031L0220 and 161L0221. J.H. was supported by a Swiss National Science Foundation (SNSF) Postdoc Mobility fellowship (project number 191052). This study was further supported by the BMBF grant NaFoUniMedCOVID-19 - NUM-NAPKON, FKZ: 01KX2021. The study was co-funded by the UK's innovation agency, Innovate UK, under project numbers 75594 and 56328.

Keywords: Biomarker; COVID-19; Clinical disease progression; Disease prognosis; LC-MS/MS; Machine learning; SARS-CoV2; Severity stratification; Targeted proteomics.


Conflict of interest statement

EM Scientific Limited (t/a Inoviv) and Charité – Universitätsmedizin Berlin (Ziyue Wang, Michael Mülleder, Vadim Demichev, Johannes Hartl and Markus Ralser) filed joint patent applications for the protein panel assay described herein - United States Application No: 63/156291, 63/283787 and 17/685756. Leif-Erik Sander received honoraria for lectures from Boehringer Ingelheim, Novartis, Berlin Chemie, GSK, Merck, Novartis, Sanofi. Ernestas Sirka and Adam Cryar are/were employees of EM Scientific Limited (t/a Inoviv). Daniel Blake, Rebekah L Sayers and Catherine S Lane are employees of SCIEX. Christoph Mueller and Johannes Zeiser are employees of Agilent Technologies.

Figures

Figure 1
Figure 1
Schematic overview from peptide selection, to development and application of a COVID-19 biomarker panel. Top panel: Selection of 50 peptides derived from 30 plasma proteins as measured by discovery proteomics in a research setting, in the PA-COVID19 study cohort. Included proteins/peptides were selected accounting for their performance in the exploratory cohort, clinical, and analytical parameters. Middle panel: To generate an assay suitable for routine clinical laboratories, we established a targeted LC-MRM assay for conventional triple-quadrupole mass spectrometers, running reversed phase chromatography, at a high flow-rate. The assay was optimised using synthetic peptides, and allows for absolute quantification using stable isotope labelled internal standards (‘AQUA peptides’48) with a short tryptic tag, to account for the sample preparation (tryptic digest) efficiency. Bottom panel: The assay was applied to two observational cohorts: a well balanced second (‘1st wave’) COVID-19 cohort, with samples being measured in two laboratories, and a larger longitudinal cohort (‘2nd wave’), with patients treated at the Charité Hospital, a national medical reference centre.
Figure 2
Figure 2
Selected peptides/proteins analysed by liquid chromatography, multiple reaction monitoring. a) Analysed proteins and their associated COVID-19-pathology-related processes as curated from literature. b) Extracted ion chromatograms (EIC) highlighting the chromatographic spread of the applied MRM transitions selected as quantifiers for the indicated marker peptides. Each EIC was normalised to the maximum intensity of the respective peptide. Note that the majority of proteins are captured by two peptides (arbitrarily coloured as blue, black). c) Proteins selected for the panel assay are associated with COVID-19 disease parameters, including severity and progression, and link to COVID-19 related processes. Coloured tiles indicate significant associations, with red/blue highlighting that the respective protein is up- or down-regulated in COVID-19 infected individuals in discovery proteomic data of cohort 1. For data on individual peptides, see Supplementary Figures 2-4.
Figure 3
Figure 3
The protein biomarker assay reproducibly reports disease severity in a COVID-19 cohort. a) The established assay was applied to citrate plasma samples, collected for a balanced COVID-19 cohort studied during the first wave of the pandemic,, (‘Cohort 2’) consisting of healthy volunteers (n=15, WHO 0), COVID-19 affected individuals requiring hospitalisation but no oxygen therapy (n=10 (WHO3), COVID-19 affected individuals requiring hospitalisation and non-invasive oxygen therapy (n=4, WHO4; n=3 WHO5), and severely affected hospitalised individuals requiring mechanical ventilation (n=3 (WHO6), n=10 (WHO7) as well as QC plasma samples (n=12). Peptides with a significant concentration change (up- (top panel) and down-regulated (bottom panel)) distinguish healthy from infected individuals, as well as mild from severe forms of the disease. Heatmap displays the log2 fold-change of the indicated peptide to its median concentration in patients with a severity score of WHO3. Only significant peptides (adjusted P < 0.05) with an arbitrary fold-change difference <1/1.5 or >1.5 are shown, and log2 fold-changes <-1.25 or >1.25 are indicated by the same respective colour. For additional information, see Supplementary Figure 5. b) Visualisation of the response to COVID-19 based on selected peptides indicating different COVID-19 severity trends (changing with severity expressed according to the WHO ordinal scale (left, middle panel), and differentiating healthy from COVID-19 infected individuals (right panel)). Boxplots display the absolute concentration of selected peptides in patients in different severity groups as explained in (a). The extracted ion chromatograms (EIC) display the response of representative samples of individuals classified according to the treatment escalation WHO=0, WHO=3, WHO=5 and WHO=7. c) Unsupervised clustering by principal component analysis (PCA) based on the absolute concentration of 39 quantified peptides clusters patients with COVID-19 by severity. The peptide ADQVCINLR contained missing values and was omitted. d) Analytical reproducibility of the assay in two laboratories, running two different LC-MS/MS platforms, with independently optimised MRM transitions. Shown are linear correlations (pearson correlation) between absolute peptide concentrations. Selected peptides and colour code like in (c). For boxplots, the median is marked by a solid line, hinges mark the 25th and 75th percentiles, and whiskers show all values that, at maximum, fall within 1.5 times the interquartile range.
Figure 4
Figure 4
Diagnostic and analytical performance of the assay on a COVID-19 inpatient cohort treated during the 2nd wave of the pandemic. a) Quantitative performance (signal stability), during the measurement of 548 plasma proteome samples of patient Cohort 3 evaluated based on n=85 QC samples (coloured in grey, pool of COVID-19 samples as described in24) injected throughout the acquisition. Shown are the log2 fold-change of the absolute concentration for each of the 48 quantified peptides normalised to the median of the QC samples for the respective peptide. b) Peptide log2 absolute concentration fold change of two selected down- (AHSG, PGLYRP2) and two up-regulated (CRP, CST3) proteins for all samples acquired for the cohort described in (a). QC samples are shown in grey, all other samples are coloured according to the corresponding COVID-19 WHO treatment escalation score; rug plots on the right side of each peptide indicate the respective distributions. c) The 8 most significantly upregulated (left panel) and down-regulated (right panel) peptides indicative of COVID-19 disease severity, expressed as the treatment level according to the WHO scale. For illustration purposes, only one peptide per protein is displayed and one outlier sample in peptide EITALAPSMK was removed. The quantities of all quantified peptides are illustrated in Supplementary Figure 7. d) Confusion-matrix-like representation of the outcome of a multi-class classification model (SVM-based) trained to differentiate three WHO severity groups: grade 3, grades 4/5, and grades 6/7. Predictions were done on withheld samples that were not used for training the models (accuracy = 0.665, balanced accuracy = 0.656). The percentage denotes how many samples within each WHO severity group are assigned to each square. The positions of the points within each square were chosen randomly. Colour scheme according to (c). e) ROC-curves for the prediction of the WHO severity group from the first time point measured for every patient (grade 3, blue; grades 4/5, orange; grades 6/7, green). Dotted lines denote the micro (magenta) and macro average (pink) ROC-curves. Data shown and analysed in c)-d) are from the first time-point obtained for each individual; n=36 (WHO 3), n=47 (WHO 4), n=27 (WHO 5), n=16 (WHO 6), n=38 (WHO7). For boxplots, the median is marked by a solid line, hinges mark the 25th and 75th percentiles, and whiskers show all values that, at maximum, fall within 1.5 times the interquartile range.
Figure 5
Figure 5
COVID-19 outcome prognosis. a) Receiver operating characteristic (ROC) curve for the prediction of survival and non-survival, from a single plasma sample (first sample measured for every patient, n=164) using an SVM-classifier. The blue curve denotes the model trained and benchmarked on measured proteomic data. The other curves denote models based on single severity scores (Sequential Organ Failure Assessment score (SOFA, purple, n=91), Acute Physiology And Chronic Health Evaluation (APACHE II, green, n=69), Charlson Comorbidity Index (CCI, cyan, n=157), and Age, Biomarkers, Clinical history, Sex score (ABCS, pink (admission, n=135) and orange (first sample, n=161)). b) Boxplot of the decision function of the SVM for every patient sorted according to the outcome and coloured with respect to the WHO grade at the day the sample was taken. Colour scheme according to Figure 4c. The red dashed circle indicates three patients with a high chance of predicted survival who died. These patients all were WHO4 patients with ‘do not intubate (DNI)’ orders in place due to other medical conditions. Therapy was therefore not escalated to invasive ventilation. The MRM assay classified those patients as milder COVID-19 cases, compared to other non-survivors. The cut point for the binary metrics is highlighted. Sensitivity = 0.765, (26/34); Specificity = 0.831 (108/130). Indicated P value reports differences between decision function distributions (survival vs. death) as calculated with a Mann-Whitney U rank test. c) Kaplan-Meier estimate of the survival function for survival predicted cases (orange) or non-survival predicted cases (black) with confidence interval (alpha=0.05). Patient survival data for each timepoint is provided in Supplementary Tables 13-15. All predictions were done on withheld samples that were not used for training the models. For boxplots, the median is marked by a solid line, hinges mark the 25th and 75th percentiles, and whiskers show all values that, at maximum, fall within 1.5 times the interquartile range.

References

    1. Pouwels KB, Pritchard E, Matthews PC, et al. Effect of Delta variant on viral burden and vaccine effectiveness against new SARS-CoV-2 infections in the UK. Nat Med. 2021 - PMC - PubMed
    1. Kearns P, Siebert S, Willicombe M, et al. Examining the Immunological Effects of COVID-19 Vaccination in Patients with Conditions Potentially Leading to Diminished Immune Response Capacity – The OCTAVE Trial 2021.
    1. Chemaitelly H, Tang P, Hasan MR, et al. Waning of BNT162b2 Vaccine Protection against SARS-CoV-2 Infection in Qatar. N Engl J Med. 2021 - PMC - PubMed
    1. Levin EG, Lustig Y, Cohen C, et al. Waning Immune Humoral Response to BNT162b2 Covid-19 Vaccine over 6 Months. N Engl J Med. 2021 - PMC - PubMed
    1. Tober-Lau P, Schwarz T, Vanshylla K, et al. Long-term immunogenicity of BNT162b2 vaccination in older people and younger health-care workers. Lancet Respir Med. 2021;9:e104–e105. - PMC - PubMed