

Prenatal exposure to multiple organochlorine compounds and childhood body mass index
- PMID: 35702503
- PMCID: PMC9187184
- DOI: 10.1097/EE9.0000000000000201
Prenatal exposure to multiple organochlorine compounds and childhood body mass index
Abstract
Background: Prenatal exposure to organochlorine compounds (OCs) has been associated with increased childhood body mass index (BMI); however, only a few studies have focused on longitudinal BMI trajectories, and none of them used multiple exposure mixture approaches.
Aim: To determine the association between in-utero exposure to eight OCs and childhood BMI measures (BMI and BMI z-score) at 4 years and their yearly change across 4-12 years of age in 279 Rhea child-mother dyads.
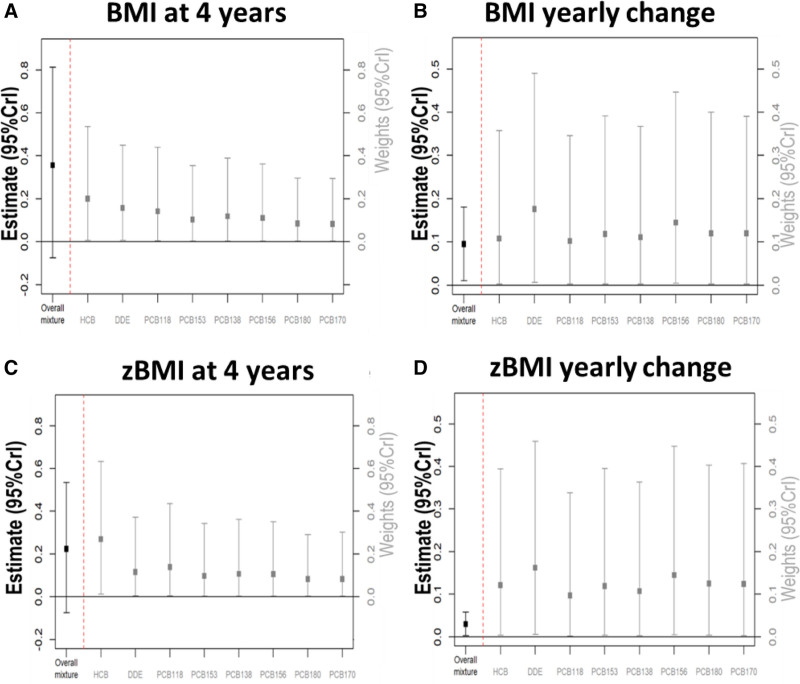
Methods: We applied three approaches: (1) linear mixed-effect regressions (LMR) to associate individual compounds with BMI measures; (2) Bayesian weighted quantile sum regressions (BWQSR) to provide an overall OC mixture association with BMI measures; and (3)Bayesian varying coefficient kernel machine regressions (BVCKMR) to model nonlinear and nonadditive associations.
Results: In the LMR, yearly change of BMI measures was consistently associated with a quartile increase in hexachlorobenzene (HCB) (estimate [95% Confidence or Credible interval] BMI: 0.10 [0.06, 0.14]; BMI z-score: 0.02 [0.01, 0.04]). BWQSR results showed that a quartile increase in mixture concentrations was associated with yearly increase of BMI measures (BMI: 0.10 [0.01, 0.18]; BMI z-score: 0.03 [0.003, 0.06]). In the BVCKMR, a quartile increase in dichlorodiphenyldichloroethylene concentrations was associated with higher BMI measures at 4 years (BMI: 0.33 [0.24, 0.43]; BMI z-score: 0.19 [0.15, 0.24]); whereas a quartile increase in HCB and polychlorinated biphenyls (PCB)-118 levels was positively associated with BMI measures yearly change (BMI: HCB:0.10 [0.07, 0.13], PCB-118:0.08 [0.04, 012]; BMI z-score: HCB:0.03 [0.02, 0.05], PCB-118:0.02 [0.002,04]). BVCKMR suggested that PCBs had nonlinear relationships with BMI measures, and HCB interacted with other compounds.
Conclusions: All analyses consistently demonstrated detrimental associations between prenatal OC exposures and childhood BMI measures.
Keywords: Bayesian varying coefficient kernel machine regressions; Bayesian weighted quantile sum regressions; Body mass index; Chemical mixture; Organochlorine compounds; Outcome trajectories.
Copyright © 2022 The Authors. Published by Wolters Kluwer Health, Inc. on behalf of The Environmental Epidemiology. All rights reserved.
Conflict of interest statement
The authors declare that they have no conflicts of interest with regard to the content of this report.
Figures


References
-
- Hedley AA, Ogden CL, Johnson CL, Carroll MD, Curtin LR, Flegal KM. Prevalence of overweight and obesity among US children, adolescents, and adults, 1999-2002. JAMA. 2004;291:2847–2850. - PubMed
-
- Dong GH, Qian Z, Liu MM, et al. Ambient air pollution and the prevalence of obesity in Chinese children: the seven northeastern cities study. Obesity. 2014;22:795–800. - PubMed
-
- Global action plan on physical activity 2018–2030: more active people for a healthier world. Geneva: World Health Organization; 2018. Licence: CC BY-NC-SA 3.0 IGO.
-
- Must A, Strauss RS. Risks and consequences of childhood and adolescent obesity. Int J Obes Relat Metab Disord. 1999;23 Suppl 2:S2–11. - PubMed
Grants and funding
LinkOut - more resources
Full Text Sources