. 2022 May 20;3(2):tgac020.
doi: 10.1093/texcom/tgac020. eCollection 2022.

Pattern learning reveals brain asymmetry to be linked to socioeconomic status

Affiliations

Pattern learning reveals brain asymmetry to be linked to socioeconomic status

Timm B Poeppl et al. Cereb Cortex Commun. .

Abstract

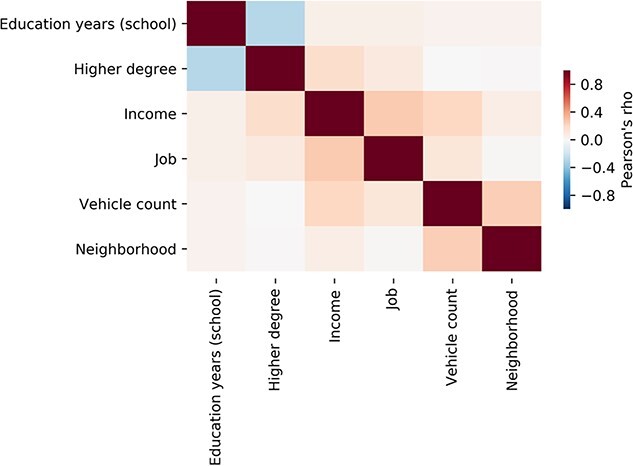
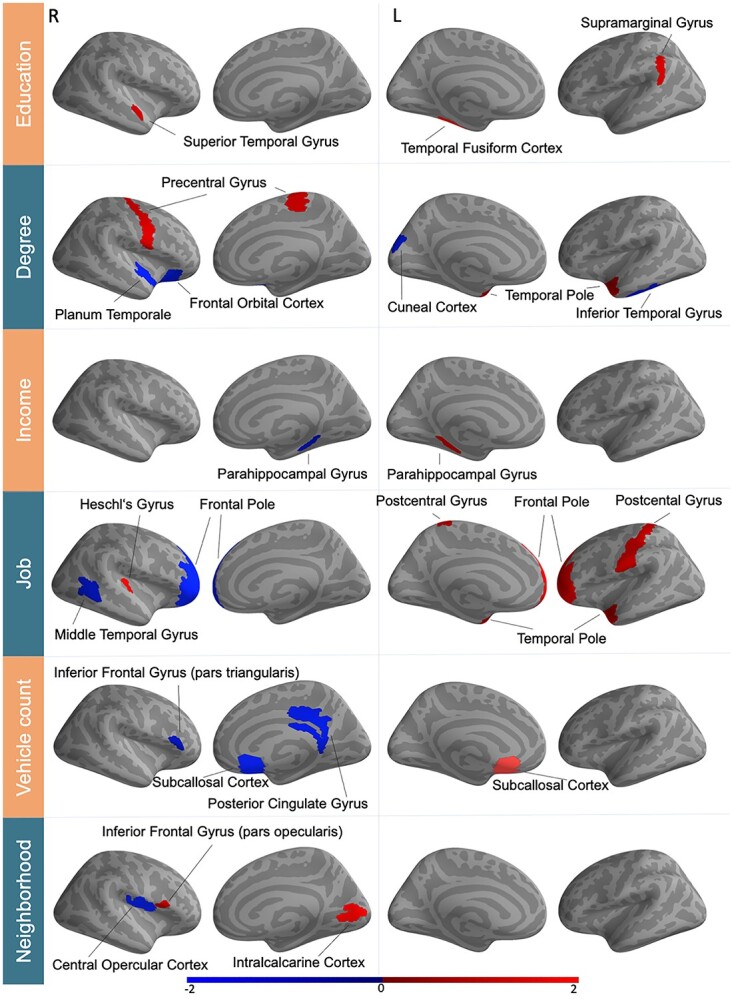
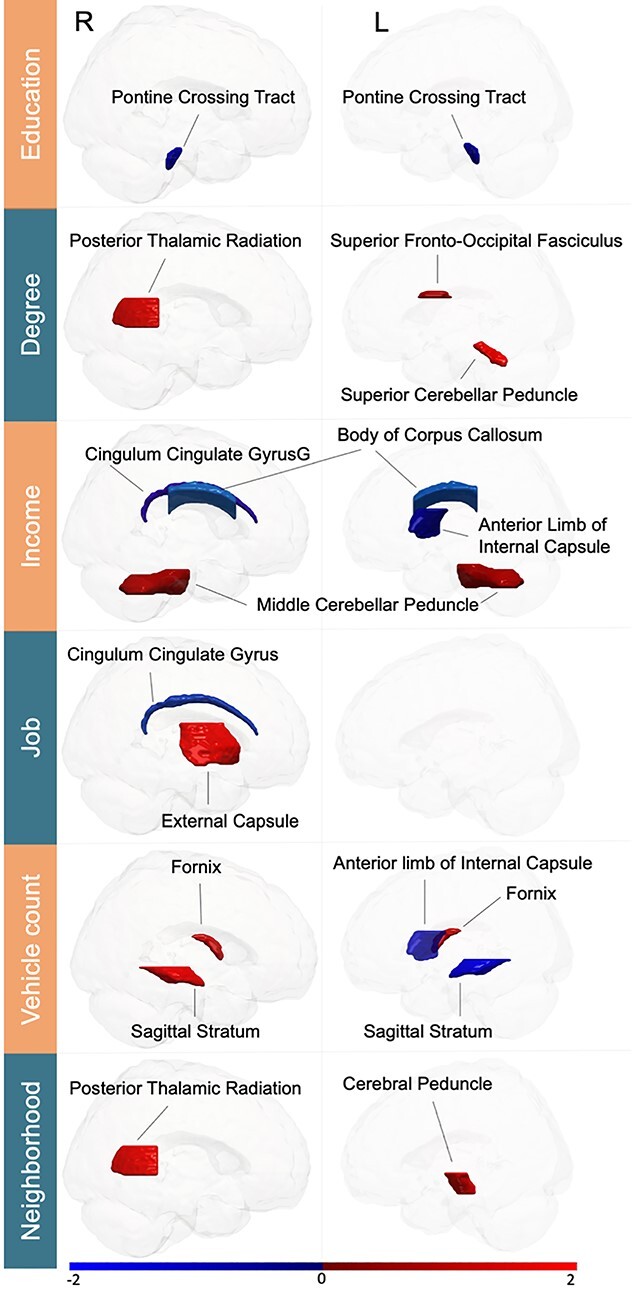
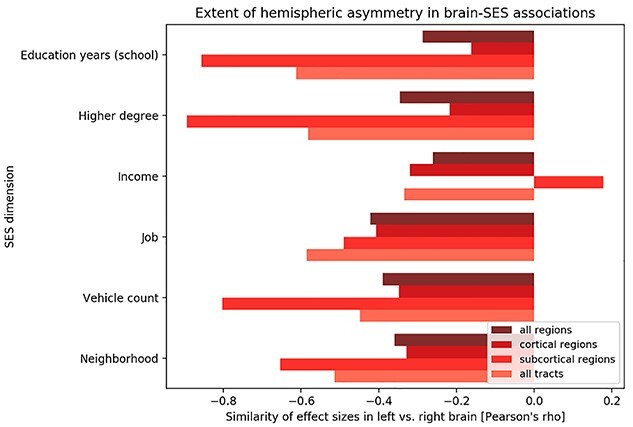
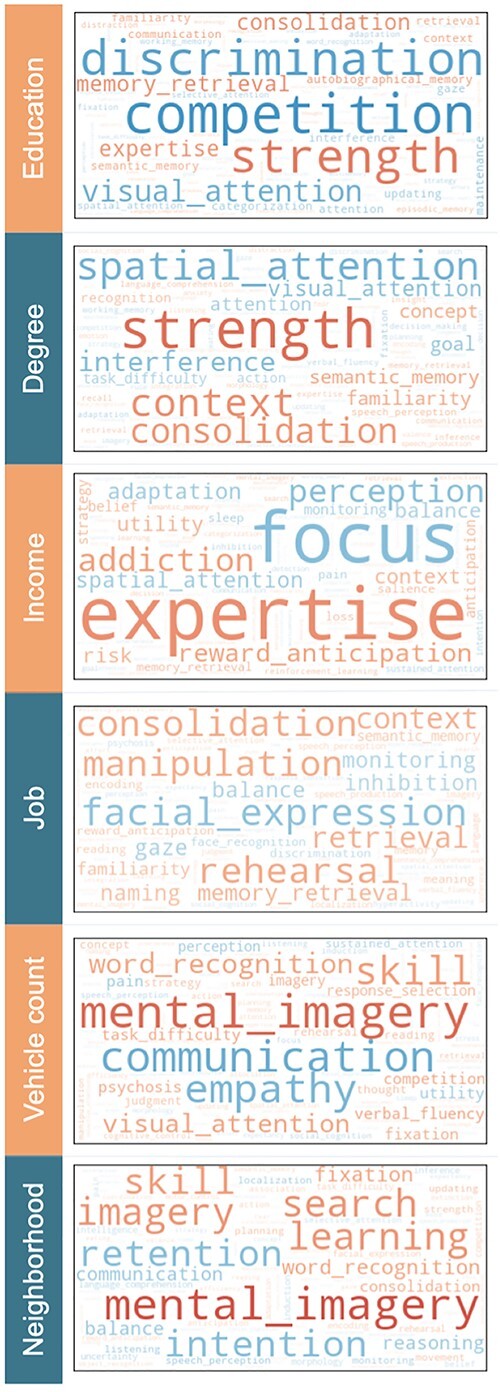
Socioeconomic status (SES) anchors individuals in their social network layers. Our embedding in the societal fabric resonates with habitus, world view, opportunity, and health disparity. It remains obscure how distinct facets of SES are reflected in the architecture of the central nervous system. Here, we capitalized on multivariate multi-output learning algorithms to explore possible imprints of SES in gray and white matter structure in the wider population (n ≈ 10,000 UK Biobank participants). Individuals with higher SES, compared with those with lower SES, showed a pattern of increased region volumes in the left brain and decreased region volumes in the right brain. The analogous lateralization pattern emerged for the fiber structure of anatomical white matter tracts. Our multimodal findings suggest hemispheric asymmetry as an SES-related brain signature, which was consistent across six different indicators of SES: degree, education, income, job, neighborhood and vehicle count. Hence, hemispheric specialization may have evolved in human primates in a way that reveals crucial links to SES.

Keywords: brain lateralization; hemispheric asymmetry; machine learning; multi-output pattern learning; population neuroscience; socioeconomic status.


Figures

Fig. 1
Fig. 1
Mutual relationships between different indicators of SES. This exploratory analysis in 10.000 UK biobank participants shows that socioeconomic traits relate to a complex constellation of social, demographic, and financial aspects. Pearson’s correlation shows that these factors are moderately interrelated. The behavioral markers thus capture largely complementary aspects of an individual’s standing in society (Farah 2018). A negative relation between the indices of higher degree and education years is expected since education years only count time in school (not college or university) (see Materials and Methods section). The color tones indicate Pearson’s correlation coefficients ϱ. All index–index relations yielded a ϱ < 0.5. These descriptions thus indicate that our SES dimensions involve mostly specific, but also a degree of shared variation across participants. For mixture deconvolution of joint and distinct information in the SES indicators, see Supplementary Fig. 1.
Fig. 2
Fig. 2
Population variability in SES shows imprints in regional gray matter morphology. Supervised learning algorithms identified a variety of multivariate patterns between 111 gray matter regions and SES indicators. These brain–behavior associations (all significant at P < 0.001, after explicitly considering multiple comparisons) uncovered both positive (red) and negative (blue) direction. Certain regions, including the left caudate and left temporal pole in particular, were associated with several SES determinants. These brain manifestations uncover similarity and idiosyncrasies between the six examined SES indicators. The color bar represents z-scores. R/L = right/left hemisphere. For full effect sizes and bootstrap uncertainty intervals used to assess significance, see Supplementary Tables 2–4.
Fig. 3
Fig. 3
Population variability in SES reverberates in white matter tract microstructure. Supervised learning algorithms revealed associations in positive (red) and negative (blue) direction specific to SES indicators across 48 white matter tracts. The identified links to SES involved association, commissural, and projection fibers (all statistically significant at P < 0.001, after explicitly considering multiple comparisons). Three fiber tracts (right cingulum and posterior thalamic radiation, left internal capsule) were robustly associated with multiple SES dimensions. Analogous to our gray matter findings (Fig. 2), these brain substrates of SES in white matter corroborate a complementary composition of single SES dimensions. The color bar represents z-scores. R/L = right/left hemisphere. For full effect sizes and bootstrap uncertainty intervals used to assess significance, see Supplementary Tables 5–7.
Fig. 4
Fig. 4
The left and right brain hemisphere relate to SES factors in opposite ways. All main analyses in our study were based on multivariate multi-output algorithms of six major determinants of SES on brain atlas features. Separate pattern-learning analyses were conducted to explain the SES dimensions based on either a) gray matter volumes of 111 cortical and subcortical regions (Harvard-Oxford atlas; Fig. 2) or b) microstructure of 48 white matter tracts (Johns Hopkins University atlas; Fig. 3). After model building, the formed estimates for the model parameters were summarized for interrogation of systematic interhemispheric effects. To this end, we computed Pearson’s correlation coefficients across the (bootstrap-uncertainty-adjusted) model parameters of brain features that are homologous in the left vs. right brain (x-axis). This post-hoc aggregation across the computed models uncovered notable anti-correlation in the associations of how left-sided and right-sided brain features are linked to interindividual variation in SES. Our observation of hemispherically differentiated brain-SES correspondence held up when considering a) all regions (darkest red tone), b) only cortical regions, c) only subcortical regions, and d) only fiber tracts (lightest red tone). When restricting attention to statistically significant brain-SES associations, rather than the spatial distribution of the full effect sizes, we substantiated evidence for a distributed brain asymmetry pattern of SES (Supplementary Fig. 4).
Fig. 5
Fig. 5
Functional annotation of how SES is linked to the measures of brain architecture. A large-scale database of brain-imaging experiments—Neurosynth—was queried for co-occurrence with ontological terms that map onto the derived gray-matter-wide patterns of SES associations. We computed the similarity between a given term’s functional activity patterns and the obtained brain correlates of SES (red/blue = positive/negative correlation, range = [−0.3, 0.3]). Word size represents the relative magnitude of each brain-concept association. We have also performed this meta-analytic profiling analysis separately for each hemisphere (Supplementary Fig. 9) and for variation unique to each SES dimensions (Supplementary Fig. 10).

References

    1. Adler NE, Boyce T, Chesney MA, Cohen S, Folkman S, Kahn RL, Syme SL. Socioeconomic status and health. The challenge of the gradient. Am Psychol. 1994:49:15–24. - PubMed
    1. Alfaro-Almagro F, Jenkinson M, Bangerter NK, Andersson JLR, Griffanti L, Douaud G, Sotiropoulos SN, Jbabdi S, Hernandez-Fernandez M, Vallee E, et al. Image processing and quality control for the first 10,000 brain imaging datasets from UK biobank. NeuroImage. 2018:166:400–424. - PMC - PubMed
    1. Baker EH. Socioeconomic status, definition. In: Cockerham WC, Dingwall R, Quah SR, editors. The Wiley Blackwell Encyclopedia of health, illness, behavior, and society. John Wiley & Sons, Ltd.; 2014
    1. Boles DB. Socioeconomic status, a forgotten variable in lateralization development. Brain Cogn. 2011:76:52–57. - PubMed
    1. Borchani H, Bielza C, Martinez-Martin P, Larranaga P. Markov blanket-based approach for learning multi-dimensional Bayesian network classifiers: an application to predict the European quality of Life-5 dimensions (EQ-5D) from the 39-item Parkinson's disease questionnaire (PDQ-39). J Biomed Inform. 2012:45:1175–1184. - PubMed

LinkOut - more resources