. 2022 May 19;6(7):bvac082.
doi: 10.1210/jendso/bvac082. eCollection 2022 Jul 1.

ANGT_HUMAN[448-462], an Anorexigenic Peptide Identified Using Plasma Peptidomics

Affiliations

ANGT_HUMAN[448-462], an Anorexigenic Peptide Identified Using Plasma Peptidomics

Sayaka Sasaki et al. J Endocr Soc. .

Abstract

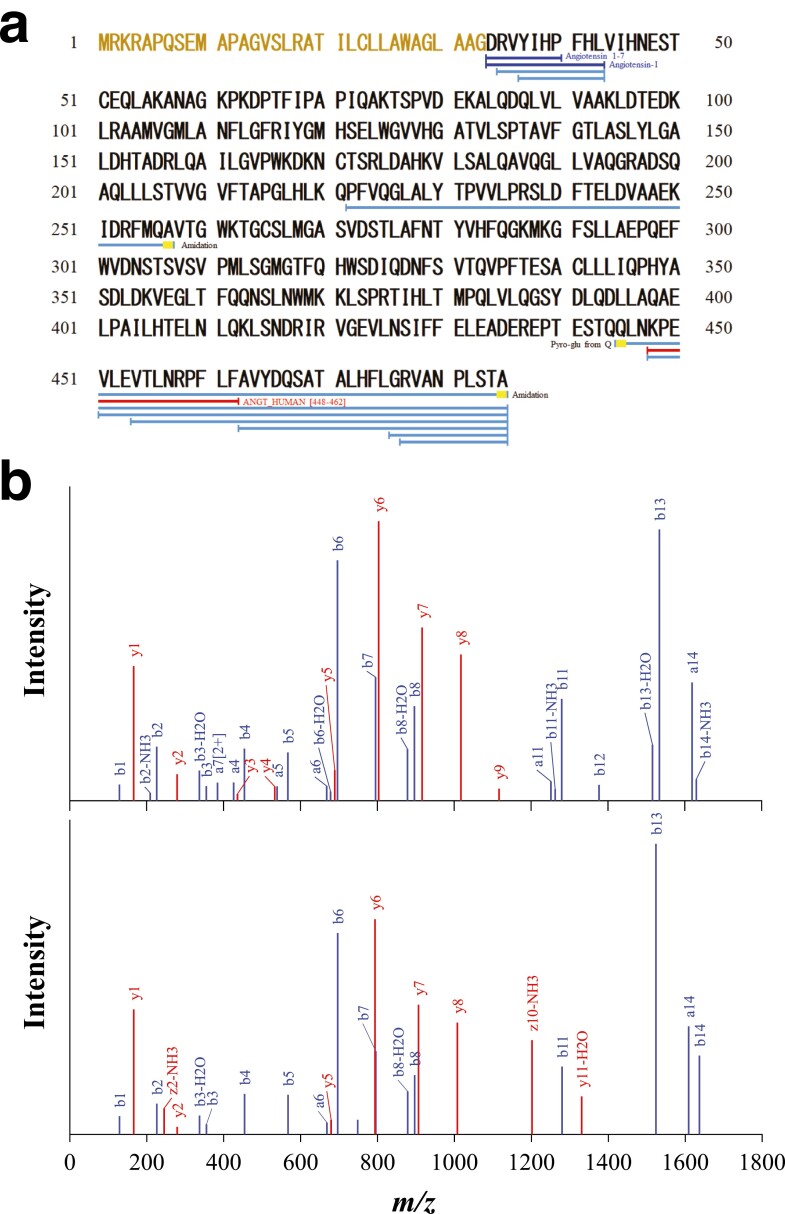
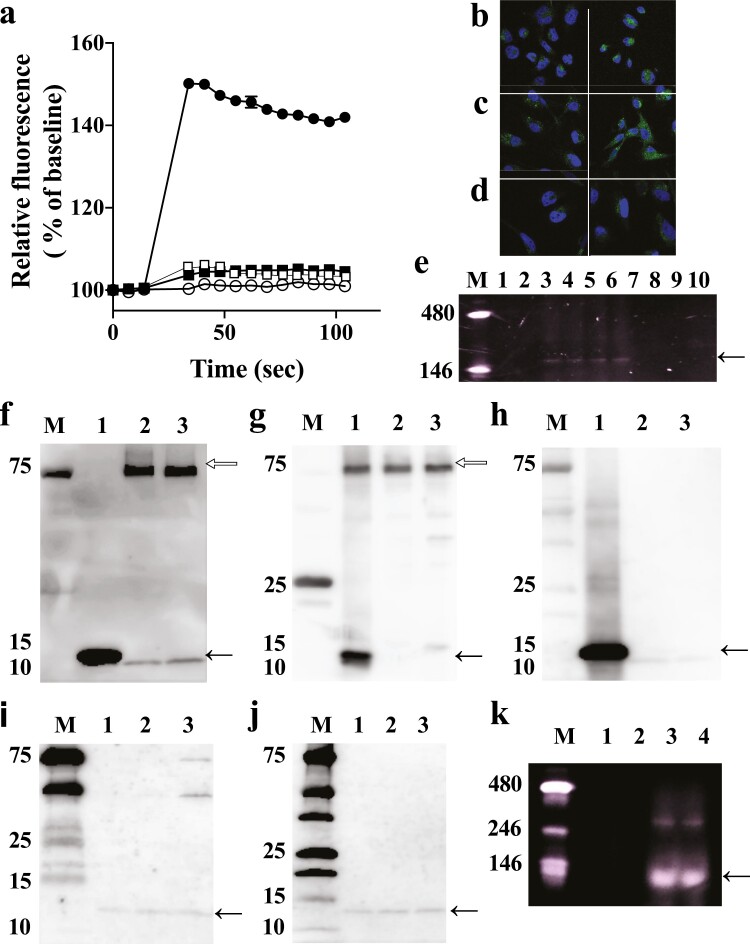
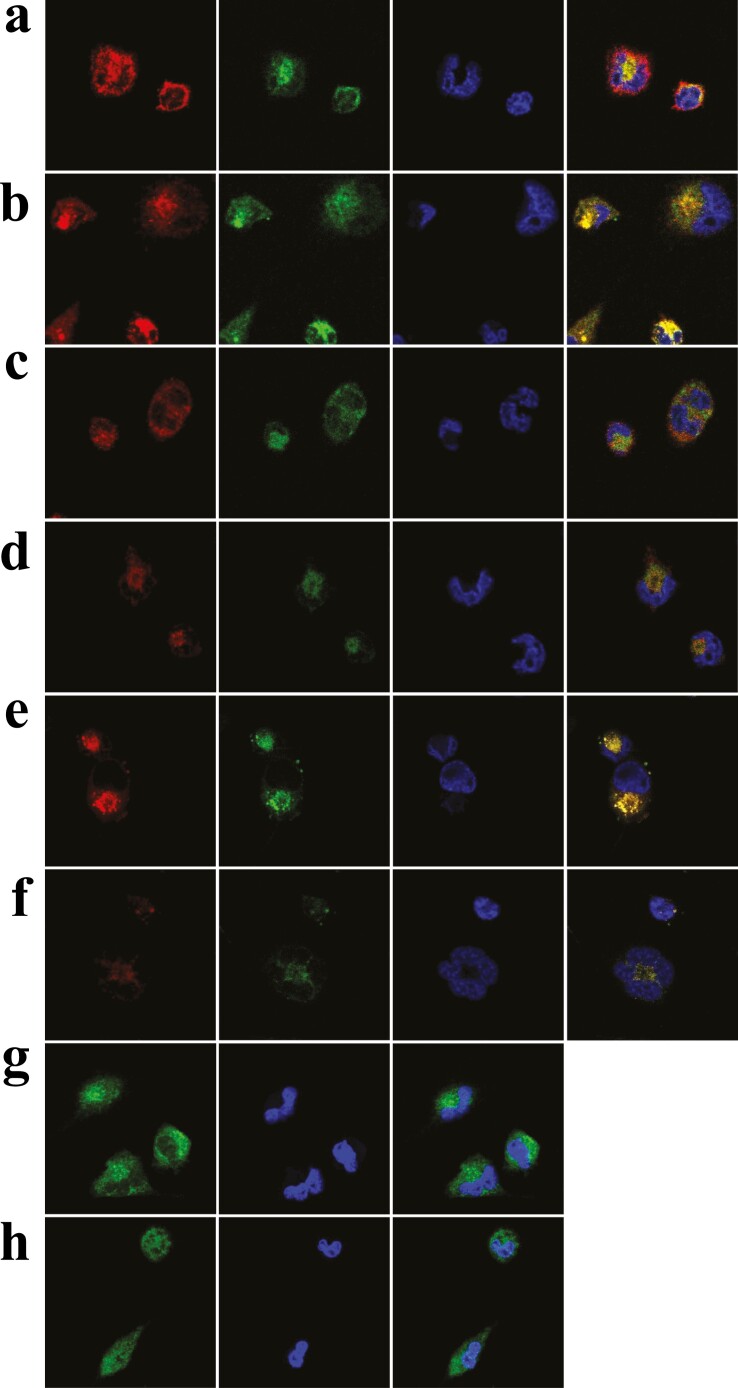
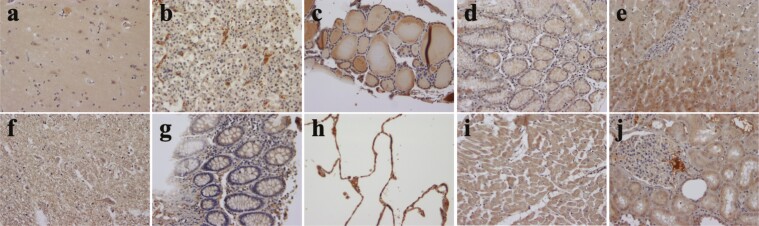
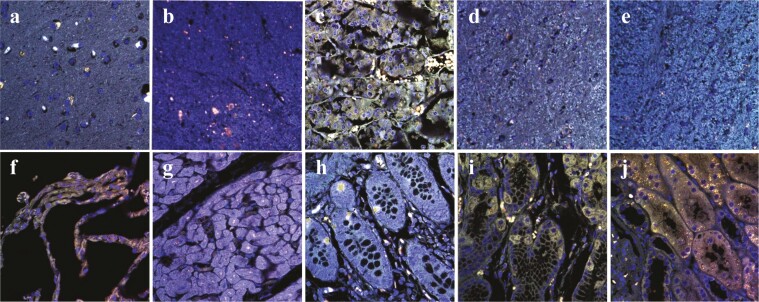
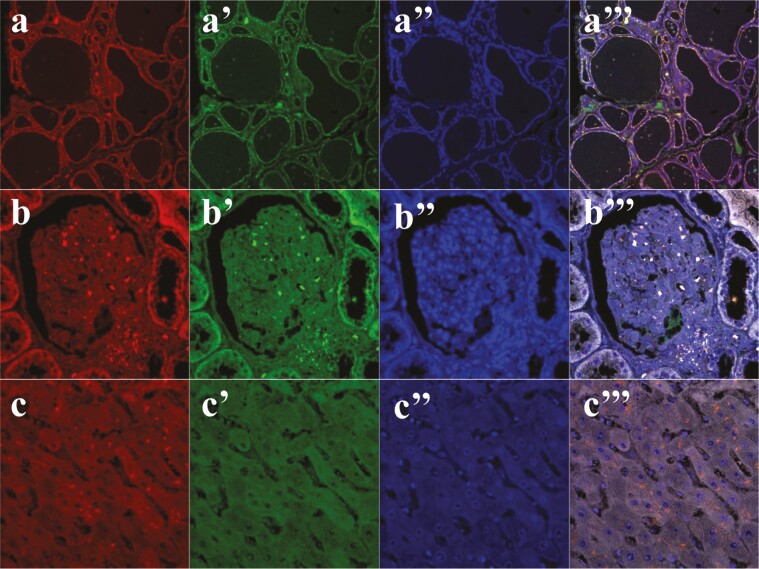
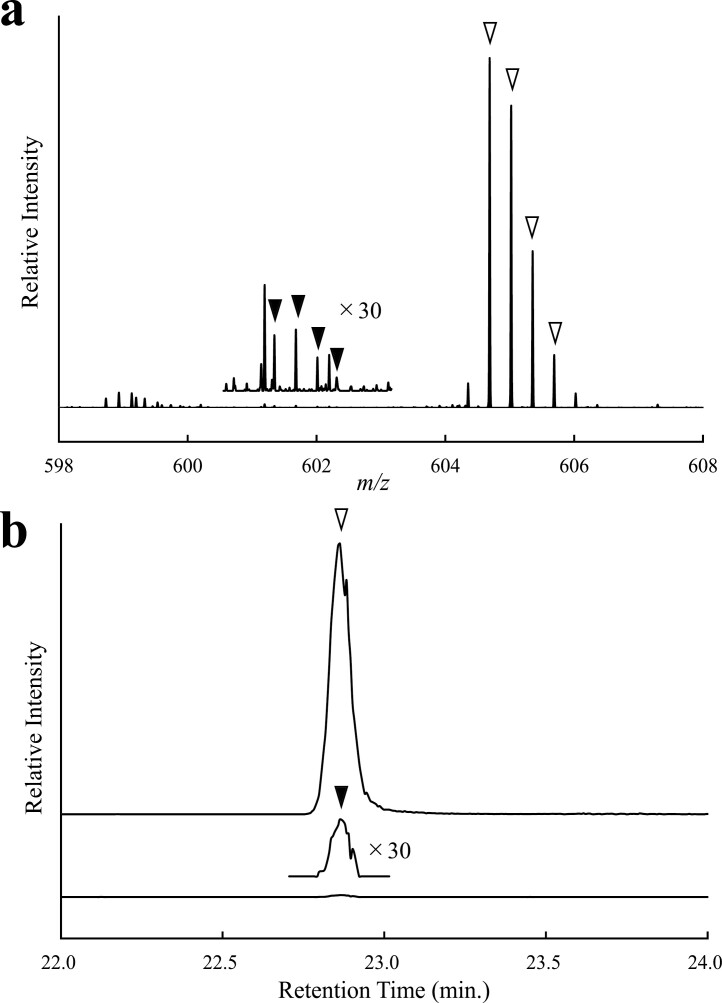
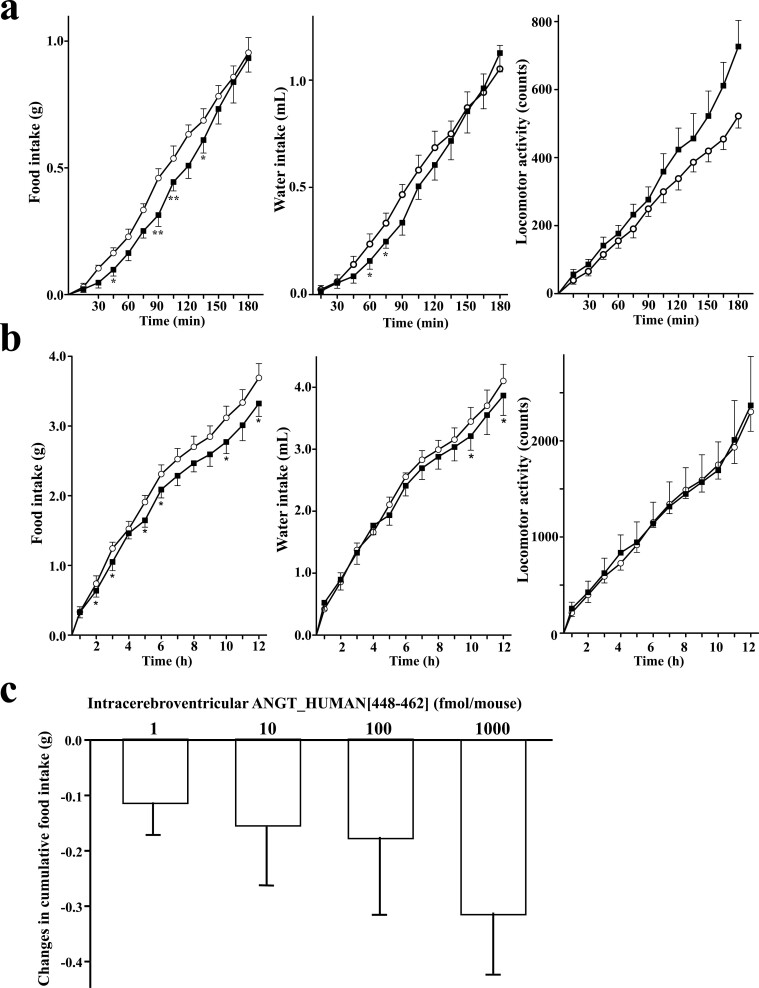
The discovery of bioactive peptides is an important research target that enables the elucidation of the pathophysiology of human diseases and provides seeds for drug discovery. Using a large number of native peptides previously identified using plasma peptidomics technology, we sequentially synthesized selected sequences and subjected them to functional screening using human cultured cells. A 15-amino-acid residue proangiotensinogen-derived peptide, designated ANGT_HUMAN[448-462], elicited cellular responses and bound to cultured human cells. Synthetic fluorescent-labeled and biotinylated ANGT_HUMAN[448-462] peptides were rendered to bind to cell- and tissue-derived proteins and peptide-cell protein complexes were retrieved and analyzed using liquid chromatography-tandem mass spectrometry, revealing the β-subunit of ATP synthase as its cell-surface binding protein. Because ATP synthase mediates the effects of anorexigenic peptides, the ability of ANGT_HUMAN[448-462] to modulate eating behavior in mice was investigated. Both intraperitoneal and intracerebroventricular injections of low doses of ANGT_HUMAN[448-462] suppressed spontaneous food and water intake throughout the dark phase of the diurnal cycle without affecting locomotor activity. Immunoreactive ANGT_HUMAN[448-462], distributed throughout human tissues and in human-derived cells, is mostly co-localized with angiotensin II and is occasionally present separately from angiotensin II. In this study, an anorexigenic peptide, ANGT_HUMAN[448-462], was identified by exploring cell surface target proteins of the human native peptides identified using plasma peptidomics.

Keywords: ANGT_HUMAN[448–462]; angiotensinogen; anorectic peptide; food intake; liquid chromatography–tandem mass spectrometry; plasma peptidomics.


Figures

Figure 1.
Figure 1.
Peptidomic identification of ANGT_HUMAN[448–462] from human plasma. (a) Sequence alignment of ANGT_HUMAN[448–462] (red horizontal line) and other cleaved products of proangiotensinogen identified with an FDR of 0% (blue horizontal lines) using peptidomic analysis. The predicted signal peptide of the preproprotein is shown in yellow letters and authentic angiotensin [1-7] and angiotensin I peptides are shown in dark blue lines. Yellow squares denote the amino acid undergoing modification. (b) Annotated MS/MS fragmentation spectra for plasma ANGT_HUMAN[448–462] filtered using peptidomic analysis and comparisons with those of the corresponding synthetic ANGT_HUMAN[448–462] peptides. MS/MS spectra with sequence assignments of fragment ions corresponding to synthetic ANGT_HUMAN[448–462] “KPEVLEVTLNRPFLF” with an m/z 530.9565 (z = 6; upper panel) are compared with those of endogenous peptides (lower panel) to confirm the putative identification. MS/MS spectra were deconvoluted into singly charged ions from the observed spectra and peaks were assigned theoretical m/z values for fragment ions. The annotations of the identified matched N-terminal-containing ions are shown in blue and the C-terminal-containing ions in red. The m/z differences between theoretical and observed values for most assigned peaks were less than 0.01 Da.
Figure 2.
Figure 2.
Binding of ANGT_HUMAN[448–462] to cultured cells. (a) Effect of ANGT_HUMAN[448–462] on [Ca2+]i in THP1-derived macrophages. Cells were stimulated with ANGT_HUMAN[448–462] (closed circle: 10-5 M, closed square: 10-6 M, open circle: control) and Fluo-4/AM fluorescence intensities were monitored. Cells pretreated with 10-5 M nicardipine were stimulated with 10-5 M ANGT_HUMAN[448–462] (open square). Points with bars represent mean ± SD (n = 6). (b–d) Confocal laser-scanning microscopy images of fluorescent ANGT_HUMAN[448–462] peptide bound to cultured cells. Growing THP1-derived macrophages (b), HAoECs (c), or HeLa cells (d) were overlaid without (left panels) or with 10–6 M ANGT_HUMAN[448–462] (right panels), nuclei counterstained with DAPI (blue), and the cell surface-bound green fluorescence photographed. (e) Total cell proteins extracted from THP1-derived macrophages were incubated without (lanes 1, 2) or with 10-4 M FAM-ANGT_HUMAN[448–462] (lanes 3-6) or unrelated fluorescent-labeled peptide (lanes 7-10) and loaded on CN-PAGE and fluorescence detected. An arrow indicates the position of visualized fluorescent bands in lanes 3 to 6. Lane M: Native Mark unstained protein standards. (f-j) THP1-derived macrophages were overlaid with (lane 1) or without (lanes 2 and 3) 10-6 M biotinylated ANGT_HUMAN[448–462] and, after incubation with (lanes 1 and 2) or without (lane 3) a cross-linking reagent, biotinylated peptide-bound plasma membrane protein complexes were extracted using streptavidin-coated magnetic beads and immunoblotted using peroxidase conjugated anti-biotin (f), peroxidase-conjugated streptavidin (g), anti-ANGT_HUMAN[448–462] IgG (h), anti-α-subunit of ATP synthase IgG (i) or anti-β-subunit of ATP synthase IgG (j). Arrow indicates the position of immunoreactive positive bands. An open arrow denotes the position of endogenous biotin-bound proteins. Lane M, molecular weight marker. (k) Rat cerebrum tissue lysates were solubilized, incubated without (lanes 1 and 2) or with (lanes 3 and 4) 10-5 M FAM-ANGT_HUMAN[448–462] and subjected to CN-PAGE. Lane M, Native Mark unstained protein standards. An arrow indicates the position of fluorescent bands detected in FAM-ANGT_HUMAN[448–462]-treated tissue proteins.
Figure 3.
Figure 3.
Fluorescent ANGT_HUMAN[448–462] binding to the THP1 cell surface and its immunofluorescence co-localization with the α- and β-subunits of ATP synthase. (a–d) FAM-ANGT_HUMAN[448–462] (10-6 M) was overlaid for 60 minutes on THP1-derived macrophages pre-treated without (a, b) or with 10-5 M β-casomorphin 7 (c, d) for 30 minutes and fixed and stained with the ATP synthase α-subunit antibody (a, c) or β-subunit antibody (b, d) (1:1000). (e, f) THP1-derived macrophages, transfected with either scramble control siRNA (e) or siATP5B (f), were incubated with FAM-ANGT_HUMAN[448–462] (10-6 M) for 60 minutes and stained with ATP synthase β-subunit antibody (1:1000). (g, h) THP1-derived macrophages, serum-starved for 16 hours and pretreated for 60 minutes with antibody against the ATP synthase α-subunit (1:1000) (g) or β-subunit (1:1000) (h), were incubated with FAM-ANGT_HUMAN[448–462] (10-6 M) for 60 minutes. The green signals correspond to FAM-ANGT_HUMAN[448–462] peptide bound to the cell surface, while the red signals represent the localization of immunoreactivity of the α- and β-subunit of ATP synthase visualized using Alexa Fluor goat anti-rabbit IgG[H + L] and anti-mouse IgG[H + L] (1:3000), respectively. The nuclei were counterstained with DAPI (blue). Overlay resulted in yellow signals indicative of co-localization.
Figure 4.
Figure 4.
Systemic distribution of ANGT_HUMAN[448–462]-like immunoreactivity in human organs. Human tissue array sections were immunohistochemically stained with anti-ANGT_HUMAN[448–462] at 1:1000 dilution. (a) cerebral cortex, (b) pituitary gland, (c) thyroid, (d) stomach, (e) liver, (f) spinal cord, (g) colon, (h) lung, (i) heart, (j) kidney (magnification, × 200 for all panels).
Figure 5.
Figure 5.
Confocal fluorescence microscopic detection of immunoreactive ANGT_HUMAN[448–462] in human cells in culture. THP1-derived macrophages (a), HAoEC (b), RD (c), HCT116 (d), HeLa (e), and HUEhT-1 (f) were stained with anti-ANGT_HUMAN[448–462] at 1:1000 dilution and reacted with Alexa Fluor 488 goat anti-rabbit IgG (magnification, × 63). Nuclei were counterstained with DAPI (blue).
Figure 6.
Figure 6.
Co-localization of ANGT_HUMAN[448–462] and angiotensin II in human tissues. Confocal fluorescence microscopic detection of immunoreactive ANGT_HUMAN[448–462] and angiotensin II in human tissue array sections double-stained with the rabbit polyclonal anti-ANGT_HUMAN[448–462] and the mouse monoclonal anti-angiotensin II/III at 1:1000 and 1:500 dilution, respectively. The signals by ANGT_HUMAN[448–462] obtained with the Alexa Fluor 594 secondary antibody and those of angiotensin II obtained with the Alexa Fluor 488 secondary antibody were overlaid, resulting in yellow signals indicative of co-localization. The nuclei were counterstained with DAPI. (a) cerebral cortex, (b) medulla oblongata, (c) pituitary gland, (d) mid brain, (e) pons, (f) lung, (g) heart, (h) colon, (i) stomach, (j) renal tubules.
Figure 7.
Figure 7.
Distinct localization of ANGT_HUMAN[448–462] and angiotensin II in human tissues. Confocal fluorescence microscopic images of human tissue array sections double-stained with the rabbit polyclonal anti-ANGT_HUMAN[448–462] and the mouse monoclonal anti-angiotensin II/III at 1:1000 and 1:500 dilution, respectively. The red signals corresponding to the localization of angiotensin II were obtained with the Alexa Fluor 594 secondary antibody and the green signals representing ANGT_HUMAN[448–462] were obtained with the Alexa Fluor 488 secondary antibody. The nuclei were counterstained with DAPI (blue). Overlay resulted in yellow signals indicative of co-localization. (a–a’’’) thyroid, (b–b’’’) renal glomerulus, (c–c’’’) liver (magnification, × 40 for all panels).
Figure 8.
Figure 8.
Quantitative analysis of the plasma ANGT_HUMAN[448–462] peptide using LC-MS/MS. The stable isotope-labeled peptide was spiked into human plasma at the final concentration of 2 nM, enriched using the modified differential solubilization method as described in the Methods and extracted peptides were separated by RP-HPLC and analyzed by LC-MS/MS. (a) MS spectrum of trivalent ions observed at retention time 22.81–22.92 minutes (indicated by triangles in b). Closed triangles represent those derived from the endogenous AGT_HUMAN[448–462] (m/z = 601.3452, 601.6795, 602.0138, 602.3481) and open triangles from the synthetic stable isotope-labeled peptide (m/z = 604.6876, 605.0219, 605.3562, 605.6905). (b) Comparison of the trivalent ion XICs with ± 6 ppm mass window of the stable isotope-labeled peptide (upper panel) and the endogenous peptide (lower panel). Total XIC area, defined as the sum of 3 ion precursors; monoisotopic mass (M), XICs of the first isotope peak (M + 1) and the second isotope peak (M + 2), was used to extrapolate plasma AGT_HUMAN[448–462] levels.
Figure 9.
Figure 9.
Biological activities of ANGT_HUMAN[448–462] on feeding, drinking, and locomotor behaviors in mice. (a) Synthetic ANGT_HUMAN[448–462] was intraperitoneally injected to ad libitum watered and fed mice at approximately 30 minutes before the onset of the dark phase, and cumulative food/water intake and locomotor activities were monitored throughout the entire dark phase of the diurnal cycle. Cumulative food and water intake are expressed in grams and in mL, and physical activity data in infrared beam interruption counts in mice treated without (open circle), or with 100 pmol/mouse ANGT_HUMAN[448–462] (closed square) during the initial 180 minutes period. *P < 0.05, **P < 0.01 compared with control experiments. (n = 4–7 mice per group). (b) Synthetic ANGT_HUMAN[448–462] at 1 pmol/mouse was centrally injected via an implanted intracerebroventricular cannulas, and cumulative food and water intake, and locomotor activities were recorded throughout the entire dark phase. *P < 0.05 compared with control experiments. (c) Changes in cumulative food intake of mice at the end of the 12 hours dark phase after central administration of 1, 10, 100, and 1000 fmol/mouse of ANGT_HUMAN[448–462] compared with that of the control mice. Data are expressed as mean ± SEM (n = 6–7 mice per group).

Similar articles

Cited by

References

    1. Anderson NL, Anderson NG.. The human plasma proteome: history, character, and diagnostic prospects. Mol Cell Proteomics. 2002;1(11):845-867. doi:10.1074/mcp.r200007-mcp200 - DOI - PubMed
    1. Tirumalai RS, Chan KC, Prieto DA, Issaq HJ, Conrads TP, Veenstra TD.. Characterization of the low molecular weight human serum proteome. Mol Cell Proteomics. 2003;2(10):1096-1103. doi:10.1074/mcp.M300031-MCP200 - DOI - PubMed
    1. Kawashima Y, Fukutomi T, Tomonaga T, et al. . High-yield peptide-extraction method for the discovery of subnanomolar biomarkers from small serum samples. J Proteome Res. 2010;9(4):1694-1705. doi:10.1021/pr9008018 - DOI - PubMed
    1. Saito T, Kawashima Y, Minamida S, et al. . Establishment and application of a high- quality comparative analysis strategy for the discovery and small-scale validation of low-abundance biomarker peptides in serum based on an optimized novel peptide extraction method. J Electrophoresis. 2013;57(1):1-9. doi:10.2198/jelectroph.57.1
    1. Taguchi T, Kodera Y, Oba K, et al. . Suprabasin-derived bioactive peptides identified by plasma peptidomics. Sci Rep. 2021;11(1):1047. doi:10.1038/s41598-020-79353-4 - DOI - PMC - PubMed

LinkOut - more resources