. 2022 May 24;4(3):fcac134.
doi: 10.1093/braincomms/fcac134. eCollection 2022.

Brain alterations in the early Alzheimer's continuum with amyloid-β, tau, glial and neurodegeneration CSF markers

Collaborators, Affiliations

Brain alterations in the early Alzheimer's continuum with amyloid-β, tau, glial and neurodegeneration CSF markers

Gemma Salvadó et al. Brain Commun. .

Abstract

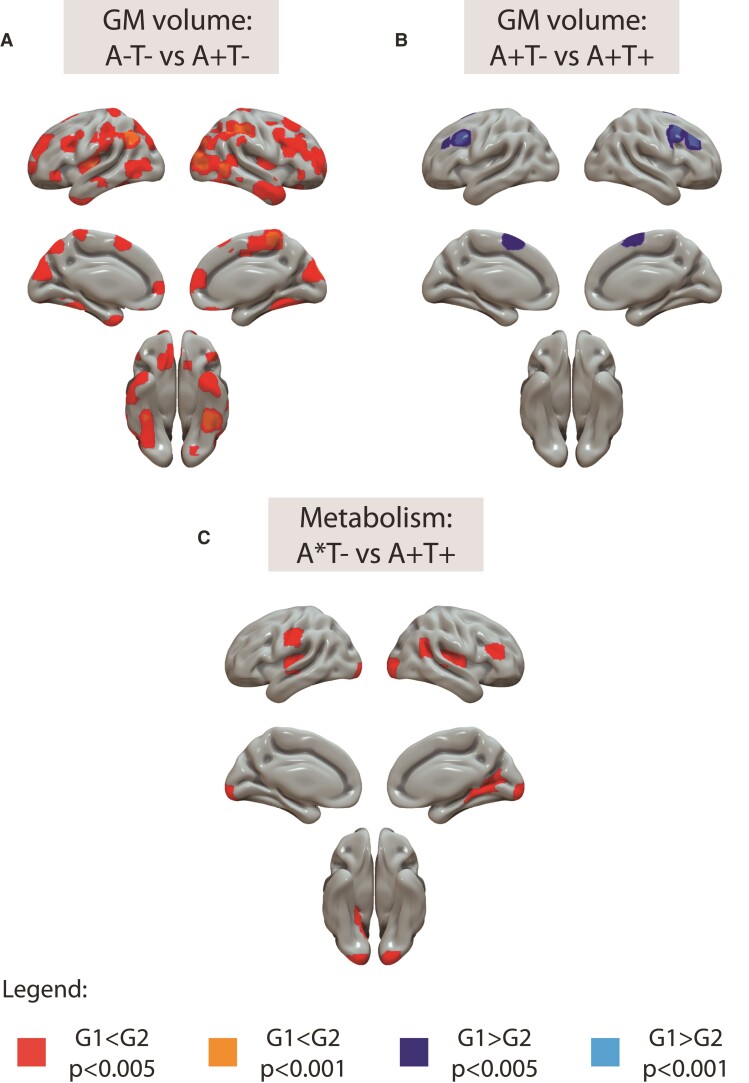
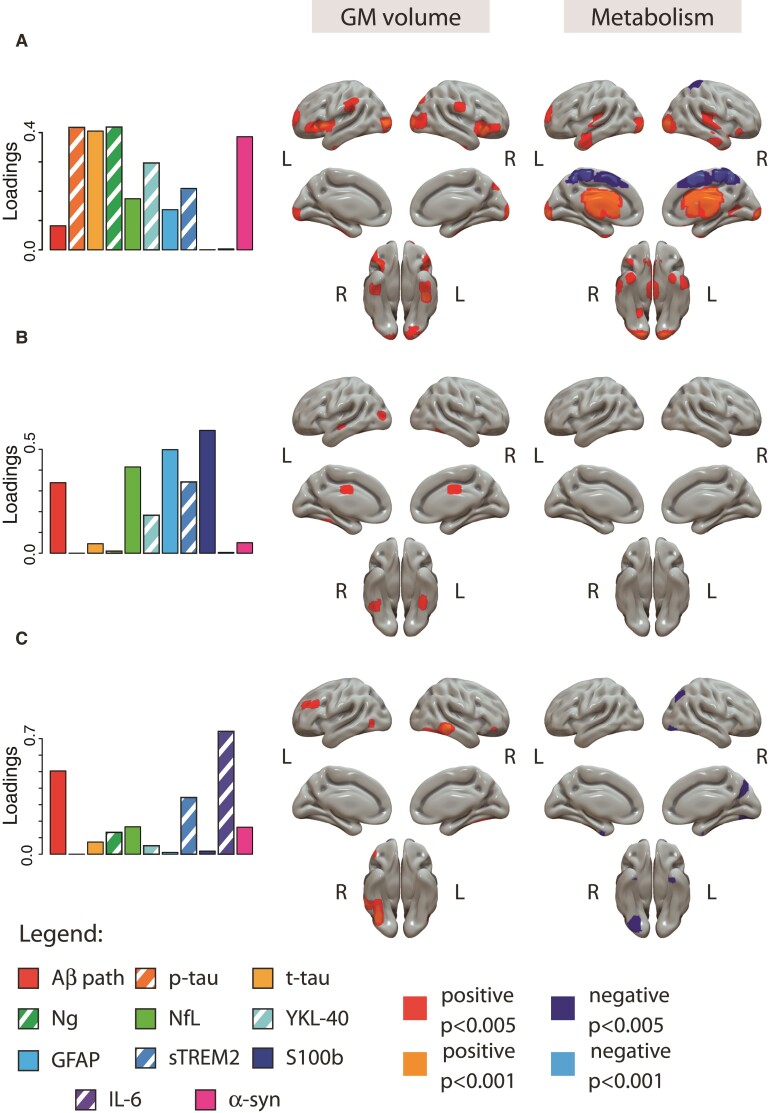
Higher grey matter volumes/cortical thickness and fluorodeoxyglucose uptake have been consistently found in cognitively unimpaired individuals with abnormal Alzheimer's disease biomarkers compared with those with normal biomarkers. It has been hypothesized that such transient increases may be associated with neuroinflammatory mechanisms triggered in response to early Alzheimer's pathology. Here, we evaluated, in the earliest stages of the Alzheimer's continuum, associations between grey matter volume and fluorodeoxyglucose uptake with CSF biomarkers of several pathophysiological mechanisms known to be altered in preclinical Alzheimer's disease stages. We included 319 cognitively unimpaired participants from the ALFA+ cohort with available structural MRI, fluorodeoxyglucose PET and CSF biomarkers of amyloid-β and tau pathology (phosphorylated tau and total tau), synaptic dysfunction (neurogranin), neuronal and axonal injury (neurofilament light), glial activation (soluble triggering receptor on myeloid cells 2, YKL40, GFAP, interleukin-6 and S100b) and α-synuclein using the Roche NeuroToolKit. We first used the amyloid-β/tau framework to investigate differences in the neuroimaging biomarkers between preclinical Alzheimer's disease stages. Then, we looked for associations between the neuroimaging markers and all the CSF markers. Given the non-negative nature of the concentrations of CSF biomarkers and their high collinearity, we clustered them using non-negative matrix factorization approach (components) and sought associations with the imaging markers. By groups, higher grey matter volumes were found in the amyloid-β-positive tau-negative participants with respect to the reference amyloid-β-negative tau-negative group. Both amyloid-β and tau-positive participants showed higher fluorodeoxyglucose uptake than tau-negative individuals. Using the obtained components, we observed that tau pathology accompanied by YKL-40 (astrocytic marker) was associated with higher grey matter volumes and fluorodeoxyglucose uptake in extensive brain areas. Higher grey matter volumes in key Alzheimer-related regions were also found in association with two other components characterized by a higher expression of amyloid-β in combination with different glial markers: one with higher GFAP and S100b levels (astrocytic markers) and the other one with interleukin-6 (pro-inflammatory). Notably, these components' expression had different behaviours across amyloid-β/tau stages. Taken together, our results show that CSF amyloid-β and phosphorylated tau, in combination with different aspects of glial response, have distinctive associations with higher grey matter volumes and increased glucose metabolism in key Alzheimer-related regions. These mechanisms combine to produce transient higher grey matter volumes and fluorodeoxyglucose uptake at the earliest stages of the Alzheimer's continuum, which may revert later on the course of the disease when neurodegeneration drives structural and metabolic cerebral changes.

Keywords: cerebrospinal fluid biomarkers; fluorodeoxyglucose positron emission tomography; neurodegeneration; neuroinflammation; structural magnetic resonance imaging.


Figures

Graphical abstract
Graphical abstract
Figure 1
Figure 1
Structural and metabolic differences by AT stages. Differences are shown at the voxel level. T1-weighted (A and B) or [18F]FDG (C) scans were used as dependent variables in independent models using AT stages as independent variables and age, sex and APOE-ɛ4 carriership as covariates. Differences in which group 2 (G2) is higher than group 1 (G1) are shown in warm colours (red: P < 0.005, orange: P < 0.001), whereas the reverse is shown in cold colours (dark blue: P < 0.005, light blue: P < 0001). A*T- include both A-T- and A*T- groups. GM = grey matter.
Figure 2
Figure 2
Association between raw CSF biomarkers and GM volumes. T1-weighted scans were used as dependent variables in independent models using each CSF biomarker as independent variable and age, sex and APOE-ɛ4 carriership as covariates. Positive associations are shown in warm colours (red: P < 0.005, orange: P < 0.001) and negative associations are shown in cold colours (dark blue: P < 0.005, light blue: P < 0001). Of note, CSF Aβ42/40 levels were inverted with the aim that higher levels would represent higher Aβ pathology, therefore positive associations mean increases in GM volumes with higher Aβ pathology (lower Aβ42/40 levels). Aβ = amyloid-β; GFAP = glial fibrillary acidic protein; GM = gray matter; IL-6 = cytokine interleukin-6; NfL = neurofilament light; p-tau = phosphorylated tau; S100b = S100 calcium binding protein B; sTREM2 = soluble triggering receptor on myeloid cells 2; t-tau = total tau.
Figure 3
Figure 3
Association between raw CSF biomarkers and metabolism. [18F]FDG scans were used as dependent variables in independent models using each CSF biomarker as independent variable and age, sex and APOE-ɛ4 carriership as covariates. Biomarkers not shown in the figure did not present any significance association with brain metabolism. Positive associations are shown in warm colours (red: P < 0.005, orange: P < 0.001) and negative associations are shown in cold colours (dark blue: P < 0.005, light blue: P < 0001). GM = grey matter; p-tau = phosphorylated tau; sTREM2 = soluble triggering receptor on myeloid cells 2; t-tau = total tau.
Figure 4
Figure 4
CSF components’ characterization by AT stages. The description of components’ loadings is shown in the first column and expression of each component by AT stages in the second. Significant differences are depicted in the figure. Of note, CSF Aβ42/40 levels were inverted with the aim that higher expression would represent higher Aβ pathology. * P < 0.05; ** P < 0.01; ***P < 0.001. Aβ = amyloid-β; GFAP = glial fibrillary acidic protein; GM = gray matter; IL-6 = cytokine interleukin-6; NfL = neurofilament light; Ng = neurogranin; p-tau = phosphorylated tau; S100b = S100 calcium binding protein B; sTREM2 = soluble triggering receptor on myeloid cells 2; t-tau = total tau.
Figure 5
Figure 5
Association between CSF components and imaging markers. Associations at the voxel level are shown for structure (second column) and glucose metabolism (third column). Component's weights are depicted in the first column for reference. Positive associations are shown in warm colours (red: P < 0.005, orange: P < 0.001) and negative associations are shown in cold colours (dark blue: P < 0.005, light blue: P < 0001). Of note, CSF Aβ42/40 levels were inverted with the aim that higher expression would represent higher Aβ pathology. T1-weighted or [18F]FDG scans were used as dependent variables in independent models using all the components as independent variables in the same model and age, sex and APOE-ɛ4 carriership as covariates. Aβ = amyloid-β; GFAP = glial fibrillary acidic protein; GM = gray matter; IL-6 = cytokine interleukin-6; NfL = neurofilament light; Ng = neurogranin; p-tau = phosphorylated tau; S100b = S100 calcium binding protein B; sTREM2 = soluble triggering receptor on myeloid cells 2; t-tau = total tau.

References

    1. Jack CR, Bennett DA, Blennow K, et al. . NIA-AA Research Framework: Toward a biological definition of Alzheimer’s disease. Alzheimers Dement. 2018;14:535–562. - PMC - PubMed
    1. Milà-Alomà M, Salvadó G, Gispert JD, et al. . Amyloid-β, tau, synaptic, neurodegeneration and glial biomarkers in the preclinical stage of the Alzheimer’s continuum. Alzheimers Dement. 2020(May):1358–1371. - PMC - PubMed
    1. Salvadó G, Milà-Alomà M, Shekari M, et al. . Cerebral amyloid-β load is associated with neurodegeneration and gliosis: Mediation by p-tau and interactions with risk factors early in the Alzheimer’s continuum. Alzheimers Dement. 2021(October 2020):788–800. - PMC - PubMed
    1. Johnson SC, Christian BT, Okonkwo OC, et al. . Amyloid burden and neural function in people at risk for Alzheimer’s Disease. Neurobiol Aging. 2014;35:576–584. - PMC - PubMed
    1. Chételat G, Villemagne VL, Pike KE, et al. . Larger temporal volume in elderly with high versus low beta-amyloid deposition. Brain. 2010;133:3349–3358. - PubMed

LinkOut - more resources