. 2022 Jul;26(14):3913-3930.
doi: 10.1111/jcmm.17428. Epub 2022 Jun 15.

miR-218 affects the ECM composition and cell biomechanical properties of glioblastoma cells

Affiliations

miR-218 affects the ECM composition and cell biomechanical properties of glioblastoma cells

Małgorzata Grabowska et al. J Cell Mol Med. 2022 Jul.

Abstract

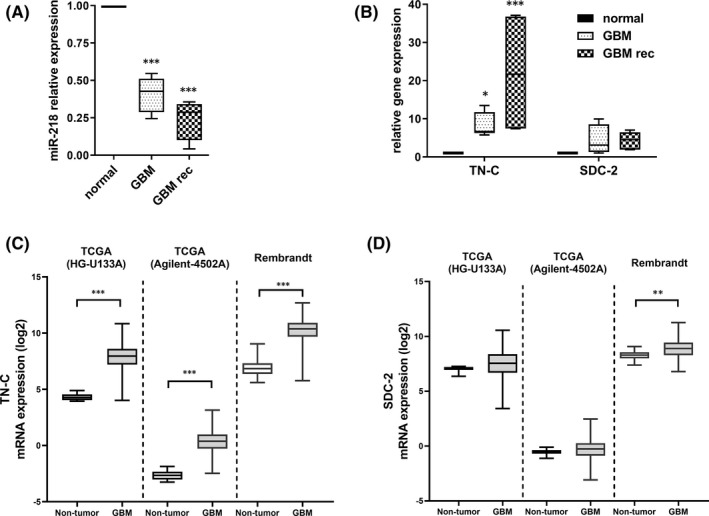
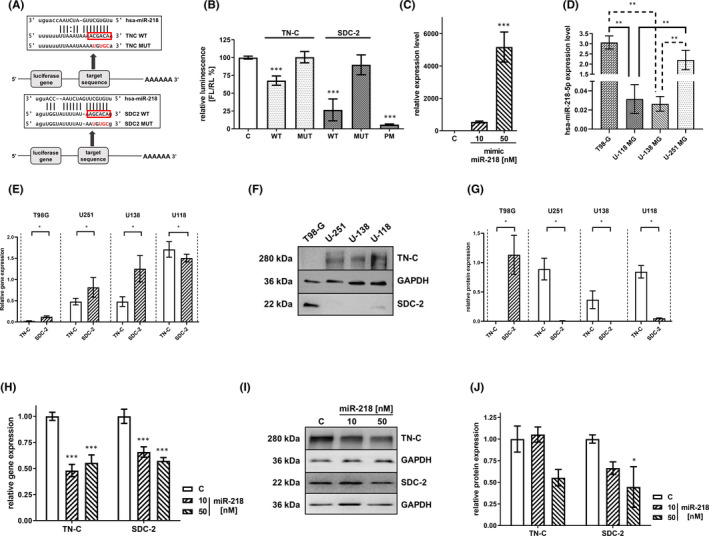
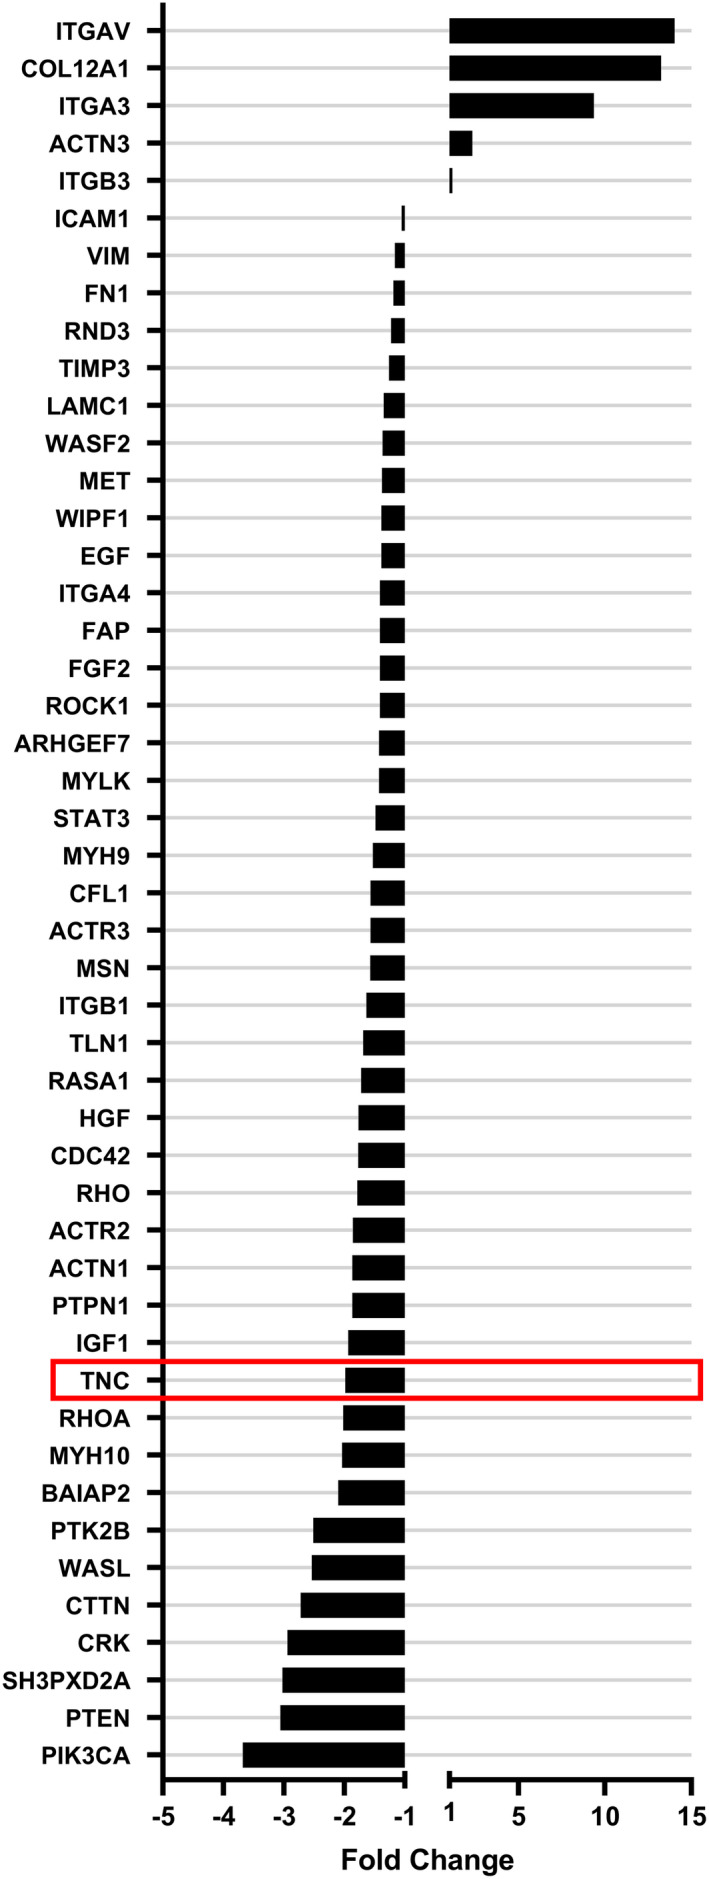
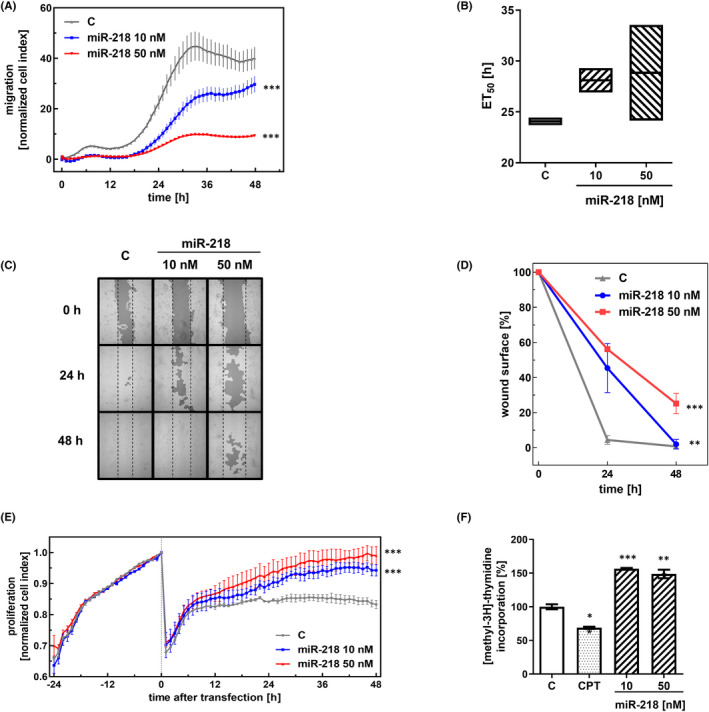
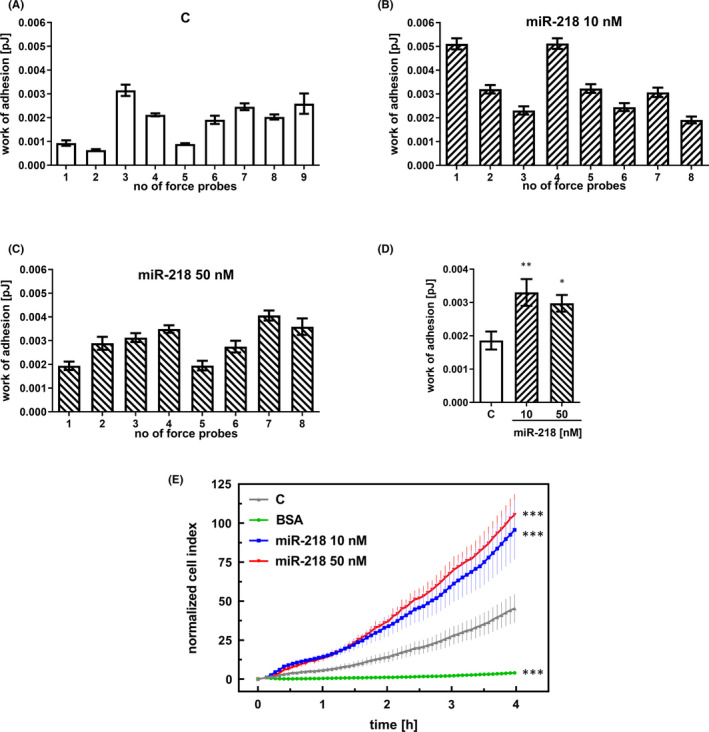
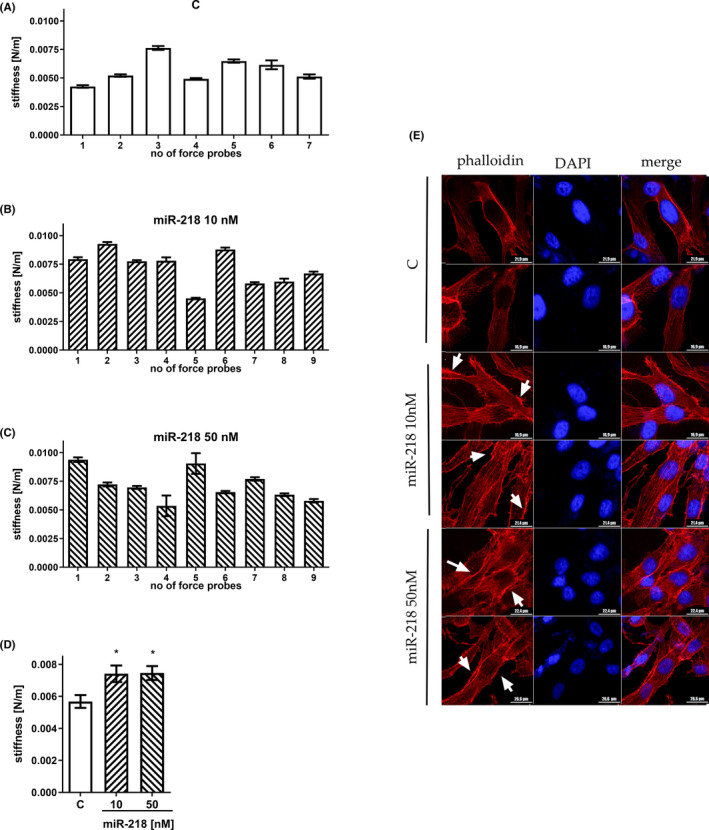
Glioblastoma (GBM) is the most common malignant brain tumour. GBM cells have the ability to infiltrate into the surrounding brain tissue, which results in a significant decrease in the patient's survival rate. Infiltration is a consequence of the low adhesion and high migration of the tumour cells, two features being associated with the highly remodelled extracellular matrix (ECM). In this study, we report that ECM composition is partially regulated at the post-transcriptional level by miRNA. Particularly, we show that miR-218, a well-known miRNA suppressor, is involved in the direct regulation of ECM components, tenascin-C (TN-C) and syndecan-2 (SDC-2). We demonstrated that the overexpression of miR-218 reduces the mRNA and protein expression levels of TN-C and SDC-2, and subsequently influences biomechanical properties of GBM cells. Atomic force microscopy (AFM) and real-time migration analysis revealed that miR-218 overexpression impairs the migration potential and enhances the adhesive properties of cells. AFM analysis followed by F-actin staining demonstrated that the expression level of miR-218 has an impact on cell stiffness and cytoskeletal reorganization. Global gene expression analysis showed deregulation of a number of genes involved in tumour cell motility and adhesion or ECM remodelling upon miR-218 treatment, suggesting further indirect interactions between the cells and ECM. The results demonstrated a direct impact of miR-218 reduction in GBM tumours on the qualitative ECM content, leading to changes in the rigidity of the ECM and GBM cells being conducive to increased invasiveness of GBM.

Keywords: AFM; ECM; GBM; glioblastoma; miR-218; tenascin-C.


Conflict of interest statement

The authors confirm that there are no conflicts of interest.

Figures

FIGURE 1
FIGURE 1
miR‐218 expression in primary (GBM) and recurrent glioblastoma (GBM rec) tissues and its putative target mRNAs. (A) qRT‐PCR analysis of GBM (n = 10) and GBM rec samples (n = 9) in comparison with a healthy brain RNA sample (n = 1). Healthy brain sample consists of RNA pooled from 23 donors. Data are shown as the mean ± SD values. One‐way anova and the post hoc Bonferroni test, ***p < .001. (B) qRT‐PCR analysis of the tenascin‐C and syndecan‐2 mRNA expression levels in GBM and GBM rec tissues in comparison with RNA from healthy brain RNA sample (n = 1). Healthy brain sample consists of RNA pooled from 23 people Data are shown as the mean ± SD values. Mixed‐model analysis and the post hoc Bonferroni test; *p < .05 and ***p < .001. (C,D) Expression of TN‐C and SDC‐2 in GBM tumour from TCGA and Rembrandt databases examined using the Gliovis database. Tukey's test, ***p < .001 and **p < .01
FIGURE 2
FIGURE 2
Regulation of TN‐C and SDC‐2 by miR‐218. (A) Schematic representation of the interaction between miR‐218 and 3′UTRs of its targets. The seed region is enclosed in a red box. The putative conserved sequences in the SDC‐2 and TN‐C targets are denoted as the wild type (WT). The non‐conserved nucleotides within the seed region of the mutant 3′UTRs are marked in red in the construct named “mutant” (MUT). (B) Relative repression of luciferase expression. Reporter constructs carrying a single binding site were tested. miR‐218 activity in 5 constructs was measured in parallel (Control U‐118 MG cells—C, WT, MUT and perfect match—PT as a positive control in the experiment). Data are shown as the mean ± SD values. ***p < .001. (C) Overexpression of miR‐218 as a result of miR‐218 mimic transfection, as evaluated by qRT‐PCR. The measured expression level of TN‐C and SDC‐2 in different glioma cell lines with the use of qRT‐PCR. (D) Expression level of miR‐218 in T98‐G, U‐118 MG, U‐138 MG and U‐251 MG cell lines. Data are shown as the mean ± SD values. **p < .01 (E) and Western blot (F,G). All cell lines were cultured in corresponding cell culture media in the same period of time, and materials for analysis were isolated in the same batch to avoid unnecessary variability. (H) The quantified effects of transfection of U‐118 MG cells with the miR‐218 mimic at 10 nM and 50 nM concentrations on mRNA levels, as measured by qRT‐PCR, and on protein levels, as established by Western blot analysis (I,J). Cells transfected with scrambled siRNA were used as the control—(C). Data are shown as the mean ± SD values. Two‐way anova and the post hoc Bonferroni test, *p < .05 and ***p < .001
FIGURE 3
FIGURE 3
Cluster analysis of mRNAs encoding ECM components that were differentially regulated in the GBM cell line after miR‐218 transfection. The quantified effects of transfection of U‐118 MG cells with the miR‐218 mimic at a 50 nM concentration on the expression levels of genes, as determined by qRT‐PCR of a Human Cell Motility and Extracellular Matrix & Adhesion Molecules RT2 Profiler PCR Array. Cells transfected with scrambled siRNA were used as the control
FIGURE 4
FIGURE 4
Effect of miR‐218 on the migration and proliferation of glioblastoma cells. (A) The migration of U‐118 MG cancer cells was studied using an xCELLigence system. Cells in serum‐depleted medium were transfected with the miR‐218 mimic (10 and 50 nM). Control (C)—cells treated with scrambled siRNA. Data are shown as the mean ± SD values. One‐way anova and the post hoc Bonferroni test, ***p < .001. (B) The half‐maximal effective time (ET50) was calculated for each miR‐218 concentration to generate dose–response curves. The ET50 values were normalized to control (C) cells treated with scrambled siRNA and plotted as the normalized ET50 of cell migration against the miR‐218 concentration. (C) The wound healing assay after miR‐218 mimic transfection. The dark grey areas indicate the surface area of the wound. (D) The calculation of the wound area (%) 24 and 48 h post‐transfection. Control U‐118 MG cells (C) were treated with scrambled siRNA. Data are shown as the mean ± SD values. One‐way anova and the post hoc Bonferroni test, **p < .01 and ***p < .001. (E) Proliferation of U‐118 MG cancer cells analysed with the xCELLigence system. Cells were transfected with the miR‐218 mimic (10 and 50 nM). Control (C)—cells treated with scrambled siRNA. Data are shown as the mean ± SD values. One‐way anova and the post hoc Bonferroni test, *p < .05 and **p < .01. (F) The thymidine incorporation assay on miR‐218 mimic‐transfected cells. As the positive control, cells treated with camptothecin were used. One‐way anova and post hoc Bonferroni test, *p < .05, **p < .01 and ***p < .001
FIGURE 5
FIGURE 5
Adhesion of GBM cells increases after miR‐218 treatment. The adhesive properties of U‐118 MG cells were quantified by SCFS using single cells as force probes. Data for control, treated with scrambled siRNA cells (A), cells transfected with the miR‐218 mimic at concentrations of 10 nM (B) and 50 nM (C), and the average result over all measurements (D). (E) Real‐time adhesion measured with the xCELLigence system. The graph shows the final impedance values minus the initial values for the corresponding samples. Control (C)—cells treated with scrambled siRNA. Cells suspended in bovine serum albumin (BSA) were used as the positive control. Data are shown as the mean ± SD values. One‐way anova and the post hoc Bonferroni test, *p < .05, **p < .01 and ***p < .001
FIGURE 6
FIGURE 6
Mechanical properties of GBM cells after miR‐218 treatment. Stiffness of U‐118 MG cells quantified based on AFM elasticity measurements and expressed in N/m. Data for control, treated with scrambled siRNA cells (A), cells transfected with the miR‐218 mimic at a 10 nM concentration (B) and a 50 nM concentration (C), and the average result over all measurements (D). (E) Confocal imaging of the actin cortex. Phalloidin (red) staining and DAPI (blue) staining were performed to visualize actin fibres and cell nuclei, respectively. Z‐stack images were acquired. White arrows point to visible changes in actin structures. Data are shown as the mean ± SD values. One‐way anova and the post hoc Bonferroni test, *p < .05

Similar articles

Cited by

References

    1. Sasmita AO, Wong YP, Ling APK. Biomarkers and therapeutic advances in glioblastoma multiforme. Asia Pac J Clin Oncol. 2018;14:40‐51. doi:10.1111/ajco.12756 - DOI - PubMed
    1. Vigneswaran K, Neill S, Hadjipanayis CG. Beyond the World Health Organization grading of infiltrating gliomas: advances in the molecular genetics of glioma classification. Ann Transl Med. 2015;3:95. doi:10.3978/j.issn.2305-5839.2015.03.57 - DOI - PMC - PubMed
    1. Kim J, Lee IH, Cho HJ, et al. Spatiotemporal evolution of the primary glioblastoma genome. Cancer Cell. 2015;28:318‐328. doi:10.1016/j.ccell.2015.07.013 - DOI - PubMed
    1. Wei SC, Yang J. Forcing through tumor metastasis: the interplay between tissue rigidity and epithelial‐mesenchymal transition. Trends Cell Biol. 2016;26:111‐120. doi:10.1016/j.tcb.2015.09.009 - DOI - PMC - PubMed
    1. Naba A, Clauser KR, Hoersch S, Liu H, Carr SA, Hynes RO. The matrisome: in silico definition and in vivo characterization by proteomics of normal and tumor extracellular matrices. Mol Cell Proteomics. 2012;11:M111 014647. doi:10.1074/mcp.M111.014647 - DOI - PMC - PubMed

Publication types