. 2022 Jun 8;289(1976):20220526.
doi: 10.1098/rspb.2022.0526. Epub 2022 Jun 15.

Avoiding critical thresholds through effective monitoring

Affiliations

Avoiding critical thresholds through effective monitoring

Adrian C Stier et al. Proc Biol Sci. .

Abstract

A major challenge in sustainability science is identifying targets that maximize ecosystem benefits to humanity while minimizing the risk of crossing critical system thresholds. One critical threshold is the biomass at which populations become so depleted that their population growth rates become negative-depensation. Here, we evaluate how the value of monitoring information increases as a natural resource spends more time near the critical threshold. This benefit emerges because higher monitoring precision promotes higher yield and a greater capacity to recover from overharvest. We show that precautionary buffers that trigger increased monitoring precision as resource levels decline may offer a way to minimize monitoring costs and maximize profits. In a world of finite resources, improving our understanding of the trade-off between precision in estimates of population status and the costs of mismanagement will benefit stakeholders that shoulder the burden of these economic and social costs.

Keywords: Allee effect; adaptive management; depensation; management strategy evaluation; tipping point; value of information.


Conflict of interest statement

We declare we have no competing interests.

Figures

Figure 1.
Figure 1.
Different population dynamics of a harvested resource with (a) high monitoring precision (blue) and (b) low monitoring precision (red) at rate Hmsy for a single replicate run of the simulation model. Model output represents true biomass (solid line) and estimated biomass (dashed line). Grey area represents overharvest ‘danger zone’ region calculated as B^t<0.8BMSY (dotted line). Bottom of danger zone is A value, below which the population crashes (A = 10). Increased monitoring precision produces different population dynamics, with lower volatility and less time spent categorized as ‘overharvested’ at high monitoring precision. (Online version in colour.)
Figure 2.
Figure 2.
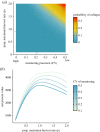
Summary of the probability of population collapse (a) and the median NPV (b) for 10 000 iterations of 50-year simulations across a range of monitoring investment. The probability of population collapse increases as the maximum exploitation rate increases and as monitoring precision decreases. Combinations of exploitation rate and monitoring precision with higher probability of collapse are in warmer red colours and combinations with lower probability of collapse are in colder blue colours. NPV of the resource increases as the harvest rate peaks at harvest at maximum sustainable yield and is highest for high-precision estimates. In (b), precision (CV of the population) is plotted as high precision in light green and low precision in blue.
Figure 3.
Figure 3.
Summary of NPV for 10 000 50-year simulations for low (CV = 0.5, triangles) and high (CV = 0.1, circles) monitoring investment and across a range of maximum harvest mortality rate (proportion of HMSY : pHMSY). Populations with higher maximum harvest rates spend a larger fraction of their time classified as overharvested. Generally, NPV increases as harvest rates approach (HMSY, p = 1), then declines as over-harvesting occurs ( > HMSY, p > 1). Return on investment is proportional to the length of the line connecting any two points harvested at the same rate (i.e. same colour), which depicts how much NPV changes when you go from low to high monitoring precision.
Figure 4.
Figure 4.
The number of successful rescues of a population when it dips into the danger zone state (B^t<0.8BMSY). Number of recoveries is calculated as the average from 10 000 iterations of 50-year simulations for each of a range of monitoring precision and proportion of maximum harvest rates. Recovery is most frequent when monitoring precision is highest and harvest rate is low, but declines as harvest rate increases and monitoring precision decreases. Recovery is high in blue and low in red.
Figure 5.
Figure 5.
Suite of safe combinations of monitoring and harvest rates that avoids crossing a critical biological threshold (A = 10) given high (blue) and low (red) risk tolerance. The minimum amount of monitoring precision needed (maximum allowable CV where high CV corresponds to less monitoring) for a given maximum harvest rate (pHMSY) to avoid a threshold under two different risk scenarios (1% and 20% of crossing a threshold). A higher precision of monitoring and lower rate of harvest is required to avoid a crossing a threshold, thus as maximum harvest rate increases, a decline occurs in the minimum allowable monitoring precision is needed to avoid crossing a threshold. The total safe area of potential combinations of monitoring precision and maximum harvest increases as tolerance to risk increases from 1% (dashed red) to 20% (solid blue). Lines represent median of 10 000 50-year simulations across a range of monitoring investment (CV of true biomass) and percentage of the maximum harvest rate (pHMSY). (Online version in colour.)
Figure 6.
Figure 6.
Financial benefits of a precautionary buffer approach when the industry bears the cost of monitoring. Comparison of constant but fixed monitoring investment (i.e. high monitoring precision [CV = 0.1, solid line and circles] or low-precision monitoring [CV = 0.5, short-dash line and triangles]) to a precautionary buffer where when estimated biomass is above this buffer (i.e. B^t>BMSY) monitoring is low precision [CV = 0.5] and below which (i.e. B^t>BMSY) monitoring is high precision (long dash line and squares). Cost function slope (cs = 5). Median results from 10 000 simulations shown for a range of maximum harvest efforts (x-axis), and blue and red points represent the low and high probability of population collapse, respectively.

References

    1. Kates RW, et al. 2001. Sustainability science. Science 292, 641-642. (10.1126/science.1059386) - DOI - PubMed
    1. Wintle BA, Runge MC, Bekessy SA. 2010. Allocating monitoring effort in the face of unknown unknowns. Ecol. Lett. 13, 1325-1337. (10.1111/j.1461-0248.2010.01514.x) - DOI - PubMed
    1. McDonald-Madden E, Baxter PW, Fuller RA, Martin TG, Game ET, Montambault J, Possingham HP. 2010. Monitoring does not always count. Trends Ecol. Evol. 25, 547-550. (10.1016/j.tree.2010.07.002) - DOI - PubMed
    1. Biggs HC, Rogers KH. 2003. An adaptive system to link science, monitoring and management in practice. In The Kruger experience (eds Biggs HC, du Toit JT, Rogers KH), pp. 59-80. Washington, DC: Island Press. See https://www.google.com/books/edition/The_Kruger_Experience/pLdmZ9kObKoC?....
    1. Wade PR. 1998. Calculating limits to the allowable human-caused mortality of cetaceans and pinnipeds. Mar. Mamm. Sci. 14, 1-37. (10.1111/j.1748-7692.1998.tb00688.x) - DOI

Publication types