

PPARα alleviates iron overload-induced ferroptosis in mouse liver
- PMID: 35703725
- PMCID: PMC9346473
- DOI: 10.15252/embr.202052280
PPARα alleviates iron overload-induced ferroptosis in mouse liver
Abstract
Ferroptosis is an iron-dependent form of non-apoptotic cell death implicated in liver, brain, kidney, and heart pathology. How ferroptosis is regulated remains poorly understood. Here, we show that PPARα suppresses ferroptosis by promoting the expression of glutathione peroxidase 4 (Gpx4) and by inhibiting the expression of the plasma iron carrier TRF. PPARα directly induces Gpx4 expression by binding to a PPRE element within intron 3. PPARα knockout mice develop more severe iron accumulation and ferroptosis in the liver when fed a high-iron diet than wild-type mice. Ferrous iron (Fe2+ ) triggers ferroptosis via Fenton reactions and ROS accumulation. We further find that a rhodamine-based "turn-on" fluorescent probe(probe1) is suitable for the in vivo detection of Fe2+ . Probe1 displays high selectivity towards Fe2+ , and exhibits a stable response for Fe2+ with a concentration of 20 μM in tissue. Our data thus show that PPARα activation alleviates iron overload-induced ferroptosis in mouse livers through Gpx4 and TRF, suggesting that PPARα may be a promising therapeutic target for drug discovery in ferroptosis-related tissue injuries. Moreover, we identified a fluorescent probe that specifically labels ferrous ions and can be used to monitor Fe2+ in vivo.
Keywords: Ferroptosis; Gpx4; Liver; PPARα; TRF.
© 2022 The Authors. Published under the terms of the CC BY NC ND 4.0 license.
Figures
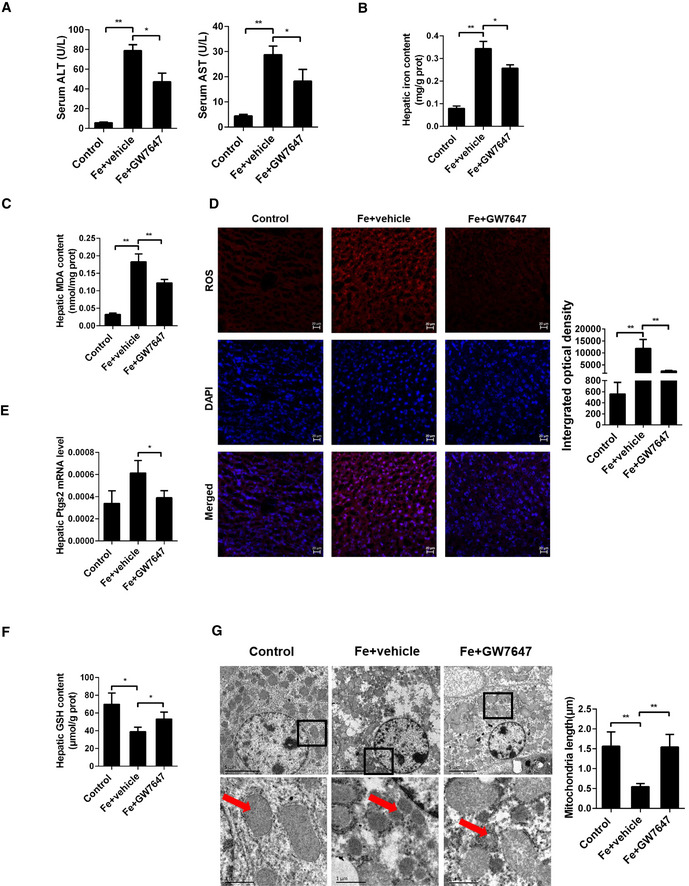
- A
Serum ALT and AST levels were measured in 8‐week‐old WT mice that were fed a HID with or without GW7647 treatment; n = 5 mice/group.
- B, C
Hepatic iron content (B) and hepatic MDA (C) content was measured in the indicated mice; n = 5 mice/group.
- D
Measurement of intracellular ROS levels by fluorescent probe DCFH‐DA, and the fluorescence intensity of ROS was calculated; All scale bars are 20 μm. n = 3 biological replicates.
- E, F
Hepatic Ptgs2 mRNA levels (E) and hepatic GSH content (F) were measured in the indicated mice; n = 5 mice/group. mRNA levels were normalized to 36b4 and are expressed relative to the mean value of the WT group.
- G
Liver tissues were obtained from the indicated mice and then examined using transmission electron microscopy (Arrowheads indicate mitochondria); Scale bars are 1 μm and 5 μm. n = 3 biological replicates.
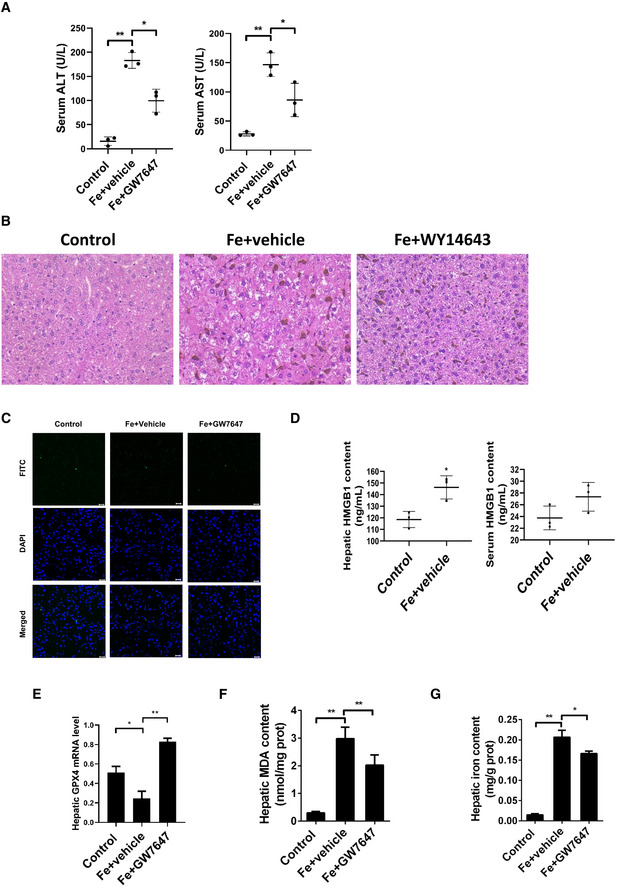
Serum ALT and AST levels was measured in 8‐week‐old WT mice that were received intraperitoneal injections of dextriferron with or without GW7647 treatment.
Liver sections were obtained from the indicated mice and stained with H&E. All scale bars are 50 μm.
Liver sections were obtained from the indicated mice and stained with TUNEL. All scale bars are 20 μm.
Hepatic and serum HMGB1 content were measured in the indicated mice.
Hepatic Gpx4 mRNA levels were measured in the indicated mice.
Hepatic MDA content was measured in 8‐week‐old WT mice that were received intraperitoneal injections of dextriferron with or without GW7647 treatment.
Hepatic iron content was measured in 8‐week‐old WT mice that were received intraperitoneal injections of dextriferron with or without GW7647 treatment.
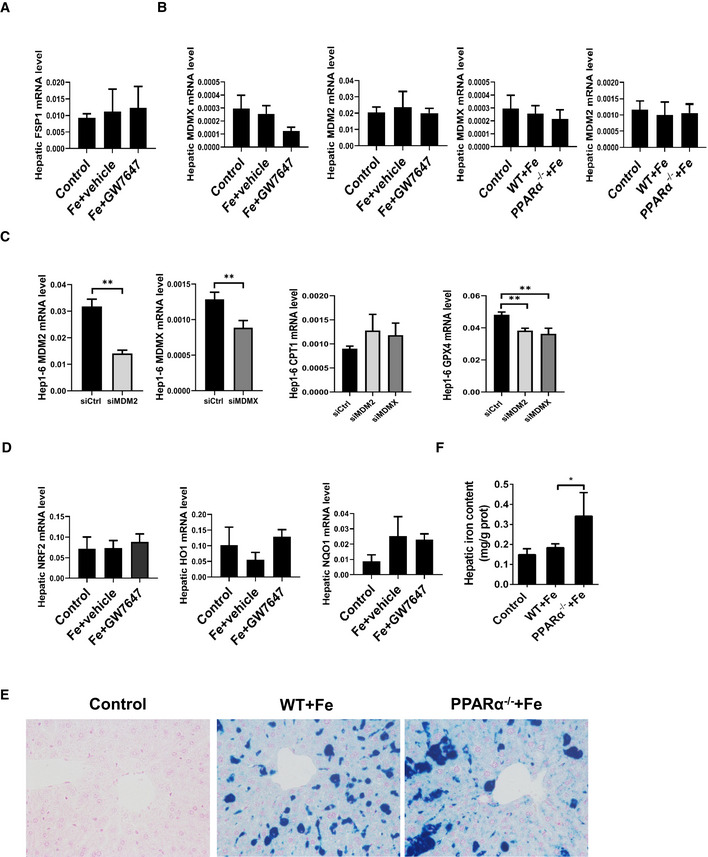
Hepatic FSP1 mRNA levels were measured in the indicated mice.
Hepatic MDM2 and MDMX mRNA levels were measured in the indicated mice.
MDM2, MDMX, CPT1 and GPX4 mRNA levels were measured in the Hep1‐6 cells after MDM2 or MDMX knockdown.
Hepatic NRF2 mRNA levels, hepatic HO1 mRNA levels, and hepatic NQO1 mRNA levels were measured in the indicated mice.
Liver sections were obtained from the indicated mice and stained with Prussian blue All scale bars are 50 μm.
Hepatic iron content was measured in 8‐week‐old WT, PPARα−/− mice that were fed a HID or received intraperitoneal injections of dextriferron; n = 3–5 mice/group.

Acox1 and Gpx4 mRNA was measured in liver of WT and PPARα−/− mice fed blank solvent (white bars, n = 5 mice/group) or GW7647 (black bars, n = 5 mice/group).
Gpx4 protein was measured in liver of WT and PPARα−/− mice fed blank solvent or GW7647; n = 4 biological replicates.
Schematic of the WT and mutant PPRE elements. The six nucleotides that were altered to form the mutant construct are underlined.
A 123‐base pair fragment of intron 3 of mouse Gpx4 (position from +7679 to +7803 with respect to the transcription start site) was inserted into the pGL3 promoter vector to generate the pGL3 promoter intron 3 reporter constructs. The PPRE in intron 3 was mutated to create the mutant construct (pGL3 promoter intron 3 mut). These reporter constructs were transfected into Hep1‐6 cells. The indicated PPARα ligands were added to cell cultures 24 h before the reporter gene assay; n = 3 biological replicates. Data were calculated as the fold induction with respect to the empty vector (pGL3 promoter luciferase vector).
Chromatin immunoprecipitation assays were performed on soluble formaldehyde‐crosslinked chromatin isolated from untreated and GW7647‐treated WT or PPARα−/− livers with polyclonal anti‐PPARα antibodies (anti‐PPARα) or control IgG. The final DNA extraction was polymerase chain reaction‐amplified with a primer pair that covered the sequence in intron 3 of Gpx4.
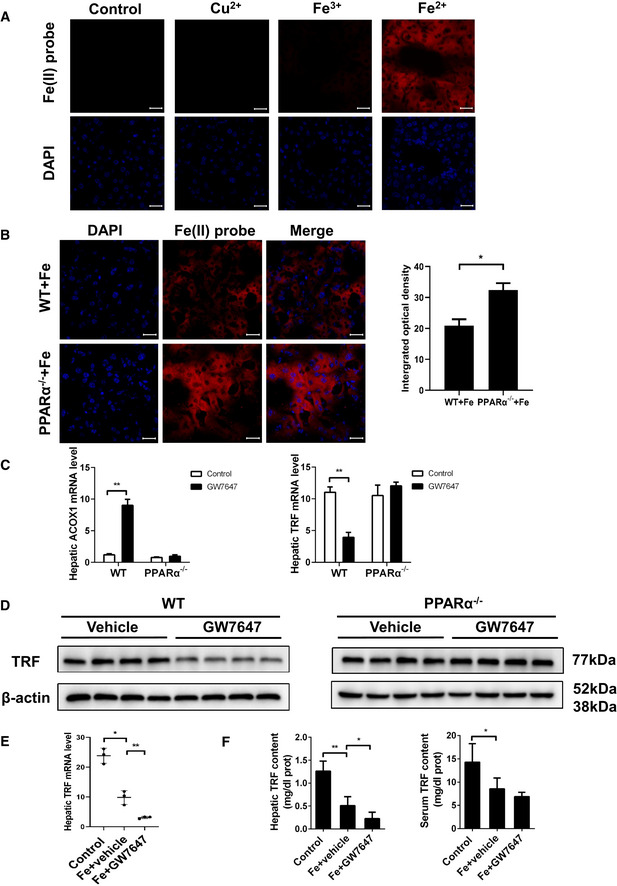
Fluorescent images of labile Fe2+ in hep1‐6 cells. Hep1‐6 cells were incubated with control, 20 μM probe1 for 30 min; 20 μM Cu2+ for 30 min then 20 μM probe1 for another 30 min; 20 μM Fe3+ for 30 min then 20 μM probe1 for another 30 min; 20 μM Fe2+ for 30 min then 20 μM probe1 for another 30 min; All scale bars are 20 μm. n = 3 biological replicates.
Liver sections were obtained from the indicated mice and stained with probe1. All scale bars are 20 μm. n = 3 biological replicates.
Hepatic Acox1 and TRF mRNA levels were measured in the WT and PPARα−/− mice with or without GW7647 treatment. n = 3–5 mice/group.
TRF protein was measured in liver of WT and PPARα−/− mice fed blank solvent or GW7647. n = 4 biological replicates.
Hepatic TRF mRNA levels were measured in the indicated mice. n = 3–5 mice/group.
Hepatic and serum TRF content were measured in the indicated mice. n = 3–5 mice/group.
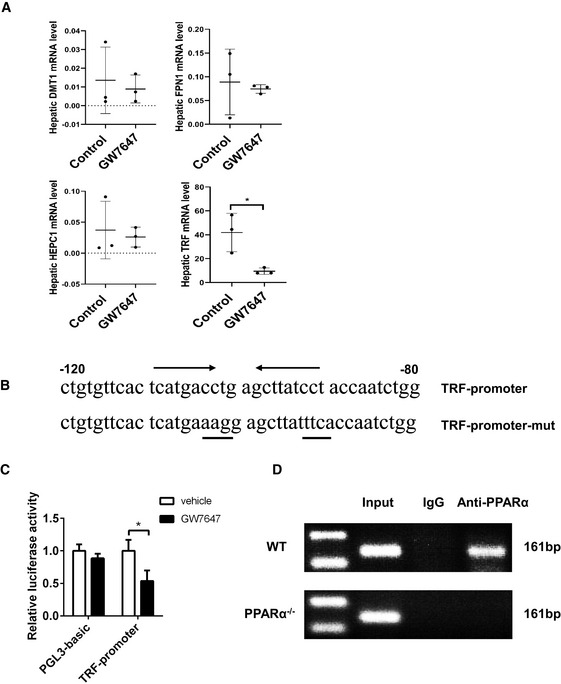
Hepatic DMT1, FPN1, HEPC1 and TRF mRNA levels were measured in the indicated mice; n = 3 mice/group.
Schematic of the TRF‐promoter‐PPRE.
A 2,000‐base pair fragment of the promoter of mouse TRF was inserted into the pGL3 promoter vector to generate the pGL3 promoter constructs. These reporter constructs were transfected into Hep1‐6 cells. The indicated PPARα ligands were added to cell cultures 24 h before the reporter gene assay. Data were calculated as the fold induction with respect to the empty vector (pGL3 promoter luciferase vector). n = 3 biological replicates.
Chromatin immunoprecipitation assays were performed on soluble formaldehyde–crosslinked chromatin isolated from untreated and GW7647‐treated WT or PPARα−/− livers with polyclonal anti‐PPARα antibodies (anti‐PPARα) or control IgG. The final DNA extraction was polymerase chain reaction‐amplified with a primer pair that covered the sequence in the promoter of Gpx4.
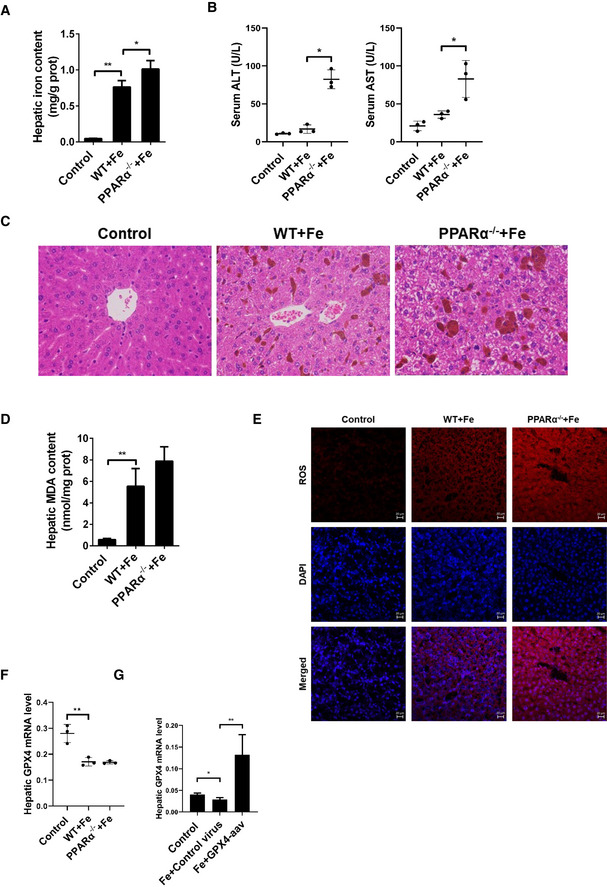
Hepatic iron content was measured in 8‐week‐old WT, PPARα−/− mice that received intraperitoneal injections of dextriferron or saline.
Serum ALT and AST levels was measured in 8‐week‐old WT, PPARα−/− mice that received intraperitoneal injections of dextriferron or saline.
Liver sections were obtained from the indicated mice and stained with H&E. All scale bars are 50 μm. n = 3 biological replicates.
Hepatic MDA content was measured in 8‐week‐old WT, PPARα−/− mice that received intraperitoneal injections of dextriferron or saline.
Measurement of intracellular ROS levels by fluorescent probe DCFH‐DA, and the fluorescence intensity of ROS was calculated. All scale bars are 20 μm. n = 3 biological replicates.
Hepatic Gpx4 mRNA levels were measured in the indicated mice.
Hepatic Gpx4 mRNA levels were measured in the mice that were fed a HID with or without Gpx4‐AAV treatment.
- A
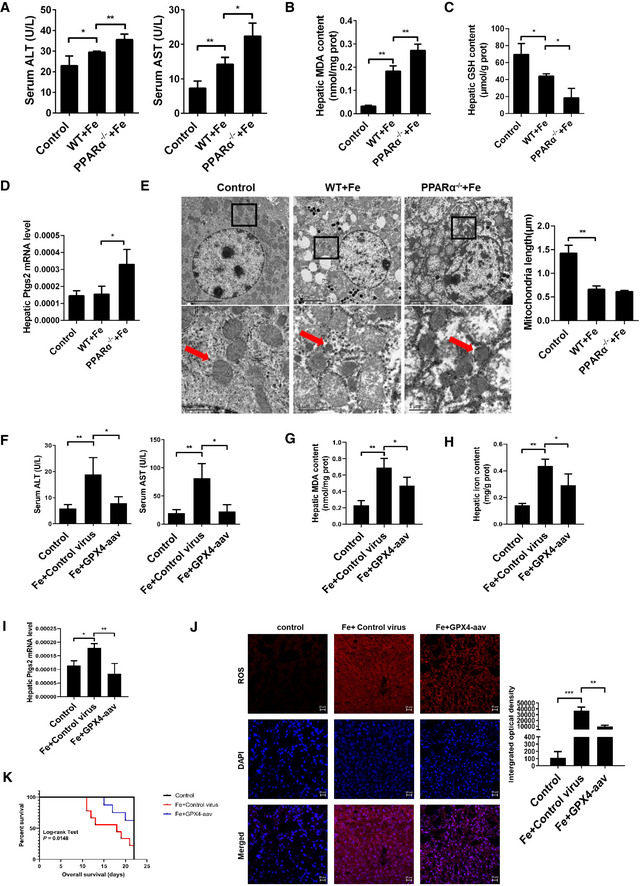
Serum ALT and AST levels were measured in 8‐week‐old WT, PPARα−/− mice that fed a normal diet or a HID; n = 3–5 mice/group.
- B–D
Hepatic MDA content (B), hepatic GSH content (C), hepatic Ptgs2 mRNA levels (D) were measured in the indicated mice. n = 3–5 mice/group.
- E
Liver tissue was obtained from the indicated mice and then examined using transmission electron microscopy (Arrowheads indicate mitochondria). Scale bars are 1 μm and 5 μm. n = 4 biological replicates.
- F
Serum ALT and AST levels were measured in 8‐week‐old PPARα−/− mice that were fed a HID with or without Gpx4‐AAV treatment; n = 8 mice/group.
- G, I
Hepatic MDA content (G), hepatic iron content (H), hepatic Ptgs2 mRNA levels (I) were measured in the indicated mice; n = 8 mice/group.
- J
Measurement of intracellular ROS levels by fluorescent probe DCFH‐DA, and the fluorescence intensity of ROS was calculated. All scale bars are 20 μm. n = 3 biological replicates.
- K
Kaplan–Meier curves with univariate analysis of overall survival based on the Gpx4‐AAV treatment. n = 5–9 mice/group.
- A
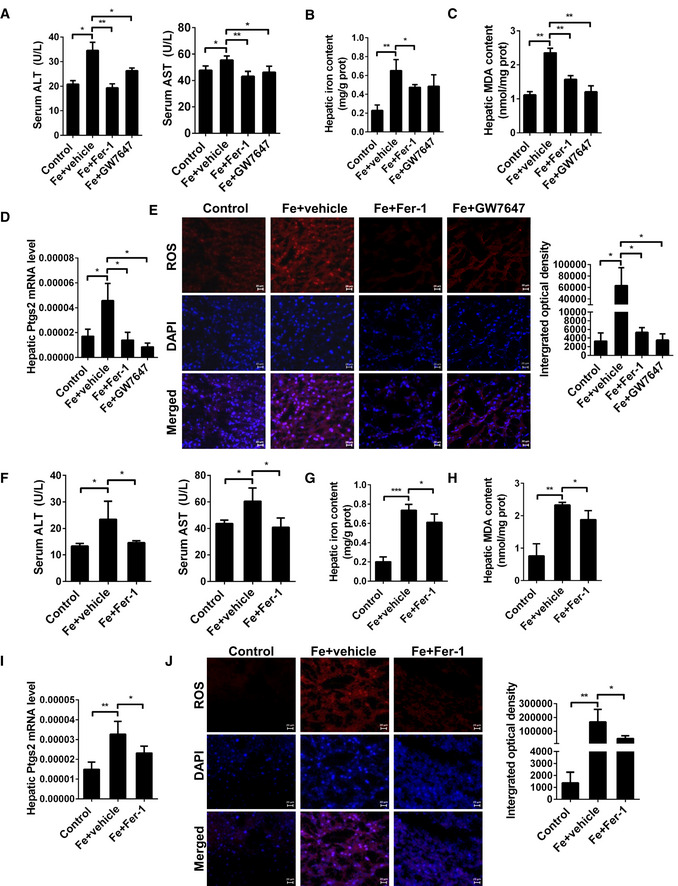
Serum ALT and AST levels were measured in 8‐week‐old WT mice treated with or without Fer‐1 and GW7647 treatment; n = 6 mice/group.
- B–D
Hepatic iron content (B), hepatic MDA content (C), hepatic Ptgs2 mRNA levels (D) were measured in the indicated mice.
- E
Measurement of intracellular ROS levels by fluorescent probe DCFH‐DA, and the fluorescence intensity of ROS was calculated. n = 3 biological replicates. All scale bars are 20 μm.
- F
Serum ALT and AST levels were measured in 20‐week‐old PPARα−/− mice treated with or without Fer‐1; n = 6 mice/group.
- G, I
Hepatic iron content (G), hepatic MDA content (H), hepatic Ptgs2 mRNA levels (I) were measured in the indicated mice. n = 6 mice/group.
- J
Measurement of intracellular ROS levels by fluorescent probe DCFH‐DA, and the fluorescence intensity of ROS was calculated. n = 3 biological replicates. All scale bars are 20 μm.
References
-
- Barrera C, Valenzuela R, Rincon MA, Espinosa A, Echeverria F, Romero N, Gonzalez‐Manan D, Videla LA (2018) Molecular mechanisms related to the hepatoprotective effects of antioxidant‐rich extra virgin olive oil supplementation in rats subjected to short‐term iron administration. Free Radic Biol Med 126: 313–321 - PubMed
-
- Brandt JM, Djouadi F, Kelly DP (1998) Fatty acids activate transcription of the muscle carnitine palmitoyltransferase I gene in cardiac myocytes via the peroxisome proliferator‐activated receptor alpha. J Biol Chem 273: 23786–23792 - PubMed
-
- Cheng L, Ding G, Qin Q, Huang Y, Lewis W, He N, Evans RM, Schneider MD, Brako FA, Xiao Y et al (2004) Cardiomyocyte‐restricted peroxisome proliferator‐activated receptor‐delta deletion perturbs myocardial fatty acid oxidation and leads to cardiomyopathy. Nat Med 10: 1245–1250 - PubMed
Publication types
MeSH terms
Substances
LinkOut - more resources
Full Text Sources
Molecular Biology Databases
