

Stimulating native seizures with neural resonance: a new approach to localize the seizure onset zone
- PMID: 35703986
- PMCID: PMC10200285
- DOI: 10.1093/brain/awac214
Stimulating native seizures with neural resonance: a new approach to localize the seizure onset zone
Abstract
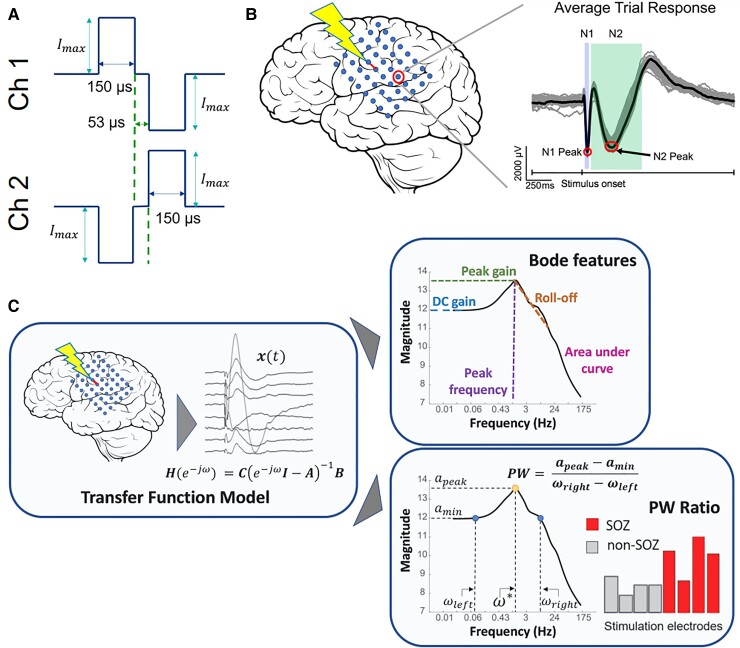
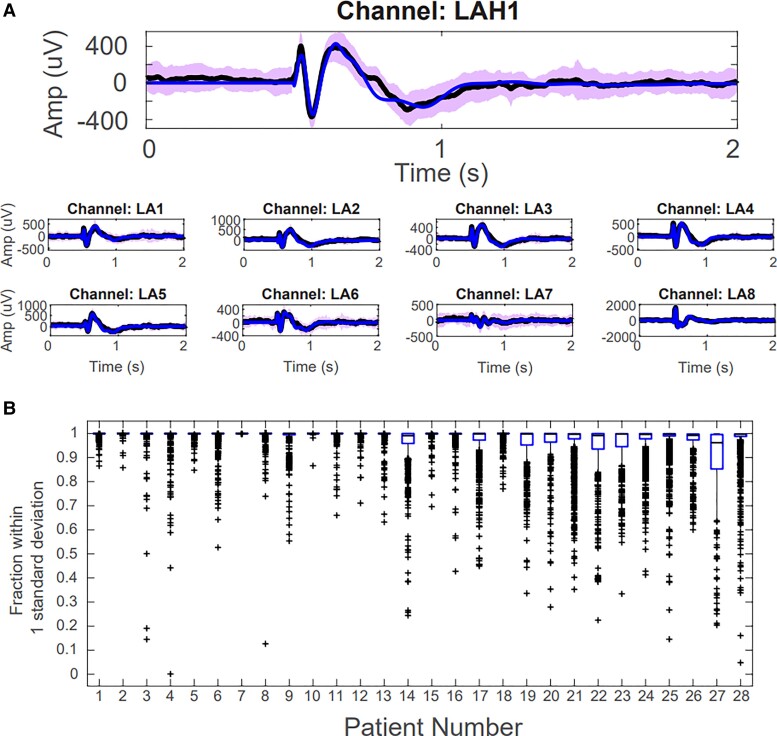
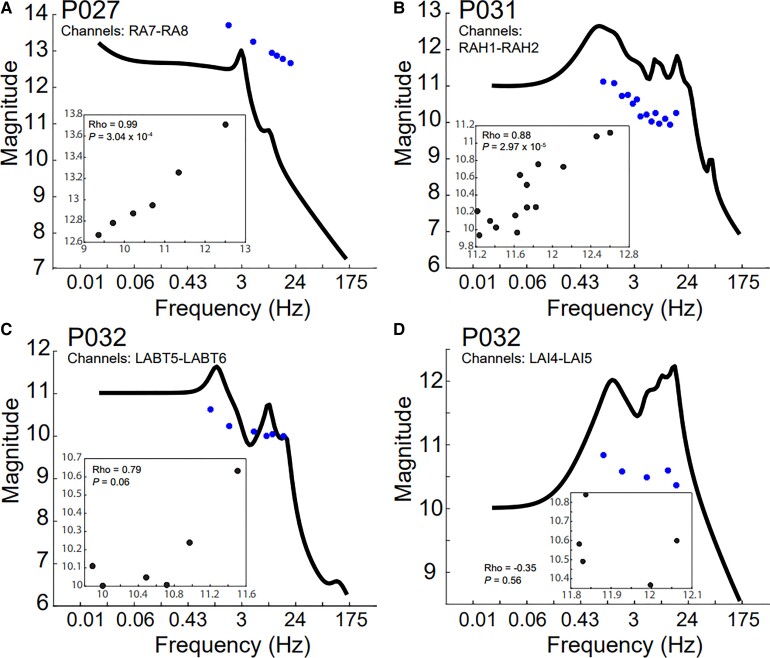
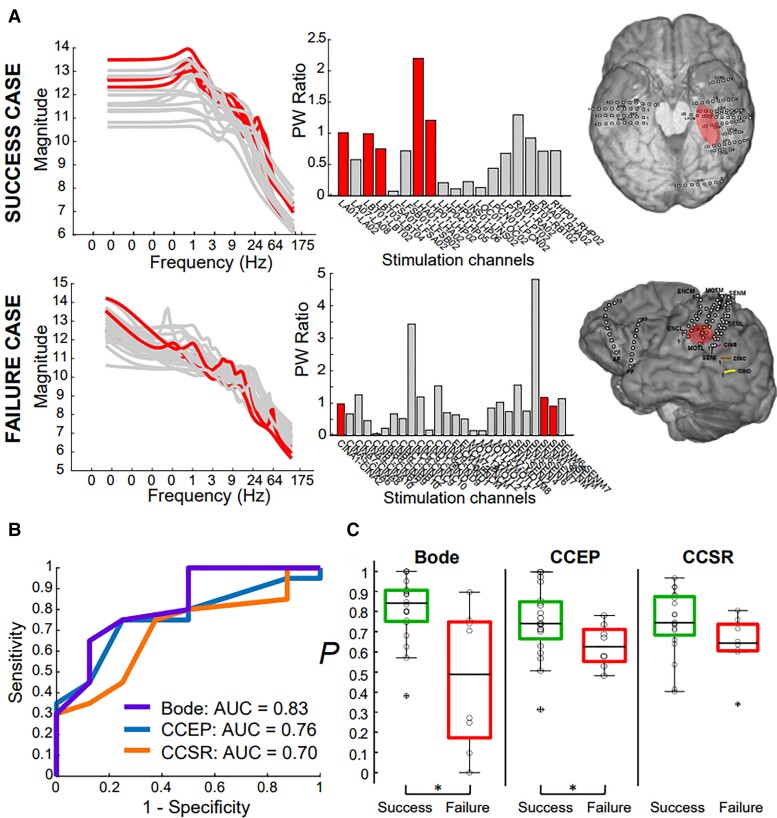
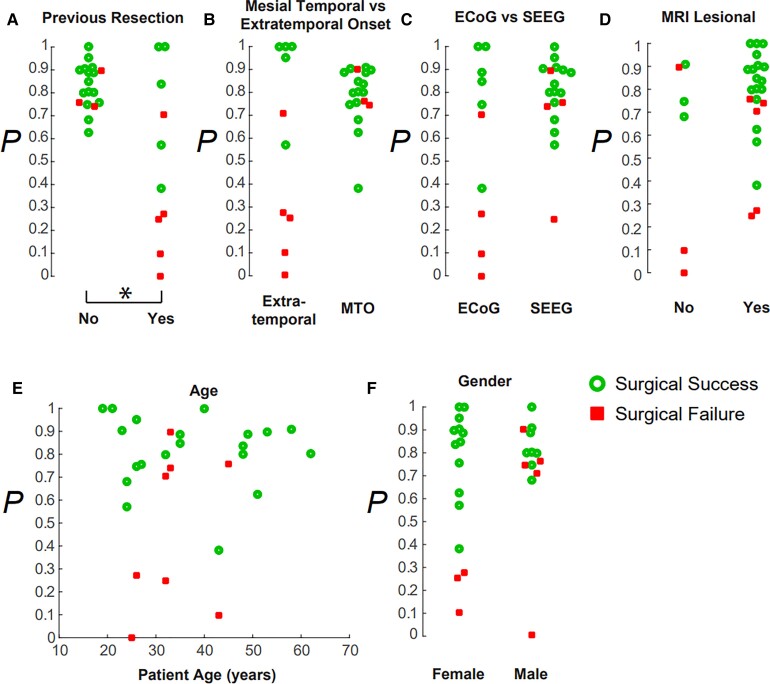
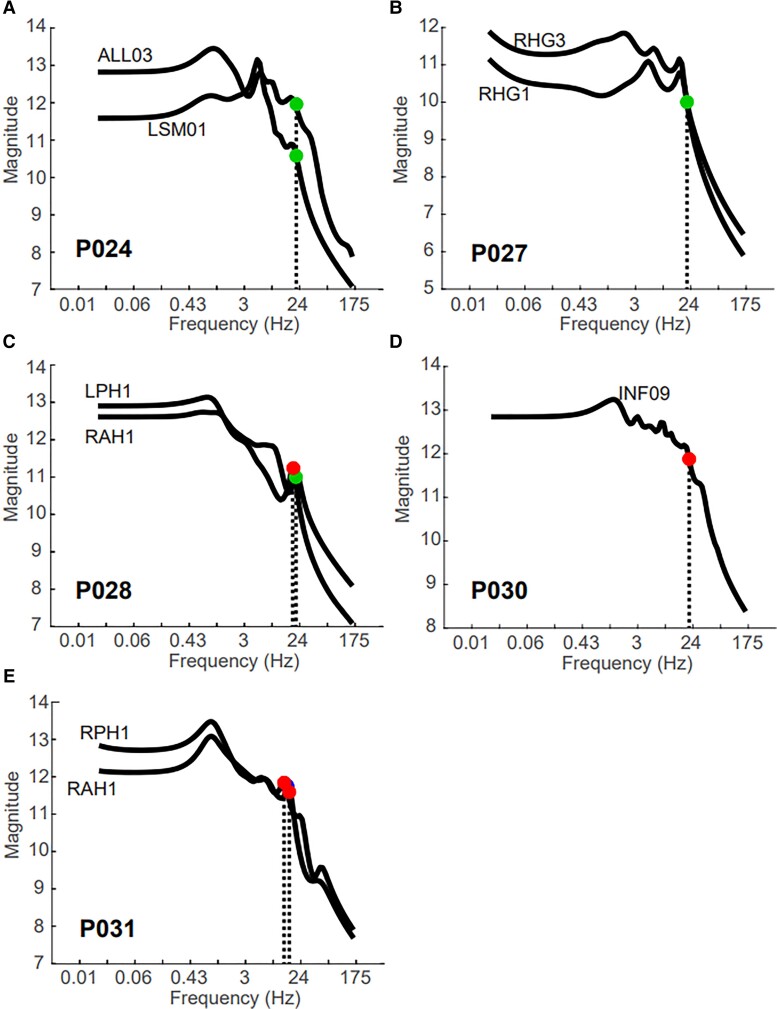
Successful outcomes in epilepsy surgery rely on the accurate localization of the seizure onset zone. Localizing the seizure onset zone is often a costly and time-consuming process wherein a patient undergoes intracranial EEG monitoring, and a team of clinicians wait for seizures to occur. Clinicians then analyse the intracranial EEG before each seizure onset to identify the seizure onset zone and localization accuracy increases when more seizures are captured. In this study, we develop a new approach to guide clinicians to actively elicit seizures with electrical stimulation. We propose that a brain region belongs to the seizure onset zone if a periodic stimulation at a particular frequency produces large amplitude oscillations in the intracranial EEG network that propagate seizure activity. Such responses occur when there is 'resonance' in the intracranial EEG network, and the resonant frequency can be detected by observing a sharp peak in the magnitude versus frequency response curve, called a Bode plot. To test our hypothesis, we analysed single-pulse electrical stimulation response data in 32 epilepsy patients undergoing intracranial EEG monitoring. For each patient and each stimulated brain region, we constructed a Bode plot by estimating a transfer function model from the intracranial EEG 'impulse' or single-pulse electrical stimulation response. The Bode plots were then analysed for evidence of resonance. First, we showed that when Bode plot features were used as a marker of the seizure onset zone, it distinguished successful from failed surgical outcomes with an area under the curve of 0.83, an accuracy that surpassed current methods of analysis with cortico-cortical evoked potential amplitude and cortico-cortical spectral responses. Then, we retrospectively showed that three out of five native seizures accidentally triggered in four patients during routine periodic stimulation at a given frequency corresponded to a resonant peak in the Bode plot. Last, we prospectively stimulated peak resonant frequencies gleaned from the Bode plots to elicit seizures in six patients, and this resulted in an induction of three seizures and three auras in these patients. These findings suggest neural resonance as a new biomarker of the seizure onset zone that can guide clinicians in eliciting native seizures to more quickly and accurately localize the seizure onset zone.
Keywords: cortico-cortical evoked potentials; dynamical network model; seizure induction; single-pulse electrical stimulation; surgical outcome.
© The Author(s) 2022. Published by Oxford University Press on behalf of the Guarantors of Brain. All rights reserved. For permissions, please e-mail: journals.permissions@oup.com.
Conflict of interest statement
The authors report no competing interests.
Figures
Comment in
-
Engineers drive new directions in translational epilepsy research.Brain. 2022 Nov 21;145(11):3725-3726. doi: 10.1093/brain/awac375. Brain. 2022. PMID: 36412514 No abstract available.
References
-
- Cardarelli WJ, Smith BJ. The burden of epilepsy to patients and payers. Am J Manag Care. 2010;16:S331–S336. - PubMed
-
- Lüders HO, Najm I, Nair D, Widdess-Walsh P, Bingman W. The epileptogenic zone: general principles. Epileptic Disord. 2006; 8:1–9. - PubMed
-
- Jobst BC, Cascino GD. Resective epilepsy surgery for drug-resistant focal epilepsy: A review. JAMA. 2015;313:285–293. - PubMed
-
- Malmgren K, Edelvik A. Long-term outcomes of surgical treatment for epilepsy in adults with regard to seizures, antiepileptic drug treatment and employment. Seizure. 2017;44:217–224. - PubMed
