. 2022 Nov;25(4):455-470.
doi: 10.1007/s10456-022-09842-9. Epub 2022 Jun 15.

In vitro grafting of hepatic spheroids and organoids on a microfluidic vascular bed

Affiliations

In vitro grafting of hepatic spheroids and organoids on a microfluidic vascular bed

Flavio Bonanini et al. Angiogenesis. 2022 Nov.

Abstract

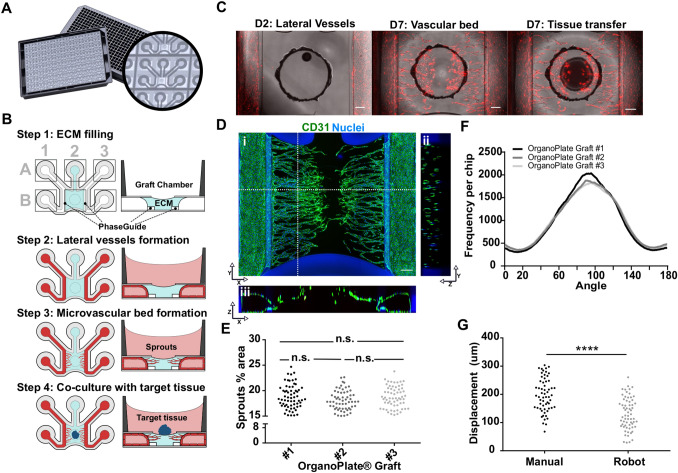
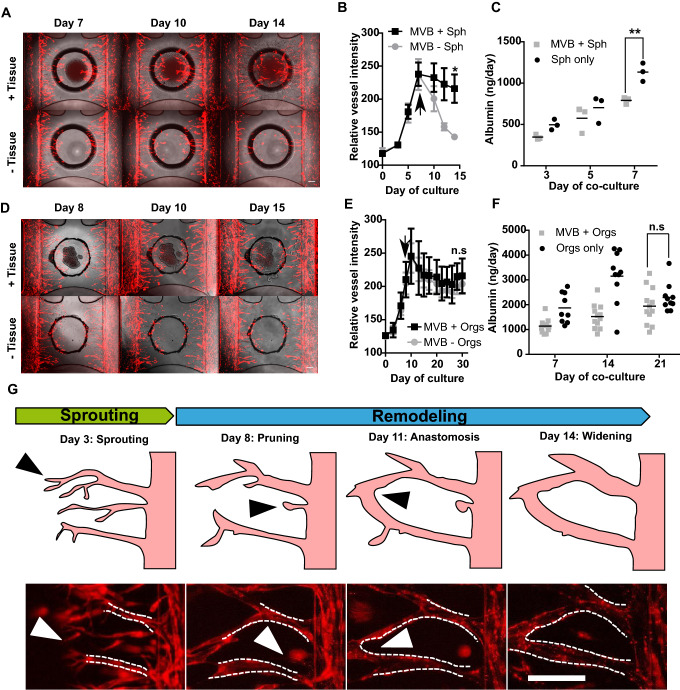
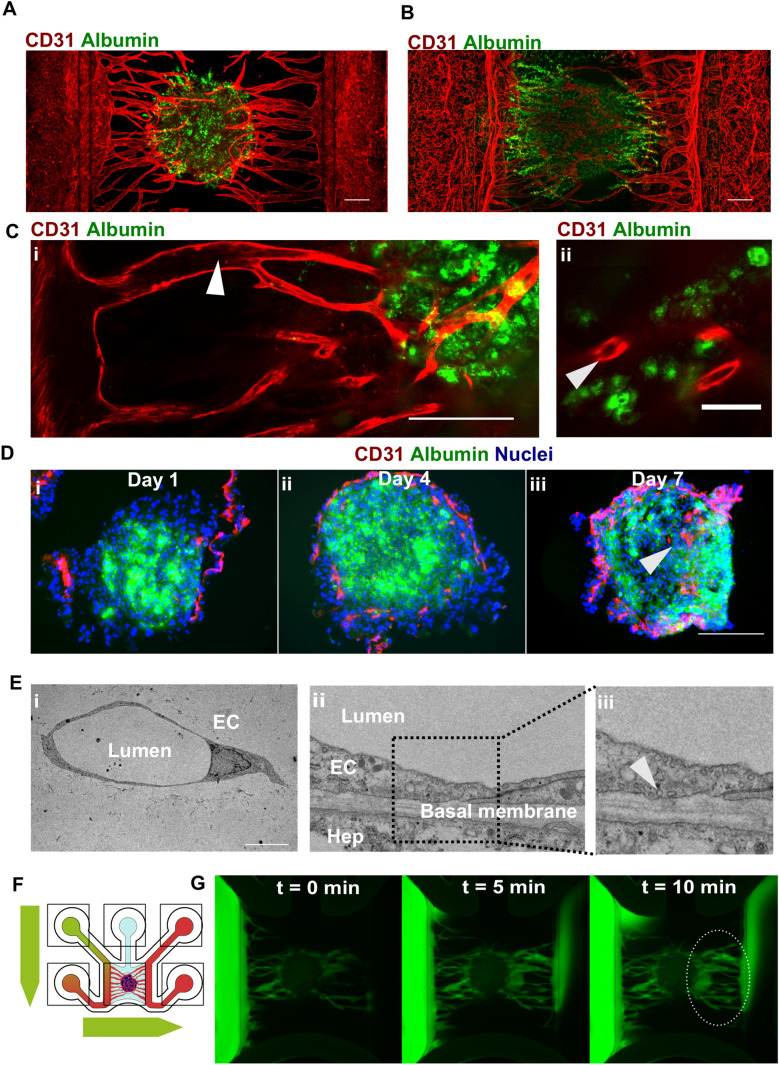
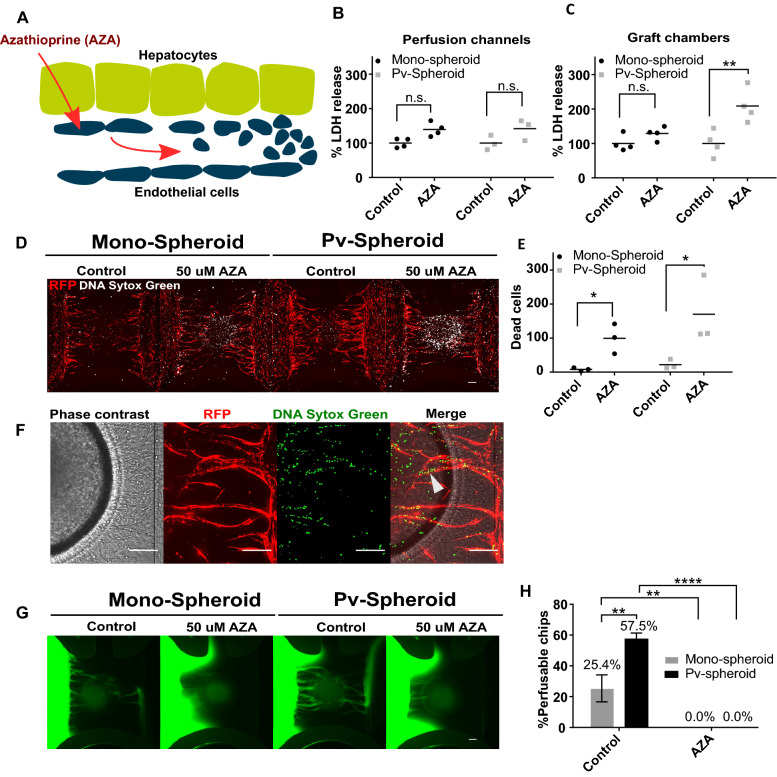
With recent progress in modeling liver organogenesis and regeneration, the lack of vasculature is becoming the bottleneck in progressing our ability to model human hepatic tissues in vitro. Here, we introduce a platform for routine grafting of liver and other tissues on an in vitro grown microvascular bed. The platform consists of 64 microfluidic chips patterned underneath a 384-well microtiter plate. Each chip allows the formation of a microvascular bed between two main lateral vessels by inducing angiogenesis. Chips consist of an open-top microfluidic chamber, which enables addition of a target tissue by manual or robotic pipetting. Upon grafting a liver microtissue, the microvascular bed undergoes anastomosis, resulting in a stable, perfusable vascular network. Interactions with vasculature were found in spheroids and organoids upon 7 days of co-culture with space of Disse-like architecture in between hepatocytes and endothelium. Veno-occlusive disease was induced by azathioprine exposure, leading to impeded perfusion of the vascularized spheroid. The platform holds the potential to replace animals with an in vitro alternative for routine grafting of spheroids, organoids, or (patient-derived) explants.

Keywords: In vitro grafting; Liver organoids and spheroids; Microfluidics; Vascularization.


Conflict of interest statement

Paul Vulto, Dorota Kurek, Flavio Bonanini, Sara Previdi, Sander de Ruiter, Bart Kramer, Rumaisha Annida, Silvia Bonilla García, Karla Queiroz, Marine Meyer, Maria Clapés Cabrer, Roelof Dinkelberg, Thomas Olivier, Arnaud Nicolas, Karel Domansky, Erik Walinga, Jos Joore, Henriette L. Lanz, Sebastiaan J. Trietsch, and Bob Ronden are employees of Mimetas BV, which is marketing the OrganoPlate Graft and Paul Vulto, Jos Joore, and Sebastiaan J. Trietsch are shareholders of Mimetas BV. OrganoPlate is a registered trademark of Mimetas BV. Hans Clevers is inventor on several patents related to organoid technology; his full disclosure is given at https://www.uu.nl/staff/JCClevers/. Since March 2022, HC is Head of Pharma Research and Early Development (pRED) of F. Hoffmann-La Roche Ltd, Basel, Switzerland. The authors have no additional financial interests.

Figures

Fig. 1
Fig. 1
The OrganoPlate Graft allows for the generation of robust microvascular beds. a Top and bottom views of the OrganoPlate Graft with 64 microfluidic units positioned underneath a 384 microtiter plate. Each microfluidic unit makes use of a 2 × 3 array of wells from the microtiter plate (insert image). b Sequence of steps for generating a microvascular bed. Step 1: the graft chamber is filled with Collagen I gel (depicted in blue) through the gel inlet A2. Step 2: endothelial cells are seeded against collagen I gel (depicted in red) in the two lateral perfusion channels and form tubules upon application of perfusion flow. Step 3: Angiogenic factors are added to the graft chamber B2 to induce sprouting of the lateral vessels and formation of the vascular bed. Step 4: once microvessels have reached the opening on the graft chamber, a target microtissue is positioned on top of the microvascular bed to initiate interaction. c Images of an RFP-labeled HUVEC vascular bed formation prior to application of angiogenic factors (left) and after (middle). The target tissue is then positioned on the center of the graft chamber opening (right). Scale bar: 200 µm. d Maximum intensity projection (i) and cross sections (ii, iii) of a microvascular bed stained against CD31 (green) and nuclei (blue). Microvessels with a lumen are apparent. Location of cross sections is indicated by dash lines. Scale bars: 200 µm. e Quantification of sprout area coverage in 64 microfluidic units per OrganoPlate for three different plates (n = 192) after microvascular bed formation. Significance was calculated using one-way ANOVA and shown as non-significant (ns, P > 0.05). f Average distribution frequency of the orientation of microvascular structures (90 degrees indicates horizontal alignment) from 3 different OrganoPlate Grafts. g Evaluation of manual and robotic placement accuracy of target tissue on top of the microvascular bed. Statistical significance was attributed to values of P < 0.05 as determined by unpaired Student’s t test
Fig. 2
Fig. 2
Vascular remodeling is induced by hepatic microtissues. a Phase-contrast images with fluorescence overlay of hepatocyte spheroids grafted on top of a microvascular bed (top panel) in comparison to a microvascular bed only (bottom panel) at day 7, 10 and 14 of culture which represent day 0, 3, and 7 of co-culture. Scale bar: 200 µm. b Relative microvascular bed (MVB) RFP signal in presence (black squares) or absence (gray circles) of hepatocyte spheroids (Sph) during 14 days of culture. Spheroids were transferred at day 7 of culture as indicated by the black arrow. Data represents mean ± SD, n = 8–16, statistical significance was attributed to value of *P < 0.01 as determined by unpaired Student’s t test on day 14 timepoint. c Albumin secretion of hepatocyte spheroids during 7 days of co-culture in the presence (gray squares) or absence (black circles) of a microvascular bed. Dots represent individual chips, line represents mean, n = 3, statistical significance was attributed to value of **P < 0.001 as determined by unpaired Student’s t test on day 14 timepoint. d Phase-contrast images with fluorescence overlay of hepatic organoids grafted on top of a microvascular bed (top panel) in comparison to a microvascular bed only (bottom panel) at day 8, 10 and 14 of culture which represent day 0, 2 and 6 of co-culture. Sale bar: 200 µm. e Relative microvascular bed (MVB) RFP signal in the presence (black squares) or absence (gray circles) of hepatic organoids (orgs) during 30 days of culture. Organoids were transferred at day 8 of culture as indicated by the black arrow. Data represent mean ± SD, n = 8–14, significance was calculated by unpaired Student’s t test on day 30 timepoint and shown as non-significant (n.s., P > 0.05). f Albumin secretion of hepatocyte organoids during 21 days of co-culture in the presence (gray squares) or absence (black circles) of a microvascular bed. Dots represent individual chips, line represents mean, n = 5–9, significance was calculated by unpaired Student’s t test on day 21 timepoint and shown as non-significant (n.s., P > 0.05). g Angiogenesis process of RFP-labeled HUVEC during initial sprouting and subsequent vascular structures remodeling in the presence of a hepatocyte spheroid from day 7 of culture. Pictures show filopodia (left, white arrow), microvessel retraction (middle left, white arrow), anastomosis (middle right, white arrow) and widening (right). Scale bar: 200 µm
Fig. 3
Fig. 3
Endothelial cells penetrate hepatic microtissues forming lunemized, perfusable microvasculature. a Maximum intensity projection of hepatocyte spheroid co-cultured with microvessels for 7 days and stained against albumin (green) and CD31 (red). Scale bar: 200 µm. b Maximum intensity projection of hepatocyte organoids co-cultured with microvessels for 21 days and stained against albumin (green) and CD31 (red). Scale bar: 200 µm. c Single-plane confocal images of hepatocyte spheroid co-cultured with microvessels for 7 days and stained against albumin (green) and CD31 (red). Lumenized spaces are observable in the vessels connecting the main tubes to the hepatocyte spheroid (I, white arrow) and in close proximity of hepatocytes (ii, white arrow). Scale bar: 200 µm (i) and 50 µm (ii). d Cryo-sections of spheroids co-cultured for 1 (i), 4 (ii), and 7 (iii) days on microvascular beds stained against albumin (green), CD31 (red), and nuclei (blue). White arrow indicates penetration of CD31 + endothelial cells inside the hepatocyte spheroid. Scale bar: 200 µm. e EM images of sections of hepatocyte organoids co-cultured with microvessels for 7 days indicating endothelial cells (EC) with distinct lumen (i) and vascular-hepatic contact point (ii) with intracellular pinocytic vesicles (iii, white arrow). Scale bar: 10 µm. f Schematic depiction of flow through the chip to assess perfusability of vascularized liver cultures using 150-KDa FITC-labeled dextran. g Over-time fluorescence microscopy images of 150-KDa FITC-labeled dextran perfusing a hepatocyte spheroid co-cultured for 7 days with microvessels. Dotted ellipse indicates FITC-labeled dextran emerging from the spheroid and flowing in the lateral perfusion channel
Fig. 4
Fig. 4
Vascularized human liver model of toxin-induced veno-occlusive disease. a A schematic diagram of Azathioprine-induced hepatic veno-occlusive disease. b Perfusion lane LDH release upon exposure to 50 µM azathioprine (AZA) for 48 h (days 5–7 of co-culture with microvessels). Dots represent individual chips, line represents mean, n = 3–4, significance was calculated using two-way ANOVA and shown as non-significant (n.s., Tukey’s multiple comparison test, P > 0.05). c Graft chamber LDH release upon exposure of 50 µM azathioprine for 48 h (days 5–7 of co-culture with microvessels). Dots represent individual chips, line represents mean, n = 3–4. Significance was calculated using two-way ANOVA (Tueky’s multiple comparison test, n.s, P > 0.05, **P < 0.01) d Fluorescent images overlay of RFP-HUVEC (red) with dead cells (white) after 48 h exposure to 50 µM AZA. e Quantification of dead cells in the graft chamber upon exposure to 50 µM AZA. Dots represent individual chips, line represents mean, n = 3, significance was calculated using two-way ANOVA (Tukey’s multiple comparison test, *P < 0.05). f representative images of pre-vascularized spheroid cultures exposed to 50 µM AZA indicating the presence of dead cells inside intact vessels (white arrow). Scale bar = 200 µm. g Representative fluorescent images of FITC-labeled dextran after 5 min of perfusion. Dotted ellipse indicates FITC-labeled dextran emerging from the spheroid and flowing in the lateral perfusion channel. h Percentage of perfusable chips/OrganoPlate (8 chips/condition in a total of five plates) after AZA treatment. Bar represents mean ± SEM, n = 5. Significance was calculated using two-way ANOVA (Tukey’s multiple comparison test, *P < 0.05, ****P < 0.0001)

Similar articles

Cited by

References

    1. Fennema E, Rivron N, Rouwkema J, van Blitterswijk C, De Boer J. Spheroid culture as a tool for creating 3D complex tissues. Trends Biotechnol. 2013;31(2):108–115. doi: 10.1016/j.tibtech.2012.12.003. - DOI - PubMed
    1. Prior N, Inacio P, Huch M. Liver organoids: from basic research to therapeutic applications. Gut. 2019;68(12):2228–2237. doi: 10.1136/gutjnl-2019-319256. - DOI - PMC - PubMed
    1. Grebenyuk S, Ranga A. Engineering organoid vascularization. Front Bioeng Biotechnol. 2019;7(March):1–12. - PMC - PubMed
    1. Si-Tayeb K, Lemaigre FP, Duncan SA. Organogenesis and development of the liver. Dev Cell. 2010;18(2):175–189. doi: 10.1016/j.devcel.2010.01.011. - DOI - PubMed
    1. Ni Y, Li JM, Liu MK, Zhang TT, Wang DP, Zhou WH, et al. Pathological process of liver sinusoidal endothelial cells in liver diseases. World J Gastroenterol. 2021;23(43):7666–7677. doi: 10.3748/wjg.v23.i43.7666. - DOI - PMC - PubMed

Publication types

LinkOut - more resources