. 2022 Jun 1;63(6):15.
doi: 10.1167/iovs.63.6.15.

Axial Length Distributions in Patients With Genetically Confirmed Inherited Retinal Diseases

Affiliations

Axial Length Distributions in Patients With Genetically Confirmed Inherited Retinal Diseases

Katie M Williams et al. Invest Ophthalmol Vis Sci. .

Abstract

Purpose: We investigated axial length (AL) distributions in inherited retinal diseases (IRDs), comparing them with reference cohorts.

Methods: AL measurements from IRD natural history study participants were included and compared with reference cohorts (TwinsUK, Raine Study Gen2-20, and published studies). Comparing with the Raine Study cohort, formal odds ratios (ORs) for AL ≥ 26 mm or AL ≤ 22 mm were derived for each IRD (Firth's logistic regression model, adjusted for age and sex).

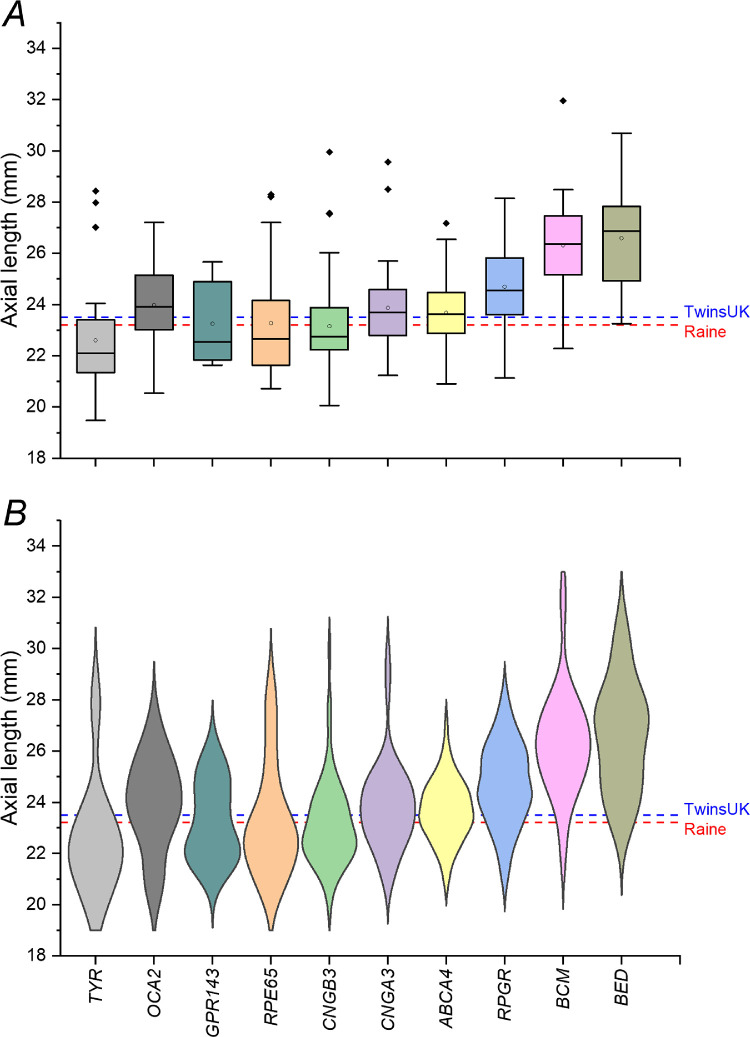
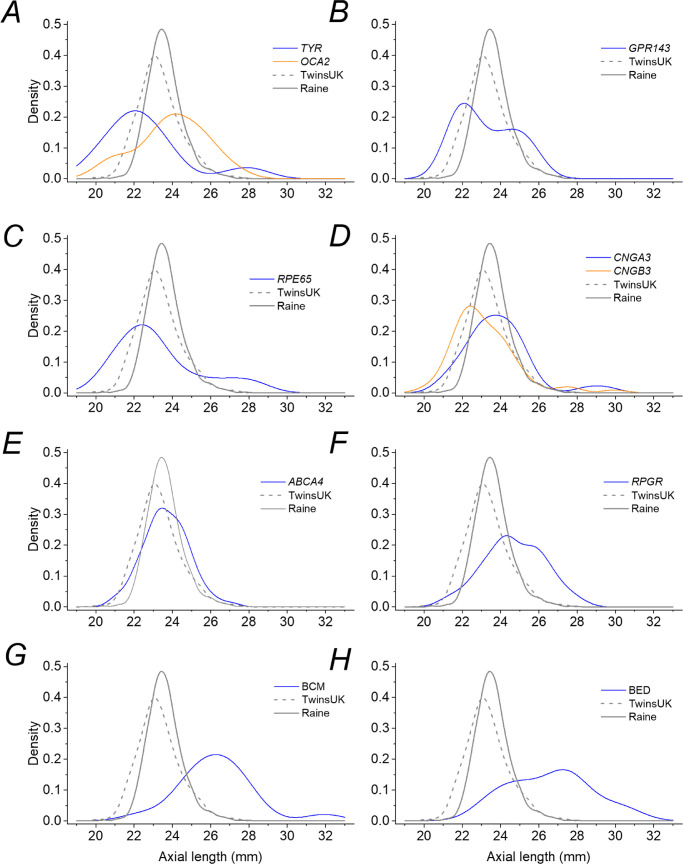
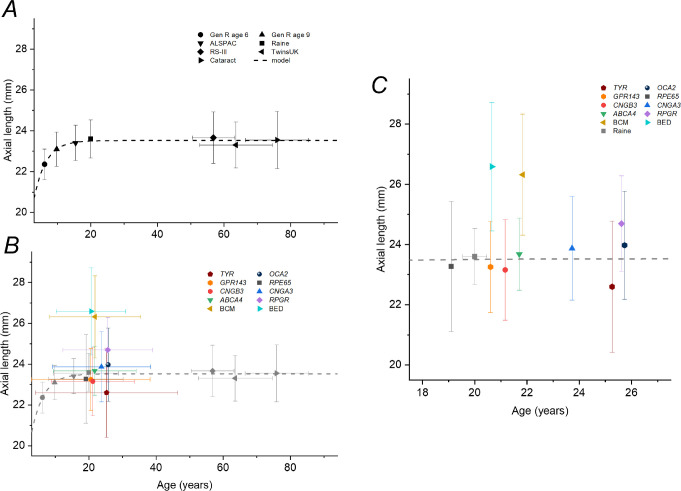
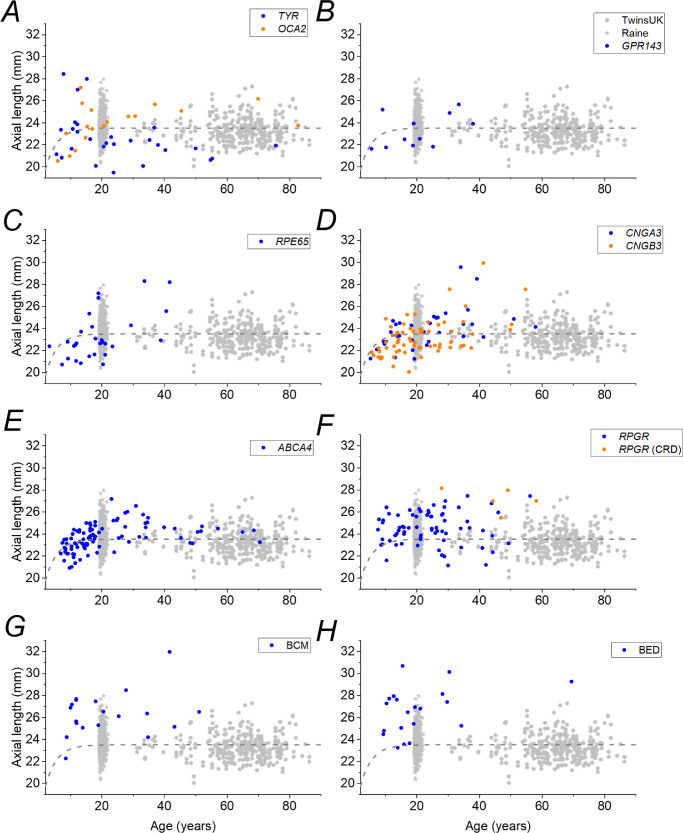
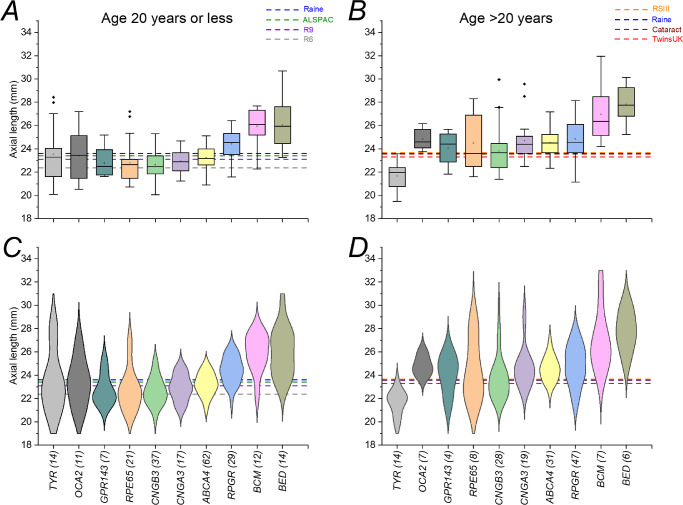
Results: Measurements were available for 435 patients (median age, 19.5 years). Of 19 diseases, 10 had >10 participants: ABCA4 retinopathy; CNGB3- and CNGA3-associated achromatopsia; RPGR-associated disease; RPE65-associated disease; blue cone monochromacy (BCM); Bornholm eye disease (BED); TYR- and OCA2-associated oculocutaneous albinism; and GPR143-associated ocular albinism. Compared with the TwinsUK cohort (n = 322; median age, 65.1 years) and Raine Study cohort (n = 1335; median age, 19.9 years), AL distributions were wider in the IRD groups. Increased odds for longer ALs were observed for BCM, BED, RPGR, RPE65, OCA2, and TYR; increased odds for short AL were observed for RPE65, TYR, and GPR143. In subanalysis of RPGR-associated disease, longer average ALs occurred in cone-rod dystrophy (n = 5) than rod-cone dystrophy (P = 0.002).

Conclusions: Several diseases showed increased odds for longer AL (highest OR with BCM); some showed increased odds for shorter AL (highest OR with GPR143). Patients with RPE65- and TYR-associated disease showed increased odds for longer and for shorter eyes. Albinism genes were associated with different effects on AL. These findings add to the phenotype of IRDs and may yield insights into mechanisms of refractive error development.


Conflict of interest statement

Disclosure: K.M. Williams, None; M. Georgiou, None; A. Kalitzeos, None; I. Chow, None; P.G. Hysi, None; A.G. Robson, None; G. Lingham, None; F.K. Chen, None; D.A. Mackey, None; A.R. Webster, None; C.J. Hammond, None; P. Prokhoda, None; J. Carroll, None; M. Michaelides, None; O.A. Mahroo, None

Figures

Figure 1.
Figure 1.
Axial lengths in inherited retinal diseases for which there were more than 10 participants. (A) Boxplots (open circles denote means; filled diamonds denote outliers). (B) Violin plots. Dashed lines show mean ALs for the TwinsUK and Raine Study cohorts as labeled. Compared with the reference cohorts, average ALs were clearly longer in BCM, BED, and RPGR- and OCA2-associated disease.
Figure 2.
Figure 2.
Density distributions for axial lengths for each IRD subtype. Blue curves plot the density for each condition in each panel as follows: (A) TYR-associated albinism (orange curve shows the density for OCA2-associated albinism); (B) GPR143-associated ocular albinism; (C) RPE65-associated disease; (D) CNGA3-associated achromatopsia (orange curve shows the density for CNGB3-associated achromatopsia); (E) ABCA4-associated retinopathy (Stargardt disease); (F) RPGR-associated disease; (G) BCM; and (H) BED. The gray solid and dashed curves in each panel show distributions for the Raine Study and TwinsUK cohorts, respectively.
Figure 3.
Figure 3.
Mean ALs plotted against average age for reference cohorts and IRD patients. (A) Mean ALs for a number of reference cohorts of different ages. Horizontal and vertical error bars show standard deviations. The dashed curve plots an exponential recovery relation fitted empirically to the data. Note that, because these are not longitudinal data, there will be a cohort effect (with increasing prevalence of myopia in many populations), so the younger individuals are likely in the future to have longer eyes when they reach the age of the older cohorts in comparison to those cohorts. (B) Data for IRD subgroups (colored symbols) superimposed on reference data (here shown in gray). (C) Data from (B) are replotted with an expanded x-axis covering the mean ages of the patient cohorts and with the horizontal error bars for the patient cohorts removed to aid clarity.
Figure 4.
Figure 4.
Axial lengths plotted against age for individual participants in each IRD group. Blue symbols plot data for IRD patients as follows: (A) TYR-associated albinism (orange symbols for OCA2-associated albinism); (B) GPR143-associated ocular albinism; (C) RPE65-associated disease; (D) CNGA3-associated achromatopsia (orange symbols for CNGB3-associated achromatopsia); (E) ABCA4-associated retinopathy (Stargardt disease); (F) RPGR-associated disease (orange symbols for cone–rod disease); (G) BCM; and (H) BED. Gray hexagons and stars in each panel show distributions for the TwinsUK and Raine Study cohorts, respectively. The dashed curve in each panel re-plots empirical relations describing reference data in Figure 3.
Figure 5.
Figure 5.
Axial lengths in inherited retinal disease patients divided into younger and older age groups. (A, B) Boxplots (open circles denote means; filled diamonds denote outliers). (C, D) Violin plots. The left-hand panels include patients up to 20 years old; the right-hand panels include patients older than 20 years. Horizontal dashed lines show mean ALs for relevant healthy cohorts. Numbers of patients included in each group are shown in brackets for each condition.

References

    1. Dolgin E. The myopia boom. Nature. 2015; 519: 276–278. - PubMed
    1. Ashby R, Ohlendorf A, Schaeffel F.. The effect of ambient illuminance on the development of deprivation myopia in chicks. Invest Ophthalmol Vis Sci. 2009; 50: 5348–5354. - PubMed
    1. Ashby R. Animal studies and the mechanism of myopia-protection by light? Optom Vis Sci. 2016; 93: 1052–1054. - PubMed
    1. Hendriks M, Verhoeven VJM, Buitendijk GHS, et al. .. Development of refractive errors-what can we learn from inherited retinal dystrophies? Am J Ophthalmol. 2017; 182: 81–89. - PubMed
    1. Tedja MS, Wojciechowski R, Hysi P, et al. .. Light processing and regulators are important mechanisms in refractive error. Invest Ophthalmol Vis Sci. 2017; 58: 1225.

Publication types

Supplementary concepts