

Experiences of Everyday Ageism and the Health of Older US Adults
- PMID: 35704314
- PMCID: PMC9201677
- DOI: 10.1001/jamanetworkopen.2022.17240
Experiences of Everyday Ageism and the Health of Older US Adults
Abstract
Importance: Major incidents of ageism have been shown to be associated with poorer health and well-being among older adults. Less is known about routine types of age-based discrimination, prejudice, and stereotyping that older adults encounter in their day-to-day lives, known as everyday ageism.
Objective: To examine the prevalence of everyday ageism, group differences and disparities, and associations of everyday ageism with indicators of poor physical and mental health.
Design, setting, and participants: This cross-sectional study was conducted using survey data from the December 2019 National Poll on Healthy Aging among a nationally representative household sample of US adults ages 50 to 80 years. Data were analyzed from November 2021 through April 2022.
Exposures: Experiences of everyday ageism were measured using the newly developed multidimensional Everyday Ageism Scale.
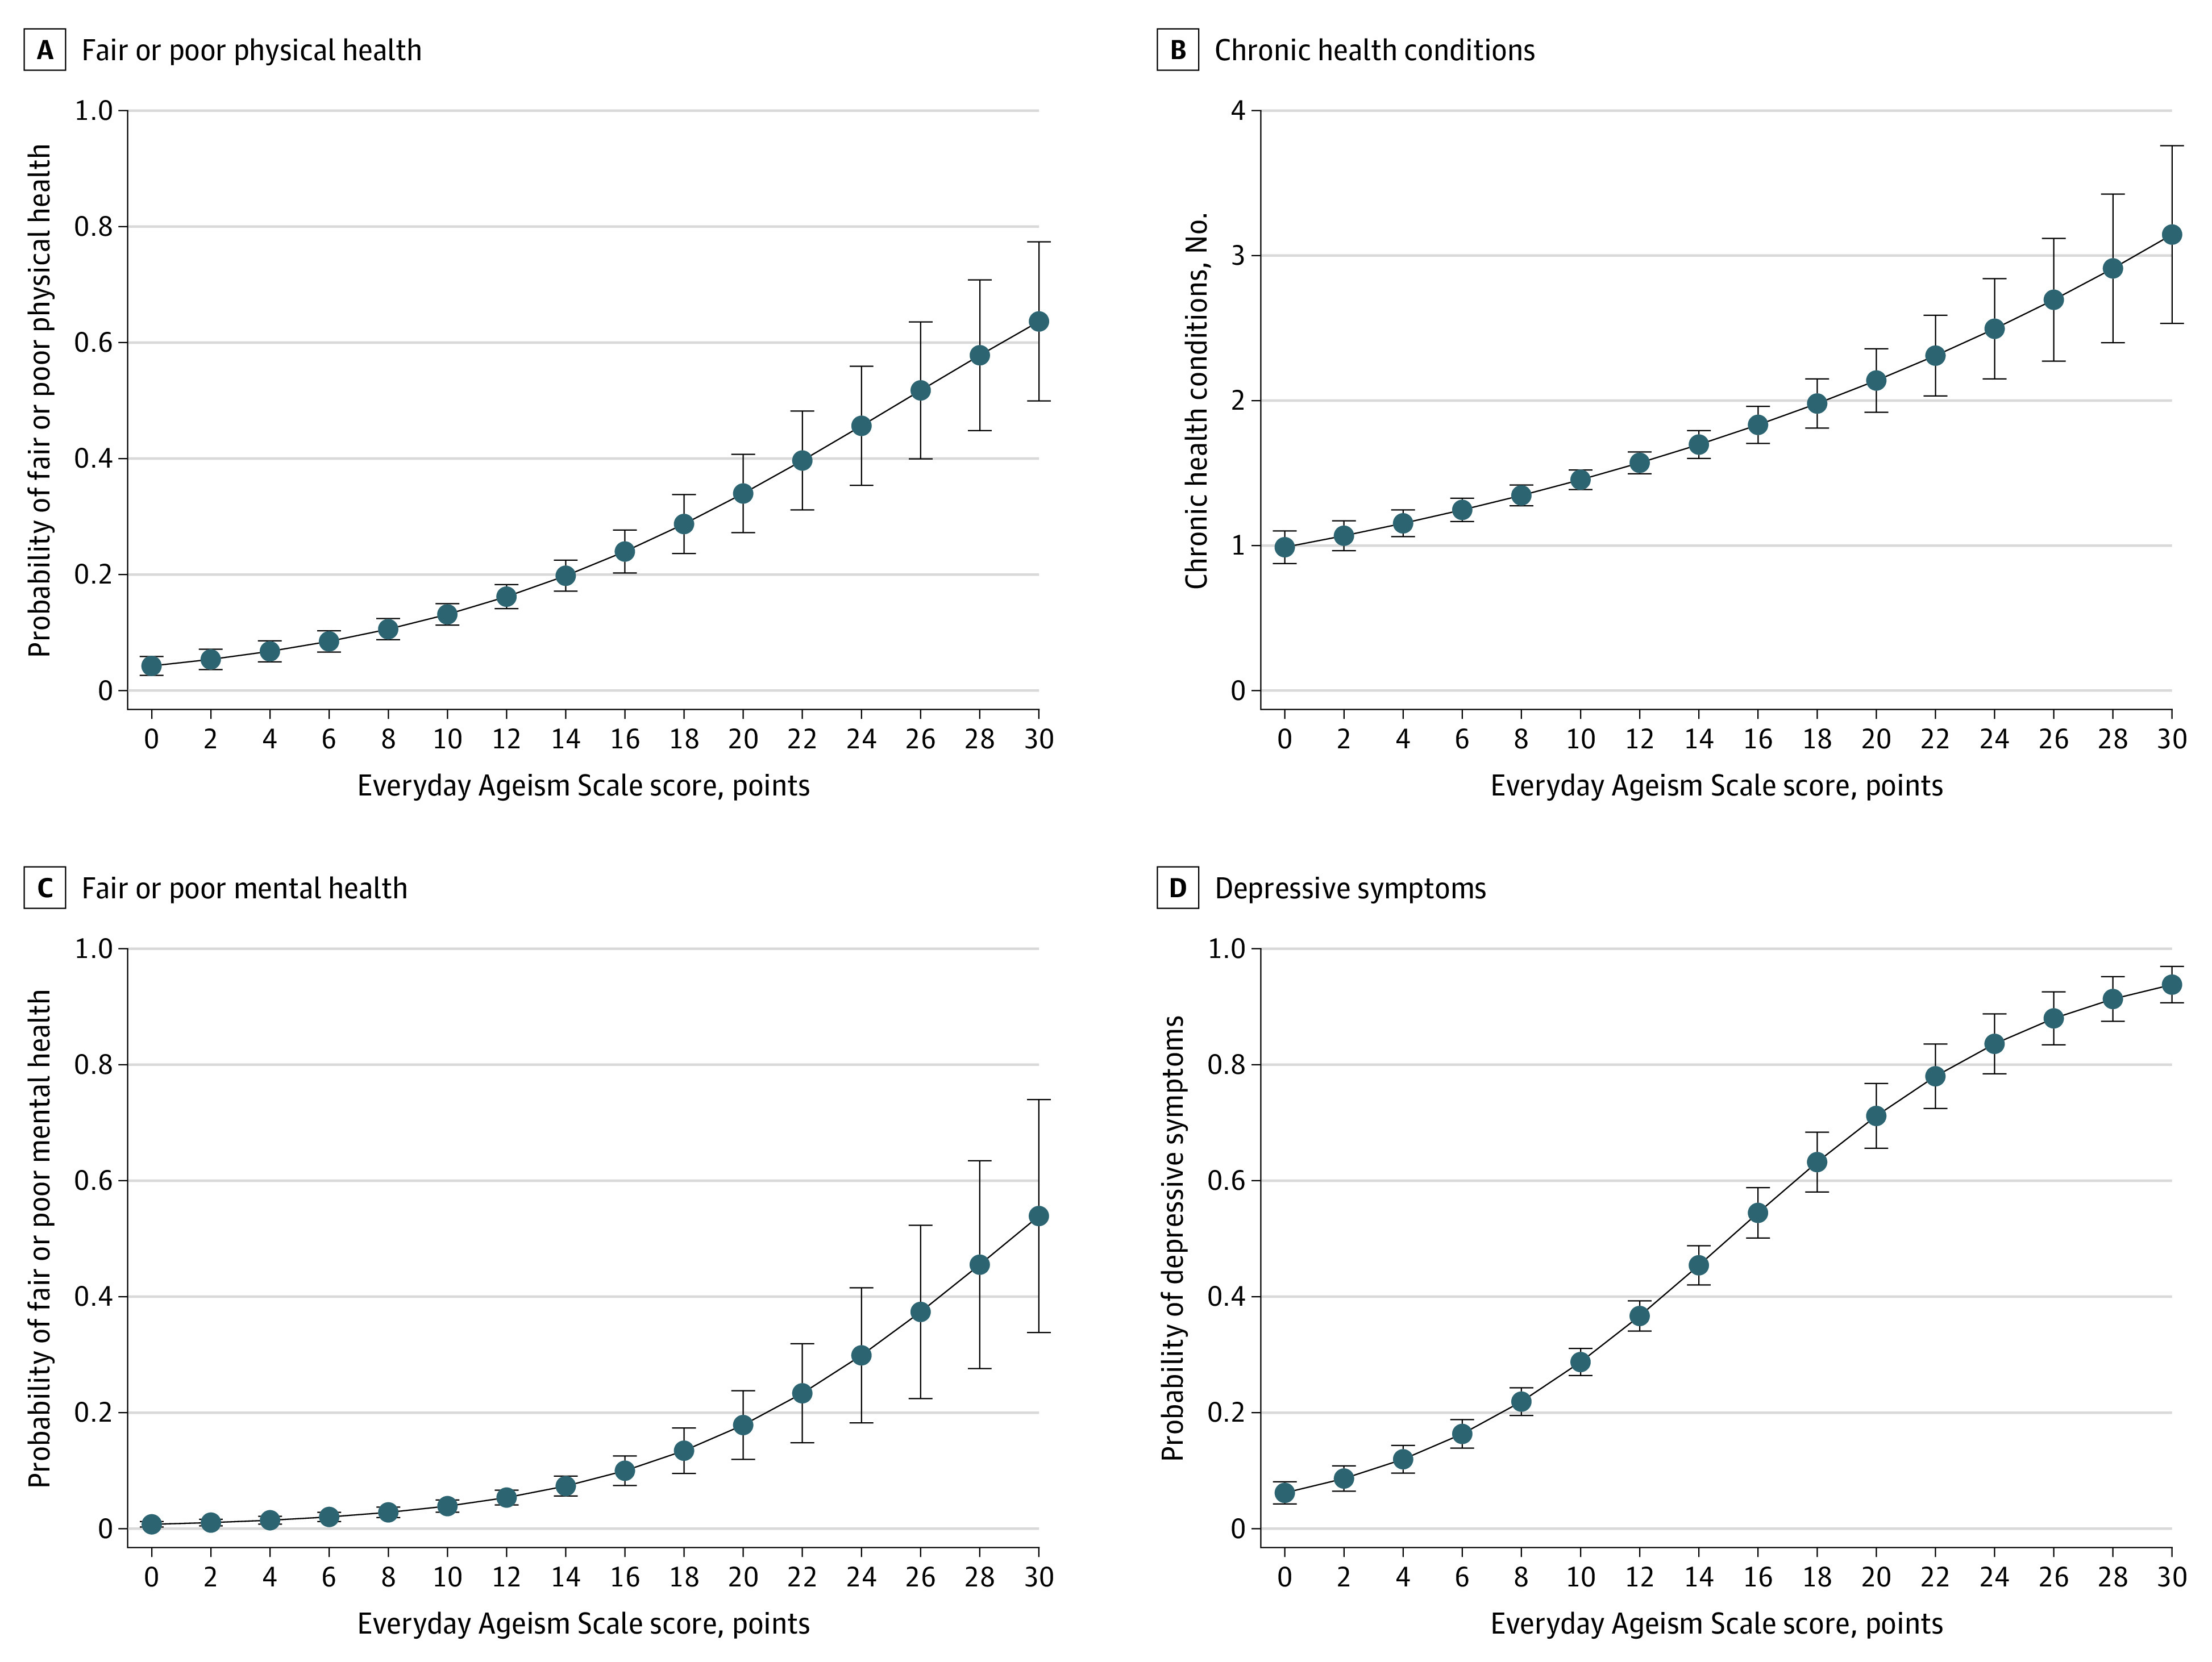
Main outcomes and measures: Fair or poor physical health, number of chronic health conditions, fair or poor mental health, and depressive symptoms.
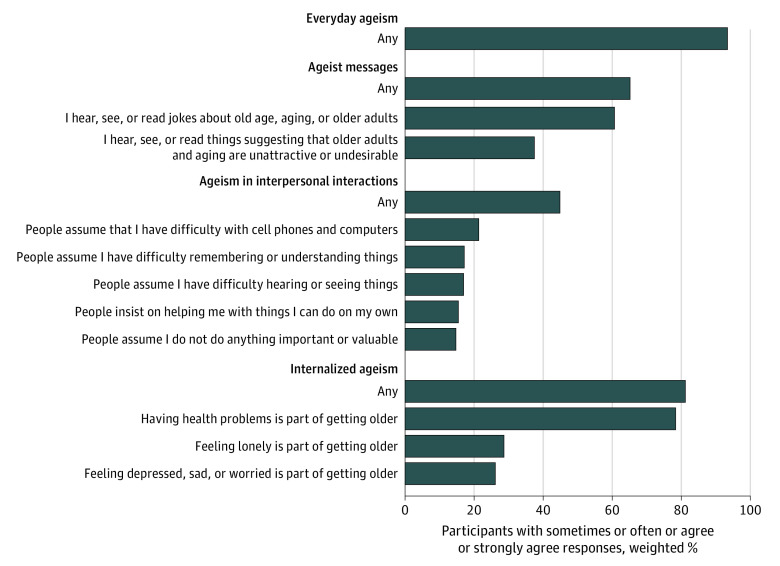
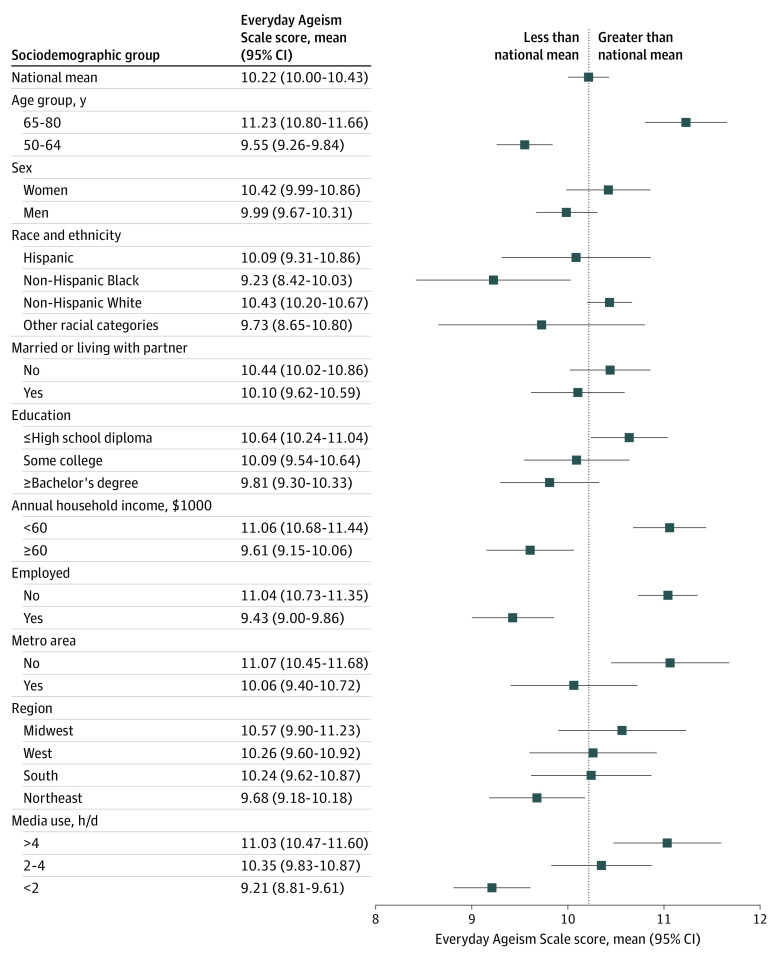
Results: Among 2035 adults ages 50 to 80 years (1047 [54.2%] women; 192 Black [10.9%], 178 Hispanic [11.4%], and 1546 White [71.1%]; mean [SD] age, 62.6 [8.0] years [weighted statistics]), most participants (1915 adults [93.4%]) reported regularly experiencing 1 or more forms of everyday ageism. Internalized ageism was reported by 1664 adults (81.2%), ageist messages by 1394 adults (65.2%), and interpersonal ageism by 941 adults (44.9%). Mean Everyday Ageism Scale scores were higher for several sociodemographic groups, including adults ages 65 to 80 years vs those ages 50 to 64 years (11.23 [95% CI, 10.80-11.66] vs 9.55 [95% CI, 9.26-9.84]) and White (10.43 [95% CI, 10.20-10.67]; P < .001) and Hispanic (10.09 [95% CI, 9.31-10.86]; P = .04) adults vs Black adults (9.23 [95% CI, 8.42-10.03]). Higher levels of everyday ageism were associated with increased risk of all 4 negative physical and mental health outcomes examined in regression analyses (with odds ratios [ORs] per additional scale point as high as 1.20 [95% CI, 1.17-1.23] for depressive symptoms and b = 0.039 [95% CI, 0.029-0.048] for chronic health conditions; P values < .001). Internalized ageism was the category associated with the greatest increase in risk of poor outcomes for all health measures (with ORs per additional scale point as high as 1.62 [95% CI, 1.49-1.76] for depressive symptoms and b = 0.063 [95% CI, 0.034-0.092] for chronic health conditions; P values < .001).
Conclusions and relevance: This study found everyday ageism to be prevalent among US adults ages 50 to 80 years. These findings suggest that commonplace ageist messages, interactions, and beliefs may be harmful to health and that multilevel and multisector efforts may be required to reduce everyday ageism and promote positive beliefs, practices, and policies related to aging and older adults.
Conflict of interest statement
Figures
References
-
- Angus J, Reeve P. Ageism: a threat to “aging well” in the 21st century. J Appl Gerontol. 2006;25(2):137-152. doi:10.1177/0733464805285745 - DOI
-
- Hagestad GO, Uhlenberg P. The social separation of old and young: a root of ageism. J Soc Issues. 2005;61(2):343-360. doi:10.1111/j.1540-4560.2005.00409.x - DOI
-
- Bender KA. An analysis of well-being in retirement: the role of pensions, health, and ‘voluntariness’ of retirement. J Socio-Econ. 2012;41(4):424-433. doi:10.1016/j.socec.2011.05.010 - DOI
Publication types
MeSH terms
Grants and funding
LinkOut - more resources
Full Text Sources
Miscellaneous
