

Correlation Between Laser Speckle Flowgraphy and OCT-Derived Retinal and Choroidal Metrics in Healthy Human Eye
- PMID: 35704328
- PMCID: PMC9206497
- DOI: 10.1167/tvst.11.6.15
Correlation Between Laser Speckle Flowgraphy and OCT-Derived Retinal and Choroidal Metrics in Healthy Human Eye
Abstract
Purpose: To investigate the correlation between laser speckle flowgraphy (LSFG) signals and the quantitative metrics derived from optical coherence tomography (OCT) in normal eyes.
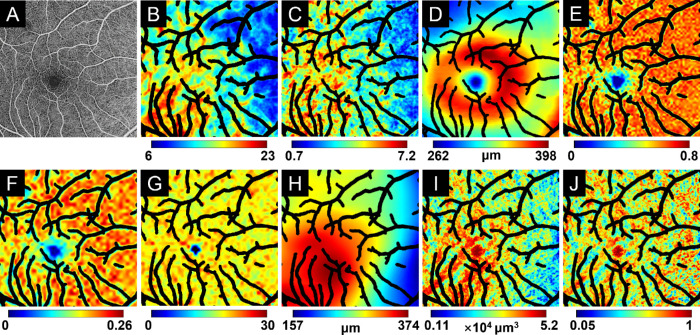
Methods: LSFG, OCT, and OCT angiography (OCTA) imaging were performed on normal participants using a custom-designed LSFG system and a commercial swept-source OCT system. Mean (PWM) and amplitude (PWA) of the LSFG pulse waveform were selected to quantify the LSFG signals. Retinal and choroidal maps were obtained using the standard 6 × 6 mm OCT and OCTA scans. Structural and vascular metrics maps, including thickness, vessel area density, vessel skeleton density, and vessel diameter index of the retina, and choroidal thickness (CT), choroidal vessel volume (CVV) and choroidal vessel index (CVI), were employed to quantify the retinal and choroidal properties. Correlation analysis was then performed between the LSFG, retinal, and choroidal metrics maps.
Results: Twelve healthy participants aged 23 to 36 years were enrolled in this study. The spatial distribution of the PWM and PWA values was highly correlated with that of the CT and CVV metrics. On average, Spearman correlation coefficients (ρ) were 0.80 and 0.78 (all P < 0.001) for the correlations between PWM and CT and CVV, respectively, and were 0.61 and 0.63 (all P < 0.05) for the correlations between PWA and CT and CVV, respectively. In comparison, both PWM and PWA were generally weak or not correlated with all the retinal metrics and CVI.
Conclusions: LSFG signals were positively correlated with the choroidal thickness and vessel volume, suggesting choroidal blood flows dominate the LSFG signals at the area absent of large retinal vessels.
Translational relevance: This study illustrates the dominant source of the LSFG signals in the eye.
Conflict of interest statement
Disclosure:
Figures


Similar articles
-
Age-Related Changes in Choroidal Thickness and the Volume of Vessels and Stroma Using Swept-Source OCT and Fully Automated Algorithms.Ophthalmol Retina. 2020 Feb;4(2):204-215. doi: 10.1016/j.oret.2019.09.012. Epub 2019 Oct 1. Ophthalmol Retina. 2020. PMID: 32033714 Free PMC article.
-
Association of outer retinal and choroidal alterations with neuroimaging and clinical features in posterior cortical atrophy.Alzheimers Res Ther. 2024 Aug 19;16(1):187. doi: 10.1186/s13195-024-01551-3. Alzheimers Res Ther. 2024. PMID: 39160571 Free PMC article.
-
Characterization of macular choroid in normal-tension glaucoma: a swept-source optical coherence tomography study.Acta Ophthalmol. 2021 Dec;99(8):e1421-e1429. doi: 10.1111/aos.14829. Epub 2021 Mar 6. Acta Ophthalmol. 2021. PMID: 33675169
-
[A new approach for studying the retinal and choroidal circulation].Nippon Ganka Gakkai Zasshi. 2004 Dec;108(12):836-61; discussion 862. Nippon Ganka Gakkai Zasshi. 2004. PMID: 15656089 Review. Japanese.
-
Retinal applications of swept source optical coherence tomography (OCT) and optical coherence tomography angiography (OCTA).Prog Retin Eye Res. 2021 Sep;84:100951. doi: 10.1016/j.preteyeres.2021.100951. Epub 2021 Jan 28. Prog Retin Eye Res. 2021. PMID: 33516833 Review.
Cited by
-
Regional and Layer Specific Retinal Capillary Red Blood Cell Velocimetry in Healthy Human Subjects.Transl Vis Sci Technol. 2025 Jul 1;14(7):21. doi: 10.1167/tvst.14.7.21. Transl Vis Sci Technol. 2025. PMID: 40719546 Free PMC article.
-
Posterior Polar Annular Choroidal Dystrophy: Genetic Insights and Differential Diagnosis in Inherited Retinal Diseases.Curr Issues Mol Biol. 2024 Feb 5;46(2):1383-1397. doi: 10.3390/cimb46020089. Curr Issues Mol Biol. 2024. PMID: 38392207 Free PMC article. Review.
-
Laser Speckle Flowgraphy Reveals Widespread Reductions in Ocular Blood Flow in nonexudative Age-Related Macular Degeneration.Am J Ophthalmol. 2025 May;273:92-106. doi: 10.1016/j.ajo.2025.01.012. Epub 2025 Jan 30. Am J Ophthalmol. 2025. PMID: 39892803
-
Factors Associated With Ocular Perfusion Measurements as Obtained With Laser Speckle Contrast Imaging.Transl Vis Sci Technol. 2024 Nov 4;13(11):8. doi: 10.1167/tvst.13.11.8. Transl Vis Sci Technol. 2024. PMID: 39514217 Free PMC article.
References
-
- Linsenmeier RA, Padnick-Silver L. Metabolic dependence of photoreceptors on the choroid in the normal and detached retina. Invest Ophthalmol Vis Sci. 2000; 41: 3117–3123. - PubMed
-
- Langham ME, Grebe R, Hopkins S, Marcus S, Sebag M. Choroidal blood-flow in diabetic-retinopathy. Exp Eye Res. 1991; 52: 167–173. - PubMed
Publication types
MeSH terms
Grants and funding
LinkOut - more resources
Full Text Sources
