. 2022 Jun 17;8(24):eabl8070.
doi: 10.1126/sciadv.abl8070. Epub 2022 Jun 15.

Depletion of oocyte dynamin-related protein 1 shows maternal-effect abnormalities in embryonic development

Affiliations

Depletion of oocyte dynamin-related protein 1 shows maternal-effect abnormalities in embryonic development

Deepak Adhikari et al. Sci Adv. .

Abstract

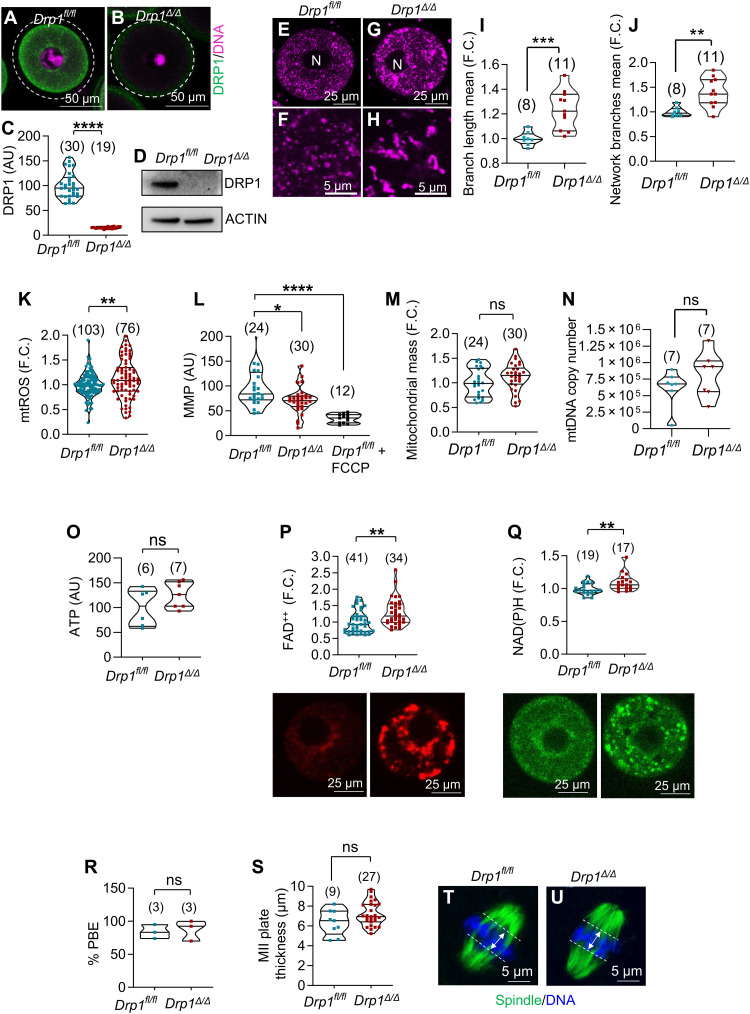
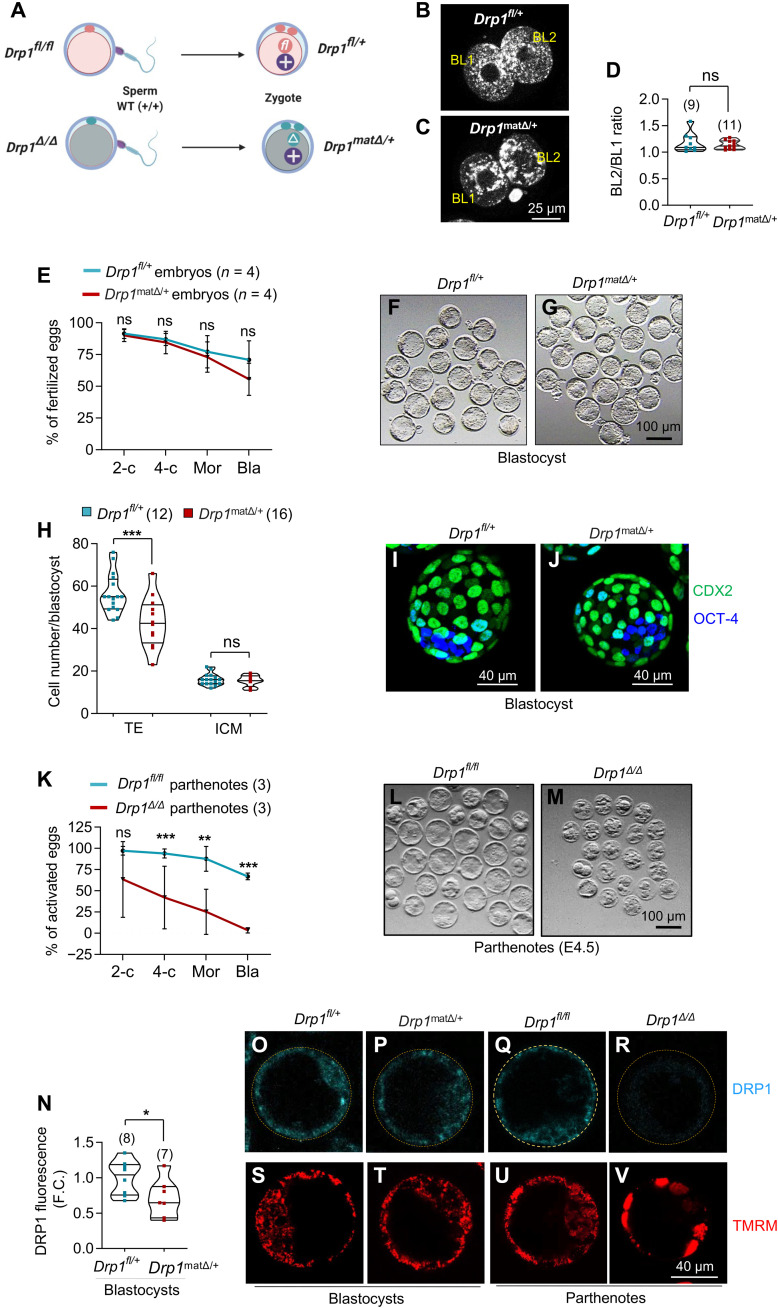
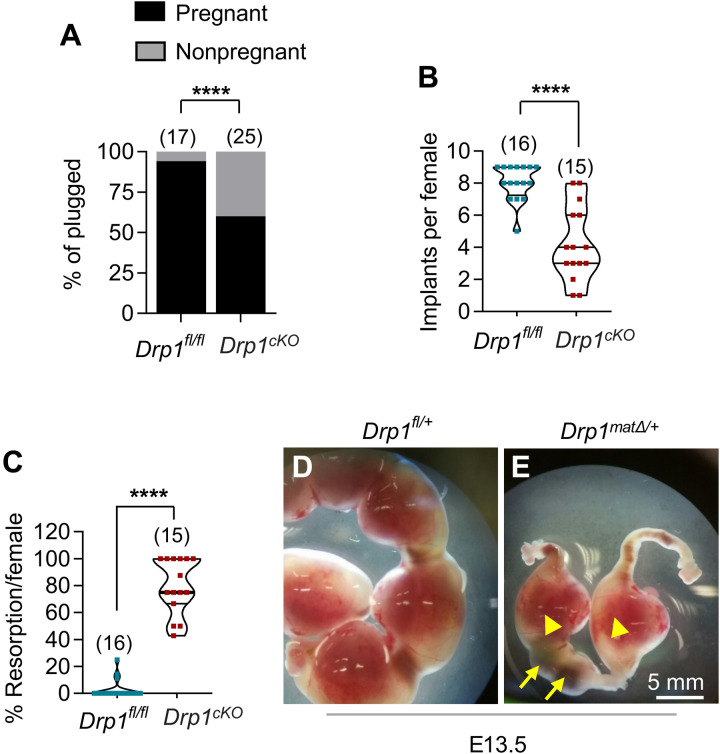
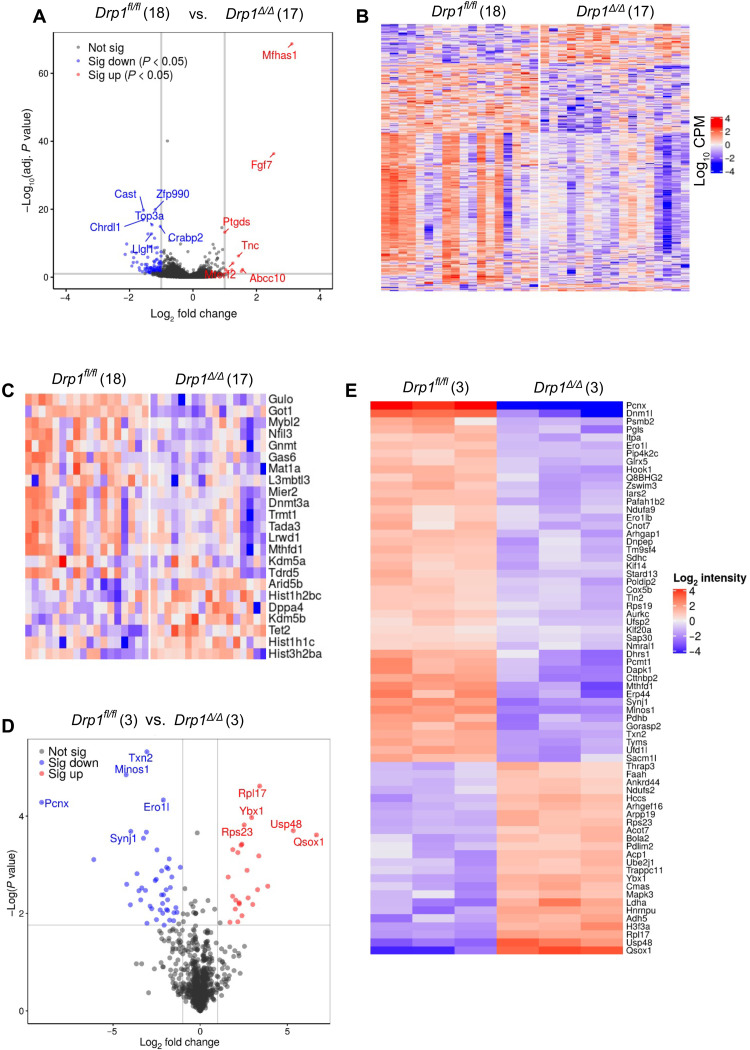
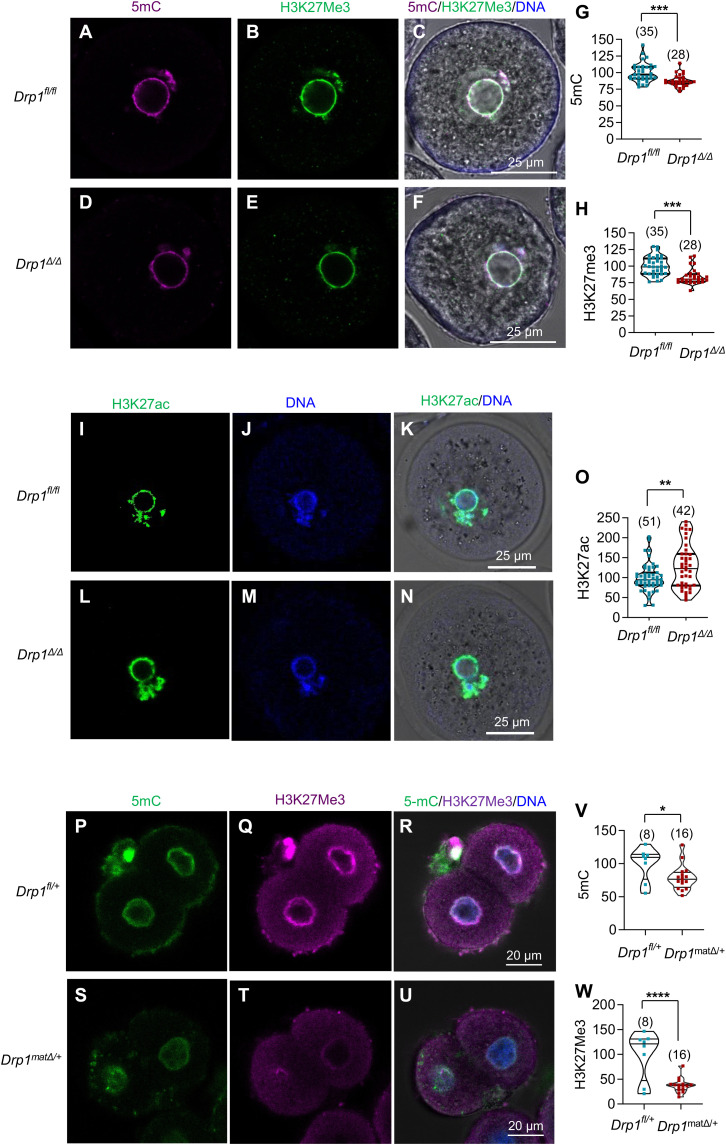
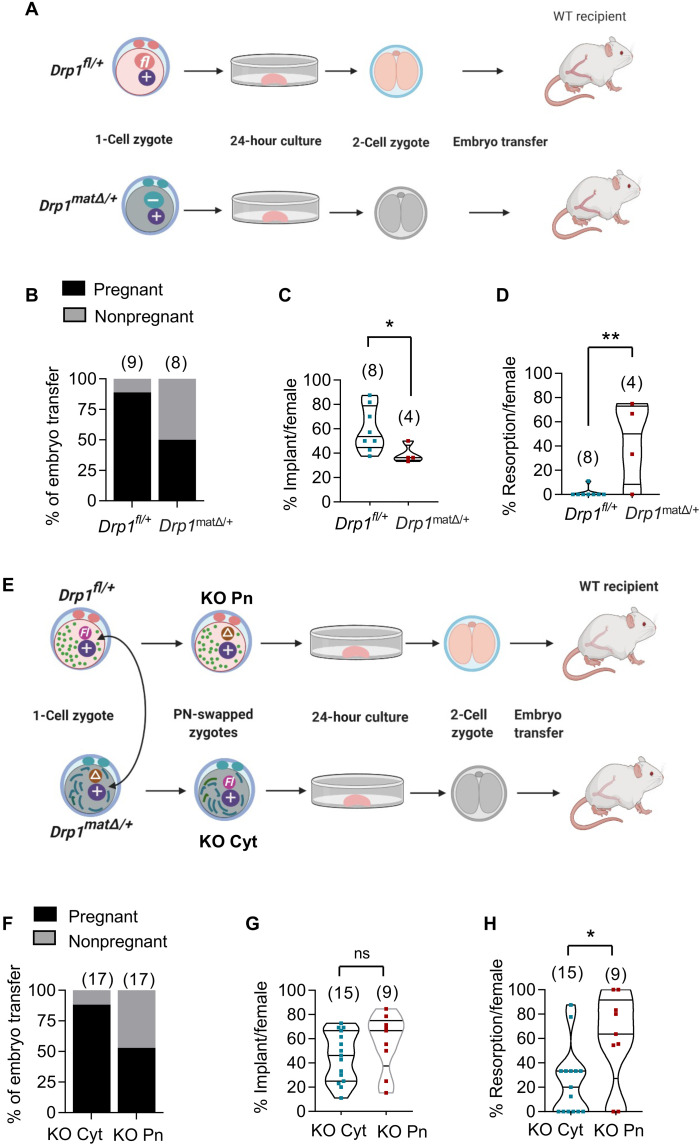
Eggs contain about 200,000 mitochondria that generate adenosine triphosphate and metabolites essential for oocyte development. Mitochondria also integrate metabolism and transcription via metabolites that regulate epigenetic modifiers, but there is no direct evidence linking oocyte mitochondrial function to the maternal epigenome and subsequent embryo development. Here, we have disrupted oocyte mitochondrial function via deletion of the mitochondrial fission factor Drp1. Fission-deficient oocytes exhibit a high frequency of failure in peri- and postimplantation development. This is associated with altered mitochondrial function, changes in the oocyte transcriptome and proteome, altered subcortical maternal complex, and a decrease in oocyte DNA methylation and H3K27me3. Transplanting pronuclei of fertilized Drp1 knockout oocytes to normal ooplasm fails to rescue embryonic lethality. We conclude that mitochondrial function plays a role in establishing the maternal epigenome, with serious consequences for embryo development.


Figures

Fig. 1.
Fig. 1.. Oocyte-specific deletion of Drp1 and analysis of oocyte mitochondria.
(A to D) Oocyte-specific deletion of Drp1. DRP1 (green) and DNA (pink) in Drp1fl/fl oocytes (A) but Drp1Δ oocytes lacked DRP1 (B). Dashed circles represent oocyte margins. (C) DRP1 fluorescence quantification. AU, arbitrary unit. (D) Western blots of DRP1. Each lane contains 50 GV-stage oocytes from 4- to 5-week-old mice. β-Actin was used as a loading control. The experiments were repeated three times, and a representative image is shown. Mitochondrial morphology in GV-stage Drp1fl/fl (E and F) and Drp1Δ (G and H) oocytes. Branch length mean (I) and network branches mean (J) between Drp1fl/fl and Drp1Δ oocytes. Oocytes were labeled with mitotracker orange. Number of oocytes analyzed are shown (C, I, and J). (K) Increased mitochondrial ROS (mtROS) levels in Drp1Δ oocytes. Numbers represent total number of oocytes. (L) Reduced MMP in Drp1Δ oocytes compared to Drp1fl/fl oocytes. Carbonyl cyanide-4-phenylhydrazone (FCCP) was used to demonstrate assay specificity. Numbers represent total number of oocytes. (M) Similar mitochondrial mass between Drp1fl/fl and Drp1Δ oocytes. MitoTracker Green signals in (L) were analyzed to calculate mitochondrial mass. ns, not significant. (N) Comparable mtDNA copy number between Drp1fl/fl and Drp1Δ oocytes. Numbers represent total number of oocytes. (O) Similar ATP levels between Drp1Δ and Drp1fl/fl oocytes. Numbers represent experimental replicates. Drp1Δ oocytes have increased levels of FAD++ (P) and NAD(P)H (Q) compared to Drp1fl/fl controls. Total oocyte numbers shown. Representative autofluorescent images are also shown. (R) Comparable PBE rates in vitro. Numbers represent experimental replicates. (S to U) MII oocytes showing spindle (green) and DNA (blue). Chromosome spreads were measured as exemplified in (T) and (U). Total oocyte numbers shown in (S). Results show means ± SD and P values determined by two-tailed Student’s t test (C and I to S). F.C., fold change.
Fig. 2.
Fig. 2.. Preimplantation development of Drp1matΔ/+ embryos.
(A) Schematic representation of mating schemes and the genotype of resultant embryos. (B to D) Comparison of mitochondrial mass between blastomeres of 2-cell embryos. One-cell zygotes harvested from gonadotropin-stimulated females and mated with WT males were cultured for 24 hours and labelled with MitoTracker Orange. Numbers represent total number of zygotes. (E to G) After gonadotropin stimulations, 4- to 5-week-old Drp1fl/fl and Drp1cKO mice were mated with WT males to harvest Drp1fl/+ and Drp1matΔ/+ one-cell zygotes. One-cell zygotes were cultured in vitro for 96 hours. Number of replicates are shown. Bla, blastocyst. (H to J) Blastocysts were labelled with CDX2 and OCT-4 to count the trophectoderm (TE) and inner cell mass (ICM), respectively. Representative maximum projection images of Drp1fl/+ (I) and Drp1matΔ/+ (J) blastocysts are shown. Number of blastocysts analyzed in (H) are shown. (K to M) Absolute requirement of DRP1 for preimplantation embryo development. The rate of parthenogenetic activation of Drp1Δ oocytes was significantly reduced compared to Drp1fl/fl controls (K). Numbers of experimental repeats are shown. Bla, blastocyst. Representative images of Drp1fl/fl control (L) and Drp1Δ (M) parthenotes at the end of culture. (N to V) Recovery of DRP1 and mitochondrial morphology in fertilized Drp1matΔ/+ embryos. DRP1 expression was largely recovered in fertilized Drp1matΔ/+ embryos (N). Number of blastocysts analyzed are shown. Immunofluorescence of DRP1 (cyan) was evident in Drp1fl/+ (O) and Drp1matΔ/+ (P) blastocysts. Unfertilized Drp1fl/fl control parthenote expressed DRP1 (Q) but Drp1Δ parthenote blastocysts completely lacked DRP1 immunofluorescence (R). Reflecting the DRP1 expression profiles, TMRM labelling revealed normal singular mitochondria in control fertilized Drp1fl/+ (S) and Drp1matΔ/+ (T) blastocysts. Unfertilized Drp1fl/fl control parthenote also contained dispersed mitochondria (U) but Drp1Δ parthenogenetic blastocysts had mitochondria aggregated into large clumps (V). Results show mean ± SD and P values determined by two-tailed Student’s t test (E, H, K, N).
Fig. 3.
Fig. 3.. Postimplantation death of Drp1matΔ/+ embryos derived from Drp1Δ oocytes.
Five-week-old Drp1cKO and control Drp1fl/fl females were mated with WT (+/+) males and assessed fetal development between E10.5 to E18.5 of pregnancy. (A) Uteri of 94% of plugged control Drp1fl/fl females showed embryos as compared to only 60% of plugged Drp1cKO females contained any embryo. Number of mice analyzed are shown. (B) Control females had an average of eight implants per pregnancy, whereas Drp1cKO females had only four implants per pregnancy. Number of mice analyzed are shown. (C) Within confirmed pregnancies, there was a higher percentage of embryo resorption in Drp1cKO females (76%) compared to only 3% in Drp1fl/fl females. Number of mice analyzed are shown. While the uteri of E13.5 Drp1fl/fl females showed normal developing embryos (D), the embryos in uteri of Drp1cKO females were either dead (E, arrows) or severely growth retarded (E, arrowheads). Results show means ± SD (B and C). P value determined by chi-square test (A), two-tailed Student’s t test (B and C).
Fig. 4.
Fig. 4.. Altered gene expression profile of Drp1Δ/Δ oocytes.
(A) Volcano plot showing DEGs (down-regulated, blue; up-regulated, red; and not different, black) between Drp1fl/fl and Drp1Δ/Δ oocytes. Highly dysregulated genes are labeled. (B) Heatmap of differential gene expression in Drp1fl/fl and Drp1Δ/Δ oocytes. CPM, counts per million. (C) Heatmap showing differential expression of epigenetic regulators in Drp1fl/fl and Drp1Δ/Δ oocytes. Number of single GV-stage oocytes per genotype used for RNA-seq analysis are shown (A to C). (D) Volcano plot showing differentially abundant proteins (down-regulated, blue; up-regulated, red; and not different, black) between MII-stage Drp1fl/fl and Drp1Δ/Δ oocytes. Highly dysregulated proteins are labeled. (E) Hierarchically clustered heatmap of relative abundancies of proteins in Drp1fl/fl and Drp1Δ/Δ oocytes. Number of replicates per genotype used for proteomic analysis are shown (D and E).
Fig. 5.
Fig. 5.. Altered epigenetic marks in the nuclei of Drp1Δ oocytes and Drp1matΔ/+ 2-cell zygotes.
Immunofluorescence (IF) showing 5mC (A, magenta), H3K27me3 (B, green), and merged (C) in Drp1fl/fl oocytes. IF showing 5mC (D), H3K27me3 (E), and merged (F) in Drp1Δ oocytes. (G) Quantification of 5mC fluorescence. (H) Quantification of H3K27me3 fluorescence. IF showing H3K27ac (I, green), DNA (J, blue), and merged (K) in Drp1fl/fl oocytes. IF showing H3K27ac (L, green), DNA (M, blue), and merged (N) in Drp1Δ oocytes. (O) Quantification of H3K27ac fluorescence. IF showing 5mC (P, green), H3K27me3 (Q, magenta) and merged (R) in Drp1fl/+ 2-cell zygotes. IF showing 5mC (S), H3K27me3 (T) and merged (U) in Drp1matΔ/+ 2-cell zygotes. (V) Quantification of 5mC fluorescence. (W) Quantification of H3K27me3 fluorescence. Results show mean ± SD and P values determined by two-tailed Student’s t test (G, H, O, V and W). Number of oocytes/zygotes analyzed are shown (G, H, O, V, and W).
Fig. 6.
Fig. 6.. Development after embryo transfer.
(A to D) Embryonic lethality is due to defective Drp1Δ oocytes. (A) Schematic representation of embryo transfer experiment. Superovulated 5-week-old Drp1fl/fl and Drp1CKO females were mated with WT (+/+) males to generate WT Drp1fl/+embryos and heterozygous Drp1matΔ/+ zygotes, respectively. One-cell zygotes harvested from the oviducts of plugged donor females were cultured in vitro for 24 hours until they reached the two-cell stage. Two-cell stage embryos were transferred to the oviducts of different WT pseudo-pregnant recipients. (B) Recipients culled between E15.5 and E20.5 of pregnancy revealed that eight of nine recipients receiving Drp1fl/+ embryos became pregnant compared to only four of eight recipients receiving Drp1Drp1matΔ/+ embryos. (C) Per-pregnancy implantation rate of Drp1matΔ/+ embryos was markedly reduced than Drp1fl/+ embryos. (D) Within confirmed pregnancies, there was a higher percentage of embryo resorption in Drp1cKO females compared to Drp1fl/fl females. (E to H) Embryo development after pronuclear swapping and embryo transfer. (E) Schematic representation of reciprocal pronuclear swapping between one-cell zygotes, in vitro culture, and embryo transfer. (F) Comparison of pregnancy rates after implanting KO Cyt and KO Pn zygotes. (G) Implantation rates of KO Pn and KO Cyt embryos. Within positive pregnancies, there was a higher percentage of resorption of KO Pn embryos compared to KO Cyt embryos (H). P values determined by chi-square test (B and F) and two-tailed Student’s t test (C, D, G, and H). Results show means ± SD (C, D, G, and H). Number of mice analyzed are shown (B to D and F to H).

References

    1. Hamanaka R. B., Chandel N. S., Mitochondrial reactive oxygen species regulate cellular signaling and dictate biological outcomes. Trends Biochem. Sci. 35, 505–513 (2010). - PMC - PubMed
    1. Mishra P., Chan D. C., Mitochondrial dynamics and inheritance during cell division, development and disease. Nat. Rev. Mol. Cell Biol. 15, 634–646 (2014). - PMC - PubMed
    1. Wakabayashi J., Zhang Z., Wakabayashi N., Tamura Y., Fukaya M., Kensler T. W., Iijima M., Sesaki H., The dynamin-related GTPase Drp1 is required for embryonic and brain development in mice. J. Cell Biol. 186, 805–816 (2009). - PMC - PubMed
    1. Kraus F., Ryan M. T., The constriction and scission machineries involved in mitochondrial fission. J. Cell Sci. 130, 2953–2960 (2017). - PubMed
    1. Ishihara N., Nomura M., Jofuku A., Kato H., Suzuki S. O., Masuda K., Otera H., Nakanishi Y., Nonaka I., Goto Y. I., Taguchi N., Morinaga H., Maeda M., Takayanagi R., Yokota S., Mihara K., Mitochondrial fission factor Drp1 is essential for embryonic development and synapse formation in mice. Nat. Cell Biol. 11, 958–966 (2009). - PubMed