. 2022 Jun 17;8(24):eabo4271.
doi: 10.1126/sciadv.abo4271. Epub 2022 Jun 15.

CD38 reduces mitochondrial fitness and cytotoxic T cell response against viral infection in lupus patients by suppressing mitophagy

Affiliations

CD38 reduces mitochondrial fitness and cytotoxic T cell response against viral infection in lupus patients by suppressing mitophagy

Ping-Min Chen et al. Sci Adv. .

Abstract

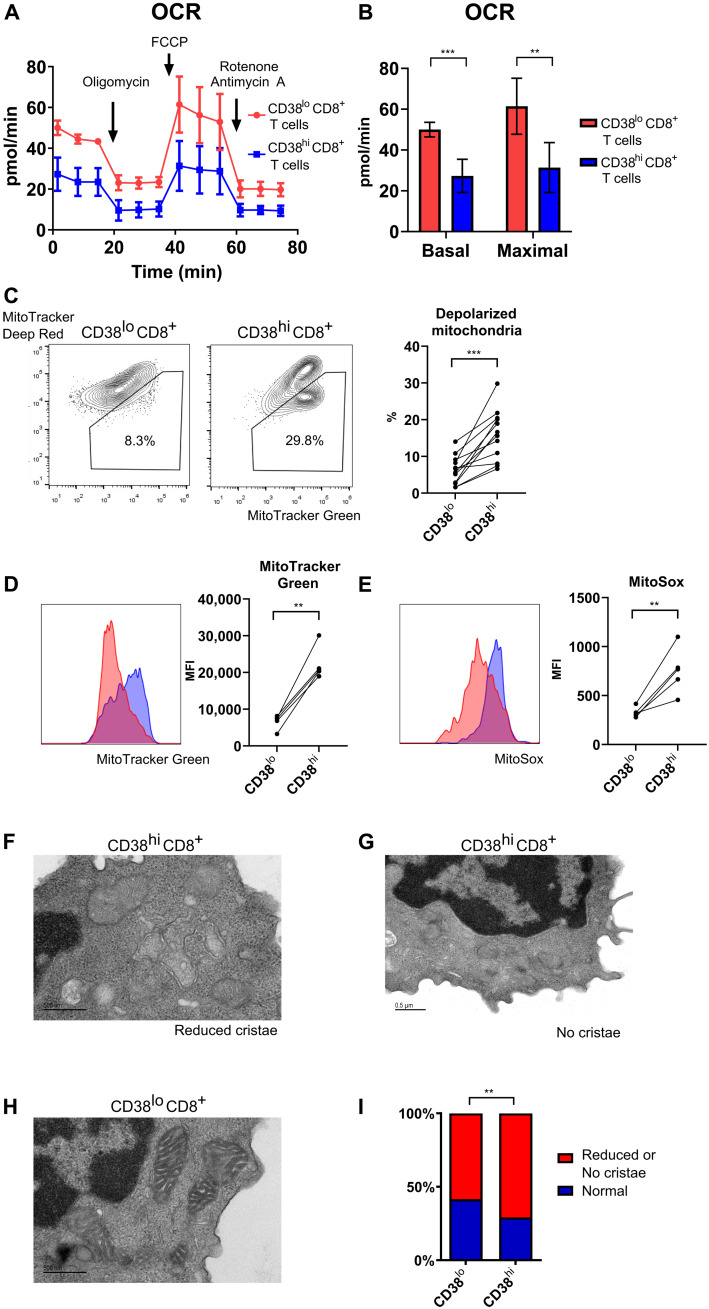
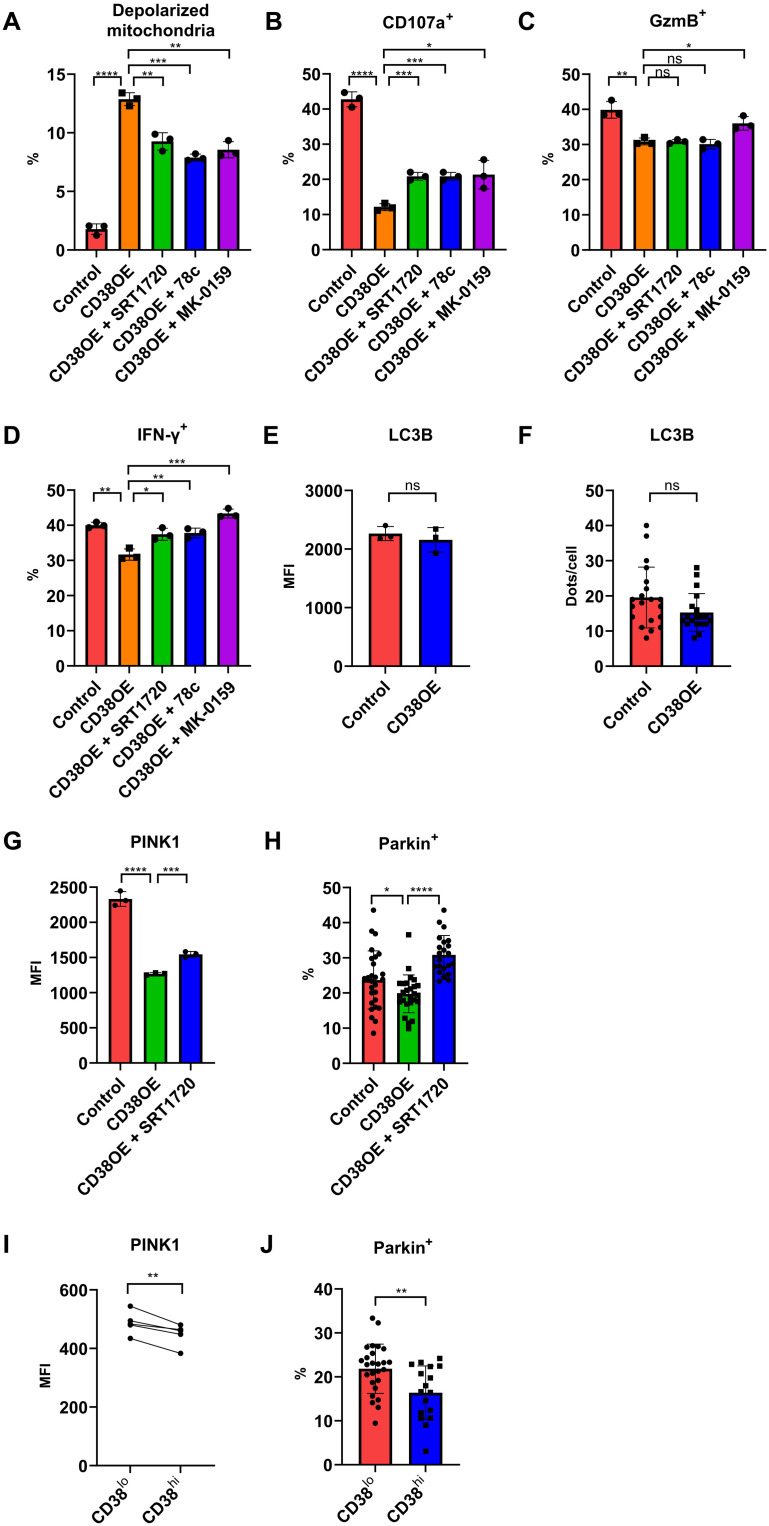
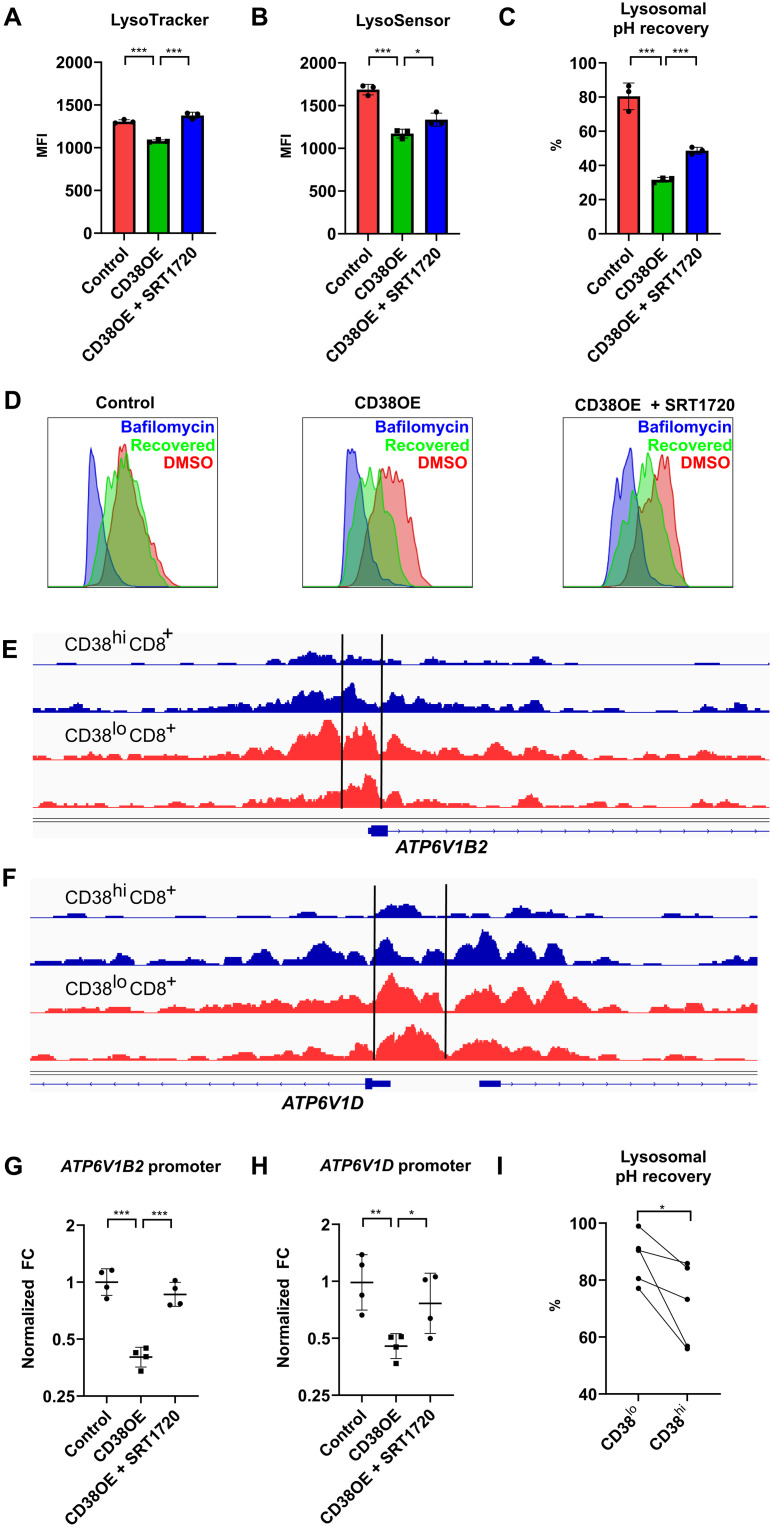
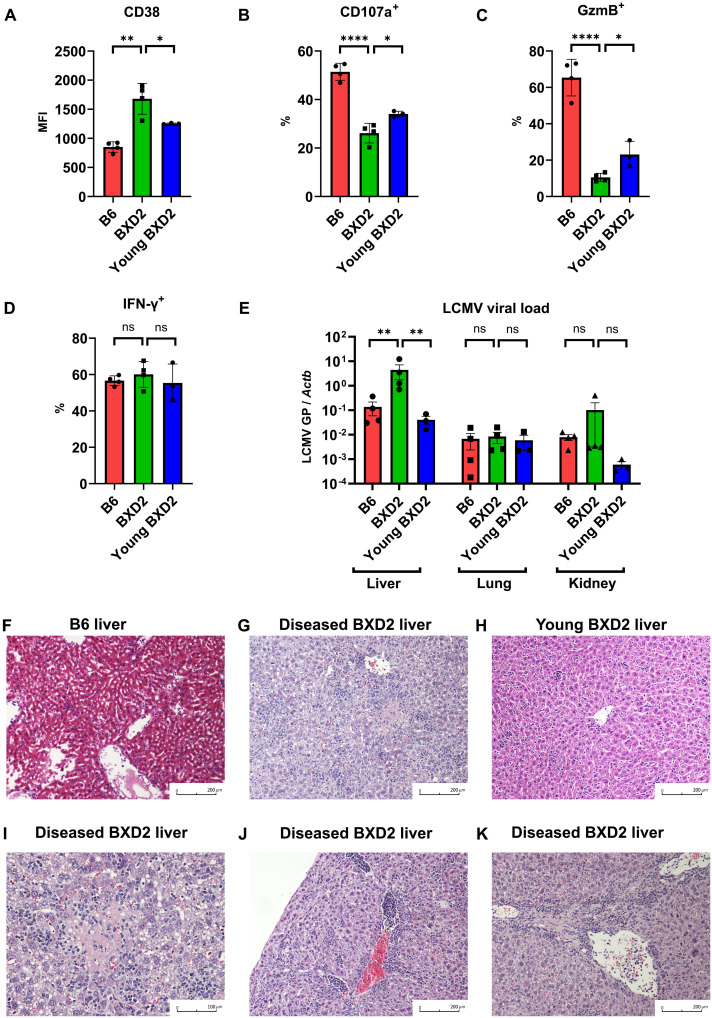
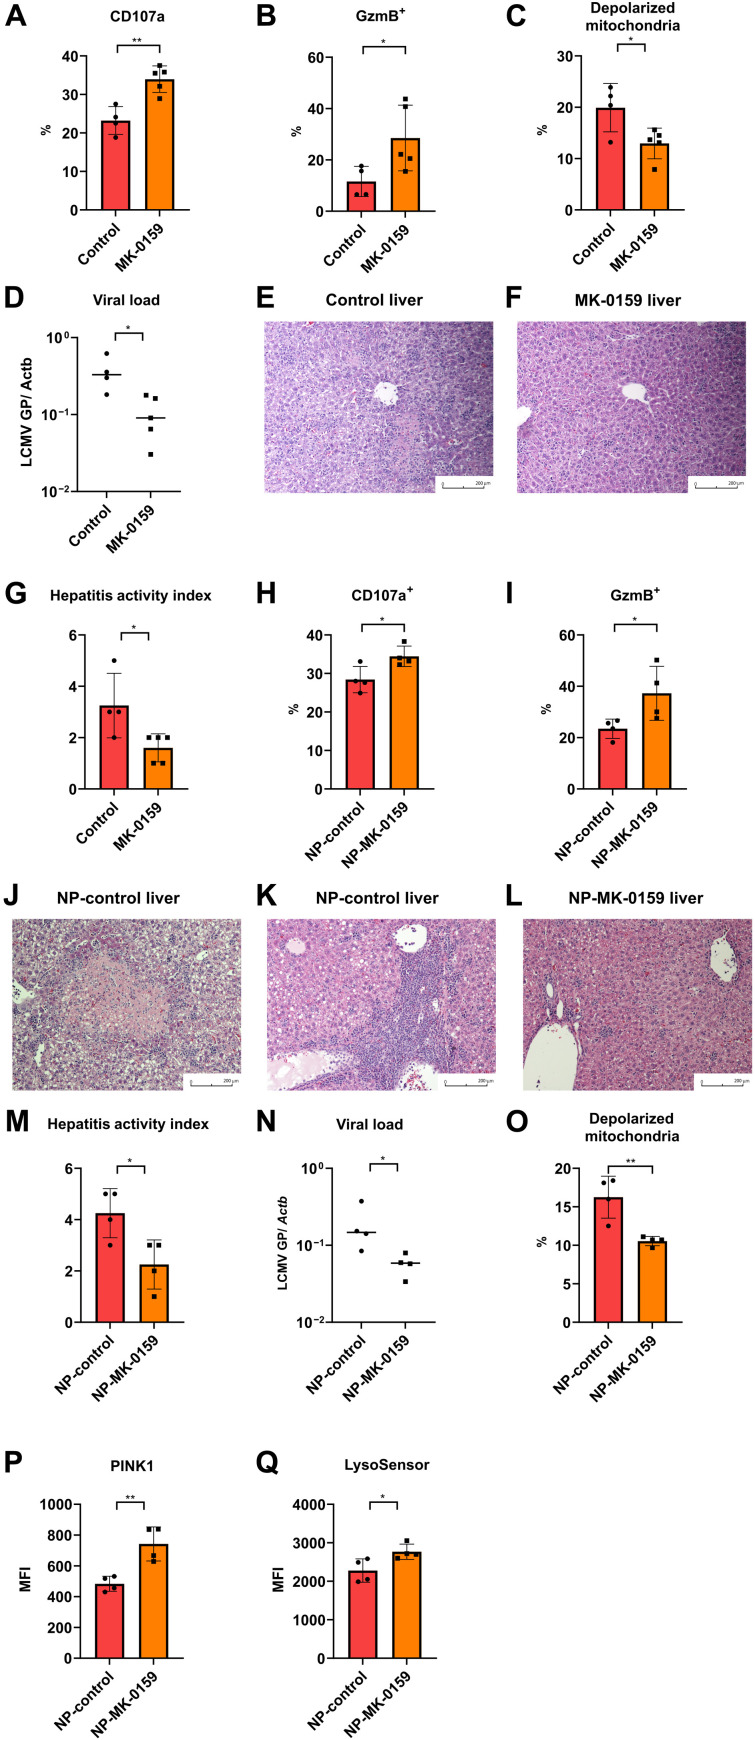
Infection is one of the major causes of mortality in patients with systemic lupus erythematosus (SLE). We previously found that CD38, an ectoenzyme that regulates the production of NAD+, is up-regulated in CD8+ T cells of SLE patients and correlates with the risk of infection. Here, we report that CD38 reduces CD8+ T cell function by negatively affecting mitochondrial fitness through the inhibition of multiple steps of mitophagy, a process that is critical for mitochondria quality control. Using a murine lupus model, we found that administration of a CD38 inhibitor in a CD8+ T cell-targeted manner reinvigorated their effector function, reversed the defects in autophagy and mitochondria, and improved viral clearance. We conclude that CD38 represents a target to mitigate infection rates in people with SLE.


Figures

Fig. 1.
Fig. 1.. CD38hiCD8+ T cells present with numerous mitochondrial defects.
(A) Oxygen consumption rate (OCR) of CD38hiCD8+ and CD38loCD8+ T cells sorted from healthy donor at baseline and after addition of oligomycin, carbonyl cyanide p-trifluoromethoxyphenylhydrazone, and rotenone/antimycin A. (B) Basal and maximal OCR of CD38hiCD8+ and CD38loCD8+ T cells sorted from healthy donor in (A). (C) Representative flow cytometry plot of MitoTracker Green and MitoTracker Deep Red staining in CD38hiCD8+ and CD38loCD8+ T cells from the peripheral blood of SLE patients. Percentage of depolarized mitochondria in CD38hiCD8+ and CD38loCD8+ T cells. (D and E) Representative flow cytometry plot of MitoTracker Green (D) and MitoSOX (E) staining and the mean fluorescence intensity (MFI) in CD38hiCD8+ and CD38loCD8+ T cells from lupus patient peripheral blood. (F to I) Representative electron microscopy of CD38hi with reduced number of cristae (F), no cristae (G), and CD38loCD8+ T cells (H) sorted from lupus patient peripheral blood. Percentage of mitochondria observed with partial or complete loss of cristae in CD38hiCD8+ and CD38loCD8+ T cells (I). Data are means ± SD; statistical analysis by two-tailed t test (B and F), paired t test (C to E), and chi-square test (I). **P < 0.01, ***P < 0.001.
Fig. 2.
Fig. 2.. CD38 perturbs mitochondrial turnover by inhibiting PINK1-Parkin–dependent macroautophagy.
(A) Percentage of depolarized mitochondria in control, CD38-overexpressing CD8+ T cells, or CD38-overexpressing cells treated with SRT1720, or one of the CD38 inhibitors (78c or MK-0159). (B to D) Percentage of positive cells expressing CD107a (B), granzyme B (C), and IFN-γ (D) in control, CD38-overexpressing CD8+ T cells, or CD38-overexpressing cells treated with SRT1720, or one of the CD38 inhibitors (78c or MK-0159). (E) MFI of LC3B staining in control or CD38-overexpressed CD8+ T cells. (F) Counts of LC3B-positive dots per cell of control or CD38-overexpressed CD8+ T cells. (G) MFI of PINK1 in control, CD38-overexpressing CD8+ T cells, or CD38-overexpressing cells treated with SRT1720. (H) Percentage of Parkin positive of the TOMM20-positive area in control, CD38-overexpressing CD8+ T cells, or CD38-overexpressing cells treated with SRT1720. (I) MFI of PINK1 in CD38hiCD8+ and CD38loCD8+ T cells from lupus patient peripheral blood. (J) Percentage of Parkin positive of the TOMM20-positive area in CD38hiCD8+ and CD38loCD8+ T cells from lupus patient peripheral blood. Data are means ± SD; statistical analysis by two-tailed t test (A to H and J), paired t test (I), ns = P > 0.05, *P < 0.05, **P < 0.01, ***P < 0.001, ****P < 0.0001.
Fig. 3.
Fig. 3.. CD38 regulates lysosomal acidification through epigenetic control of V-ATPase expression.
(A and B) MFI of LysoTracker Deep Red (A) and LysoSensor Green (B) staining in control, CD38-overexpressing CD8+ T cells with and without SRT1720. (C) Percentage of lysosomal pH recovery after removing the reversible V-ATPase inhibitor bafilomycin. (D) Representative flow cytometry plot of LysoTracker Deep Red staining in lysosomal pH recovery test of control, CD38-overexpressing CD8+ T cells with and without SRT1720 in DMSO control condition (red), complete V-ATPase inhibition condition with bafilomycin (blue), and removal of bafilomycin for 1 hour to allow recovery of lysosomal pH (green). (E and F) Sequencing tracks of ATAC-seq data over the promoter region of ATP6V1B2 (E) and ATP6V1D (F) of two replicates of CD38hiCD8+ T cells (blue) and CD38loCD8+ T cells (red) from lupus patient peripheral blood. (G and H) Result of ATAC-qPCR showing normalized fold change (FC) of the two peaks located at the promoter region of ATP6V1B2 (G) and ATP6V1D (H) in control, CD38-overexpressing CD8+ T cells with and without SRT1720. (I) Percentage of lysosomal pH recovery after removing the reversible V-ATPase inhibitor bafilomycin in CD38hiCD8+ and CD38loCD8+ T cells from lupus patient peripheral blood. Data are means ± SD; statistical analysis by two-tailed t test (A to C and G and H), paired t test (I), *P < 0.05, **P < 0.01, ***P < 0.001.
Fig. 4.
Fig. 4.. Dysfunctional CD8+ T cells in BXD2 lupus mice cause viral hepatitis in LCMV infection.
(A) MFI of CD38 in gp33+ CD8+ T cells of B6, diseased BXD2, or young nondiseased BXD2 mice 8 days after LCMV Armstrong infection. (B to D) Percentage of positive cells expressing CD107a (B), granzyme B (C), and IFN-γ (D) in gp33+ CD8+ T cells of B6, diseased BXD2, or young nondiseased BXD2 mice 8 days after LCMV Armstrong infection. (E) LCMV viral load 8 days after LCMV Armstrong infection using quantitative PCR of glycoprotein gene normalized by tissue ACTB in liver, kidney, and lung of B6, diseased BXD2, or young nondiseased BXD2 mice. (F to H) Representative liver histology of B6 (F), diseased BXD2 (G), or young nondiseased BXD2 (H) mice 8 days after LCMV Armstrong infection. (I to K) Representative liver histology of diseased BXD2 mice 8 days after LCMV Armstrong infection showing focal lesion of necrosis (I) and portal and periportal inflammation (J and K). Data are means ± SD (A to D), mean ± SE (E); statistical analysis by two-tailed t test. ns = P > 0.05, *P < 0.05, **P < 0.01, ****P < 0.0001.
Fig. 5.
Fig. 5.. CD38 inhibition reverses mitochondrial defect and restores CD8+ T cell function in BXD2 lupus mice against LCMV infection.
(A and B) Percentage of positive cells expressing CD107a (A) and granzyme B (B) in gp33+ CD8+ T cells 8 days after LCMV Armstrong infection from diseased BXD2 treated with control water or MK-0159. (C) Percentage of depolarized mitochondria in gp33+ CD8+ T cells 8 days after LCMV Armstrong infection from diseased BXD2 treated with control water or MK-0159. (D) LCMV viral load 8 days after LCMV Armstrong infection using qPCR of glycoprotein gene normalized by tissue ACTB in diseased BXD2 treated with control water or MK-0159. (E to G) Representative liver histology 8 days after LCMV Armstrong infection from diseased BXD2 treated with control water (E) or MK-0159 (F) and their respective hepatitis activity index (G). (H and I) Percentage of positive cells expressing CD107a (H) and granzyme B (I) in gp33+ CD8+ T cells 8 days after LCMV Armstrong infection from diseased BXD2 treated with control NP or NP-MK-0159. (J to M) Representative liver histology 8 days after LCMV Armstrong infection from diseased BXD2 treated with NP-control with the presentation of necrosis (J) or portal and periportal inflammation (K) or treated with NP-MK-0159 (L) and their respective hepatitis activity index (M). (N) LCMV viral load 8 days after LCMV Armstrong infection using qPCR of glycoprotein gene normalized by tissue ACTB in diseased BXD2 treated with NP-control or NP-MK-0159. (O) Percentage of depolarized mitochondria in gp33+ CD8+ T cells 8 days after LCMV Armstrong infection from diseased BXD2 treated with NP-control or NP-MK-0159. (P and Q) MFI of PINK1 (P) and LysoSensor Green (Q) in gp33+ CD8+ T cells 8 days after LCMV Armstrong infection from diseased BXD2 treated with NP-control or NP-MK-0159. Data are means ± SD; statistical analysis by two-tailed t test. *P < 0.05, **P < 0.01.

References

    1. Tsokos G. C., Systemic lupus erythematosus. N. Engl. J. Med. 365, 2110–2121 (2011). - PubMed
    1. Bultink I. E. M., de Vries F., van Vollenhoven R. F., Lalmohamed A., Mortality, causes of death and influence of medication use in patients with systemic lupus erythematosus vs matched controls. Rheumatology (Oxford) 60, 207–216 (2021). - PMC - PubMed
    1. Feldman C. H., Hiraki L. T., Winkelmayer W. C., Marty F. M., Franklin J. M., Kim S. C., Costenbader K. H., Serious infections among adult Medicaid beneficiaries with systemic lupus erythematosus and lupus nephritis. Arthritis Rheumatol. 67, 1577–1585 (2015). - PMC - PubMed
    1. Comte D., Karampetsou M. P., Yoshida N., Kis-Toth K., Kyttaris V. C., Tsokos G. C., Signaling lymphocytic activation molecule family member 7 engagement restores defective effector CD8+ T cell function in systemic lupus erythematosus. Arthritis Rheumatol. 69, 1035–1044 (2017). - PMC - PubMed
    1. Kang I., Quan T., Nolasco H., Park S. H., Hong M. S., Crouch J., Pamer E. G., Howe J. G., Craft J., Defective control of latent Epstein-Barr virus infection in systemic lupus erythematosus. J. Immunol. 172, 1287–1294 (2004). - PubMed