. 2022 Jun 17;8(24):eabn2706.
doi: 10.1126/sciadv.abn2706. Epub 2022 Jun 15.

A long noncoding RNA promotes parasite differentiation in African trypanosomes

Affiliations

A long noncoding RNA promotes parasite differentiation in African trypanosomes

Fabien Guegan et al. Sci Adv. .

Abstract

The parasite Trypanosoma brucei causes African sleeping sickness that is fatal to patients if untreated. Parasite differentiation from a replicative slender form into a quiescent stumpy form promotes host survival and parasite transmission. Long noncoding RNAs (lncRNAs) are known to regulate cell differentiation in other eukaryotes. To determine whether lncRNAs are also involved in parasite differentiation, we used RNA sequencing to survey the T. brucei genome, identifying 1428 previously uncharacterized lncRNA genes. We find that grumpy lncRNA is a key regulator that promotes parasite differentiation into the quiescent stumpy form. This function is promoted by a small nucleolar RNA encoded within the grumpy lncRNA. snoGRUMPY binds to messenger RNAs of at least two stumpy regulatory genes, promoting their expression. grumpy overexpression reduces parasitemia in infected mice. Our analyses suggest that T. brucei lncRNAs modulate parasite-host interactions and provide a mechanism by which grumpy regulates cell differentiation in trypanosomes.


Figures

Fig. 1.
Fig. 1.. Identification of 1428 lncRNAs in T. brucei.
(A) Pipeline used for the identification of lncRNAs genes in T. brucei. (1) Strand-specific and paired-end RNA-seq. (2) Ksplice identified putative genes whose transcripts contained an SL sequence (SL) and a poly(A) tail (PA) at the extremities. Ksplice used LAST (48) to map RNA-seq reads to the T. brucei genome. (3) The noncoding nature of the putative lncRNAs was predicted from a low coding potential calculator (CPC) score, poor association with ribosomes, and no detectable peptides. grumpy lncRNA is intergenic and immediately upstream of RBP7 genes, previously shown to be involved in the SIF-dependent pathway. (B) The number of full-length lncRNAs [from the SL sequence to the poly(A) tail] sequenced with Nanopore in four RNA samples: two from BSF parasites (BSF) and two from procyclic forms (PCF). (C) Distribution of poly(A) tail lengths in lncRNA candidates versus other transcripts. (D) Subcellular localization of Ksplice lncRNA genes in slender forms (SL), stumpy forms (ST), and PCF of T. brucei, using RNA-FISH. (E) The number of Ksplice lncRNA genes that cause loss of parasite fitness upon down-regulation by RNAi [extracted from RIT-seq analysis (23)]. RNAi was induced in BSFs for 3 days (BSD3), 278 lncRNAs; in BSFs for 6 days (BSD6), 341 lncRNAs; during in vitro parasite differentiation from BSF to insect procyclic forms (DIF), 400 lncRNAs; in PCF, 402 lncRNAs. The total number of lncRNA genes essential for parasite fitness in this screen was 649.
Fig. 2.
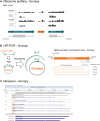
Fig. 2.. grumpy is not associated with ribosomes and it has alternative 3′ ends.
(A) Ribosome association of grumpy and its neighboring genes was assessed by analyzing previously published ribosome profiling datasets: Mapping of RNA-seq reads from BSFs (BSF-RNA) or PCF (PCF-RNA); mapping of ribosome profiling reads from BSFs (BSF-RT) or procyclic forms (PCF-RT). (B) Sequencing and accurate mapping of the 5′ and 3′ ends of the grumpy lncRNA using cRT-PCR. Black outlined arrows show the position of splice-acceptor site (SL) and polyadenylation sites (PA) identified with our Ksplice algorithm in the grumpy gene locus. Orange outlined arrows show the grumpy transcript isoforms that we sequenced using cRT-PCR and the number of clones sequenced for each isoform. (C) Identification of complete sequences of grumpy with Nanopore direct RNA-seq. Sequence alignment of identified grumpy reads [5′ splice-acceptor site were included, while 3′ poly(A) tail sequences were omitted for clarity]. The three main isoforms of grumpy (KS17gene_3137a) are annotated (in blue) below the reads alignment.
Fig. 3.
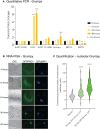
Fig. 3.. Dynamic subnuclear localization of grumpy during parasite differentiation.
(A) Transcript-level changes during the transition from slender to stumpy forms, measured by RT-qPCR. Stumpy formation was induced by pCPT-cAMP (C3912, Sigma-Aldrich). Tb927.2.2220 is used as a control to normalize transcript levels (73). PAD1 and GFP genes are used as controls to estimate parasite differentiation into stumpy forms. Tb927.10.12080 is the gene upstream of grumpy. Results are shown as means (SEM, n = 3 except for the 48-hour time point, n = 2). Dunnett’s multiple comparisons test was used for statistical analysis using the 0-hour time point as the control for comparison (adjusted P values: *P < 0.05; **P < 0.01; ****P < 0.0001). (B) Subcellular localization of grumpy during the transition from slender to stumpy forms using RNA-FISH. Time points (0, 12, 24, 36, and 48 hours) of parasite differentiation after addition of the pCPT-cAMP stimulus to the culture medium. DIC, differential interference contrast microscopy image of T. brucei; GFP, GFP::PAD1 signal expressed in the nucleus of stumpy forms; GRUMPY, grumpy signal using RNA-FISH (Stellaris probes). (C) Quantification of the intensity of the nucleolar grumpy RNA-FISH signal corrected with the cytoplasmic signal, during stumpy formation induced by pCPT-cAMP at time 0, 24, and 48 hours. Statistical test: one-way analysis of variance (ANOVA) (Dunnett’s multiple comparisons test), adjusted P value: ****P < 0.0001.
Fig. 4.
Fig. 4.. grumpy lncRNA is processed into a snoRNA, called snoGRUMPY.
(A) Protein partners of grumpy lncRNA identified using in vitro RNA-protein pulldown assay. Results are shown as the mean difference between pulldown assays performed with grumpy lncRNA and control lncRNA-5090a. Note that mitochondria proteins found in this in vitro RNA-protein pulldown assay could come from mitochondria contamination (see Materials and Methods). (B) RIP assay using anti-DRBD3 antiserum in BSFs and procyclic forms. Results are shown as the means (SEM, n = 3) and compared to RIP using control serum. Statistical test: two-sided t test, *P < 0.05, **P < 0.005, ***P < 0.0005, and ****P < 0.00005. (C to F) snoRNA encoded by grumpy lncRNA, named snoGRUMPY. (C) Northern blot analysis using probe against snoGRUMPY in procyclic forms, slender forms, and stumpy forms. tRNAser serves as a loading control. The first lane shows the molecular marker (Mkr) and its different sizes annotated in nucleotides. (D) Northern blot analysis using probe against snoGRUMPY in RNAi hnRNP F/H cell line (in procyclic forms). 7SL RNA serves as a loading control for the Northern blot. Bottom: Western blot analysis showing the depletion of hnRNP F/H protein. ZC3H41 serves as a loading control for Western blot. (E) RNA-FISH analysis showing partial colocalization between snoGRUMPY and the nucleolar marker NHP2 (in procyclic forms). (F) grumpy and snoGRUMPY transcript level measured by RT-qPCR during the transition from slender to stumpy forms induced by the SIF signal (cell density). Tb927.2.2220 is used as a control to normalize transcript levels. Results are shown as means (SEM, n = 3), statistical test: two-way ANOVA (Dunnett’s multiple comparisons test), adjusted P values: *P < 0.05; ***P < 0.001; ****P < 0.0001.
Fig. 5.
Fig. 5.. grumpy overexpression promotes premature parasite differentiation.
(A) Transcript levels measured by RT-qPCR of grumpy and its neighboring genes in parental cell line (black bars) and in grumpy-overexpressing (OE) cell line, 24 hours after tetracycline induction (yellow bars). Changes in transcript levels were measured by normalizing transcript level to a control gene (Tb927.10.12970) and to the parental cell line. (B) Subcellular localization of grumpy after overexpression using RNA-FISH. Left to right: GRUMPY, grumpy signal using RNA-FISH; phase-contrast signal of T. brucei parasite; GFP, GFP::PAD1 signal expressed in the nucleus of stumpy forms. (C to F) After inducing grumpy overexpression, we measured (C) parasite growth for 6 days (without passage), (D) percentage of live cells measured by fluorescence-activated cell sorting (FACS) of propidium iodide–stained cells, (E) percentage of GFP::PAD1-positive parasites (stumpy forms) measured by FACS, (F) percentage of parasites expressing both GFP::PAD1 and endogenous PAD1 protein that are measured by microscopy and image quantification. Microscopy picture (on the left) shows an example of a parasite expressing both GFP::PAD1 in the nucleus (in green) and the endogenous PAD1 protein at the cell surface (in red). Parasite DNA stained with 4′,6-diamidino-2-phenylindole (DAPI) (in blue). (G) Cell cycle profile of parental cell line (slender forms) and grumpy-overexpressing parasites at days 3 and 4 of in vitro culture without passage. All results are shown as means (SEM, n = 3). Multiple t tests (A) and Sidak’s multiple comparisons test (C to G) are used for statistical analysis using the parental cell line as the control for comparison (adjusted P values: *P <0.05; **P < 0.01; ***P <0.001; ****P < 0.0001).
Fig. 6.
Fig. 6.. Overexpression of grumpy promotes premature differentiation into stumpy forms in vivo and prolongs mouse survival.
(A) Parasitemia in mice infected with the parental cell line (black line) or with a grumpy-overexpressing cell line. grumpy overexpression was either not induced or induced by adding doxycycline to drinking water either at day 0 (purple curve) or day 4 (yellow curve) of infection. Results are shown as the means (SEM, n = 4). Dunnett’s multiple comparisons test was used for statistical analysis using the parental cell line as the control (adjusted P values: **P < 0.01; ***P < 0.001). (B) Mouse survival rates according to the type of infection described in (A). Log-rank (Mantel-Cox) test for comparisons of Kaplan-Meier survival curves indicates a significant increase in the survival rates in mice infected with grumpy-overexpressing cell line parasites compared to mice infected with the parental cell line. φφP = 0.0067 and φP = 0.0177. (C) Fraction of mice with at least 20% of parasites GFP::PAD1 positive (arbitrary threshold that we defined to compare the initiation of stumpy formation between the different conditions) in the blood as a function of parasitemia. Log-rank (Mantel-Cox) test for comparisons of Kaplan-Meier curves indicates significant premature parasite differentiation into stumpy forms in mice infected with grumpy-overexpressing cell line parasites compared to mice infected with the parental cell line. φφP = 0.0067 and φP = 0.0177.
Fig. 7.
Fig. 7.. Overexpression of snoGRUMPY promotes premature differentiation into stumpy forms.
(A) Transcript levels measured by RT-qPCR of grumpy (black bars) and snoGRUMPY (yellow bars) in parasites overexpressing snoGRUMPY. Changes in transcript levels were measured by normalizing transcript level to a control gene (Tb927.2.2220) and to the parental cell line. Results are shown as the means (SEM, n = 3), statistical test: two-way ANOVA (Sidak’s multiple comparisons test), adjusted P value: ****P < 0.0001. (B) Subcellular localization of snoGRUMPY after overexpression using RNA-FISH (red signal). Parasite DNA is stained using DAPI (blue signal). (C) Growth in parasites overexpressing snoGRUMPY (without passage) for 3 days. Results are shown as the means (SEM, n = 3), statistical test: two-way ANOVA (Sidak’s multiple comparisons test), adjusted P value: ****P < 0.0001. (D) Percentage of GFP::PAD1-positive parasites (stumpy forms) measured by FACS after inducing snoGRUMPY overexpression. Results are shown as the means (SEM, n = 3), statistical test: two-way ANOVA (Sidak’s multiple comparisons test), adjusted P value: ****P < 0.0001.
Fig. 8.
Fig. 8.. snoGRUMPY interacts with stumpy-related transcripts and regulates their expression.
(A) Top 10 mRNA targets of snoGRUMPY identified using in vivo psoralen ultraviolet (UV) cross-linking. Results are shown as the total number of reads sequenced that match the specific target gene. (B to F) Tb927.10.12080 is an mRNA target of snoGRUMPY. (B) Growth curve of parasite overexpressing Tb927.10.12080 gene alone (light blue) or together with grumpy (dark blue). Results are shown as means (SEM, n = 3), statistical test: two-way ANOVA (Dunnett’s multiple comparisons test), adjusted P values: *P < 0.05; ****P < 0.0001. WT, wild-type. (C) Percentage of GFP::PAD1-positive parasites (stumpy forms) measured by FACS in parasite overexpressing Tb927.10.12080 gene alone (dark green) or together with grumpy (light green). Statistical test: two-way ANOVA (Tukey’s multiple comparisons test), adjusted P value: ****P < 0.0001. (D) RNA-FISH showing the localization of Tb927.1012080 mRNA (green) and grumpy lncRNA (red), in parasite overexpressing Tb927.10.12080 together with grumpy. The white arrow shows the colocalization of signal between Tb927.10.12080 mRNA and grumpy lncRNA. (E) Change in Tb927.10.12080 protein expression in grumpy-overexpressing cell line is analyzed by Western blot and normalized by the expression of housekeeping protein HSP83 (in procyclic forms). (F) Change in HYP5 (Tb927.8.2860) protein expression in grumpy-overexpressing cell line is analyzed by Western blot and normalized by the expression of housekeeping protein HSP83 (in procyclic forms). Statistical test for (E) and (F): two-tailed paired t test (*P < 0.05; **P < 0.01).

References

    1. Vassella E., Reuner B., Yutzy B., Boshart M., Differentiation of African trypanosomes is controlled by a density sensing mechanism which signals cell cycle arrest via the cAMP pathway. J. Cell Sci. 110, 2661–2671 (1997). - PubMed
    1. Silvester E., McWilliam K., Matthews K., The cytological events and molecular control of life cycle development of Trypanosoma brucei in the mammalian bloodstream. Pathogens 6, 29 (2017). - PMC - PubMed
    1. Mony B. M., MacGregor P., Ivens A., Rojas F., Cowton A., Young J., Horn D., Matthews K., Genome-wide dissection of the quorum sensing signalling pathway in Trypanosoma brucei. Nature 505, 681–685 (2014). - PMC - PubMed
    1. McDonald L., Cayla M., Ivens A., Mony B., MacGregor P., Silvester E., McWilliam K., Matthews K. R., Non-linear hierarchy of the quorum sensing signalling pathway in bloodstream form African trypanosomes. PLOS Pathog. 14, e1007145 (2018). - PMC - PubMed
    1. Mony B. M., Matthews K. R., Assembling the components of the quorum sensing pathway in African trypanosomes. Mol. Microbiol. 96, 220–232 (2015). - PMC - PubMed