. 2022 Jun 15;14(649):eabo0686.
doi: 10.1126/scitranslmed.abo0686. Epub 2022 Jun 15.

Granzyme K+ CD8 T cells form a core population in inflamed human tissue

Affiliations

Granzyme K+ CD8 T cells form a core population in inflamed human tissue

A Helena Jonsson et al. Sci Transl Med. .

Abstract

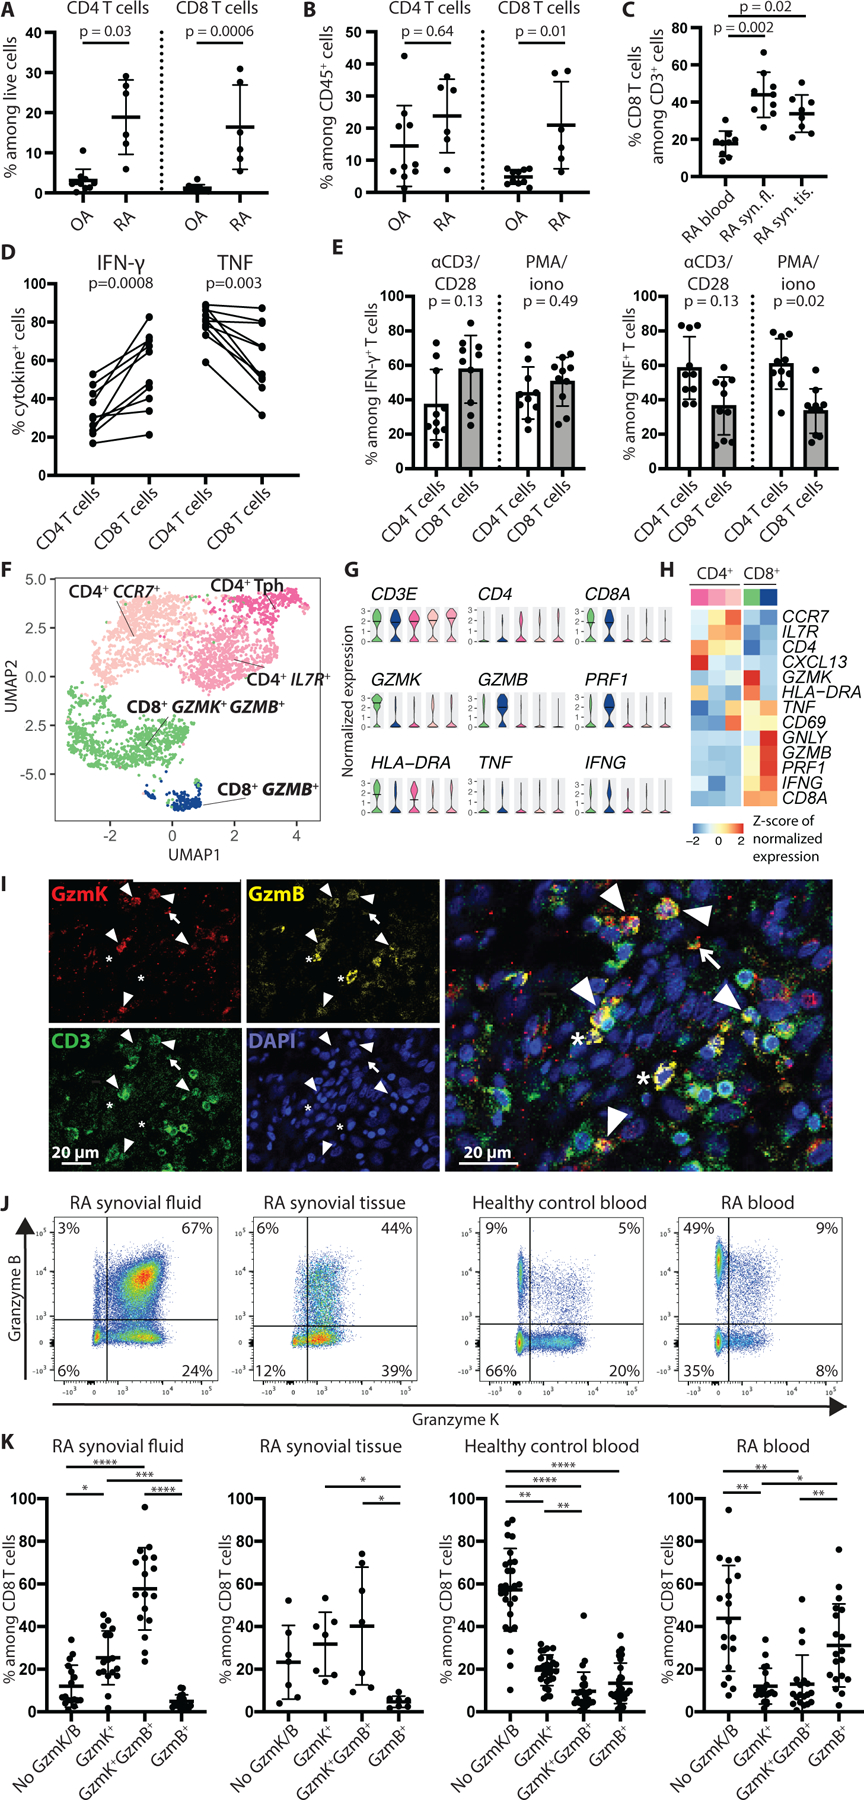
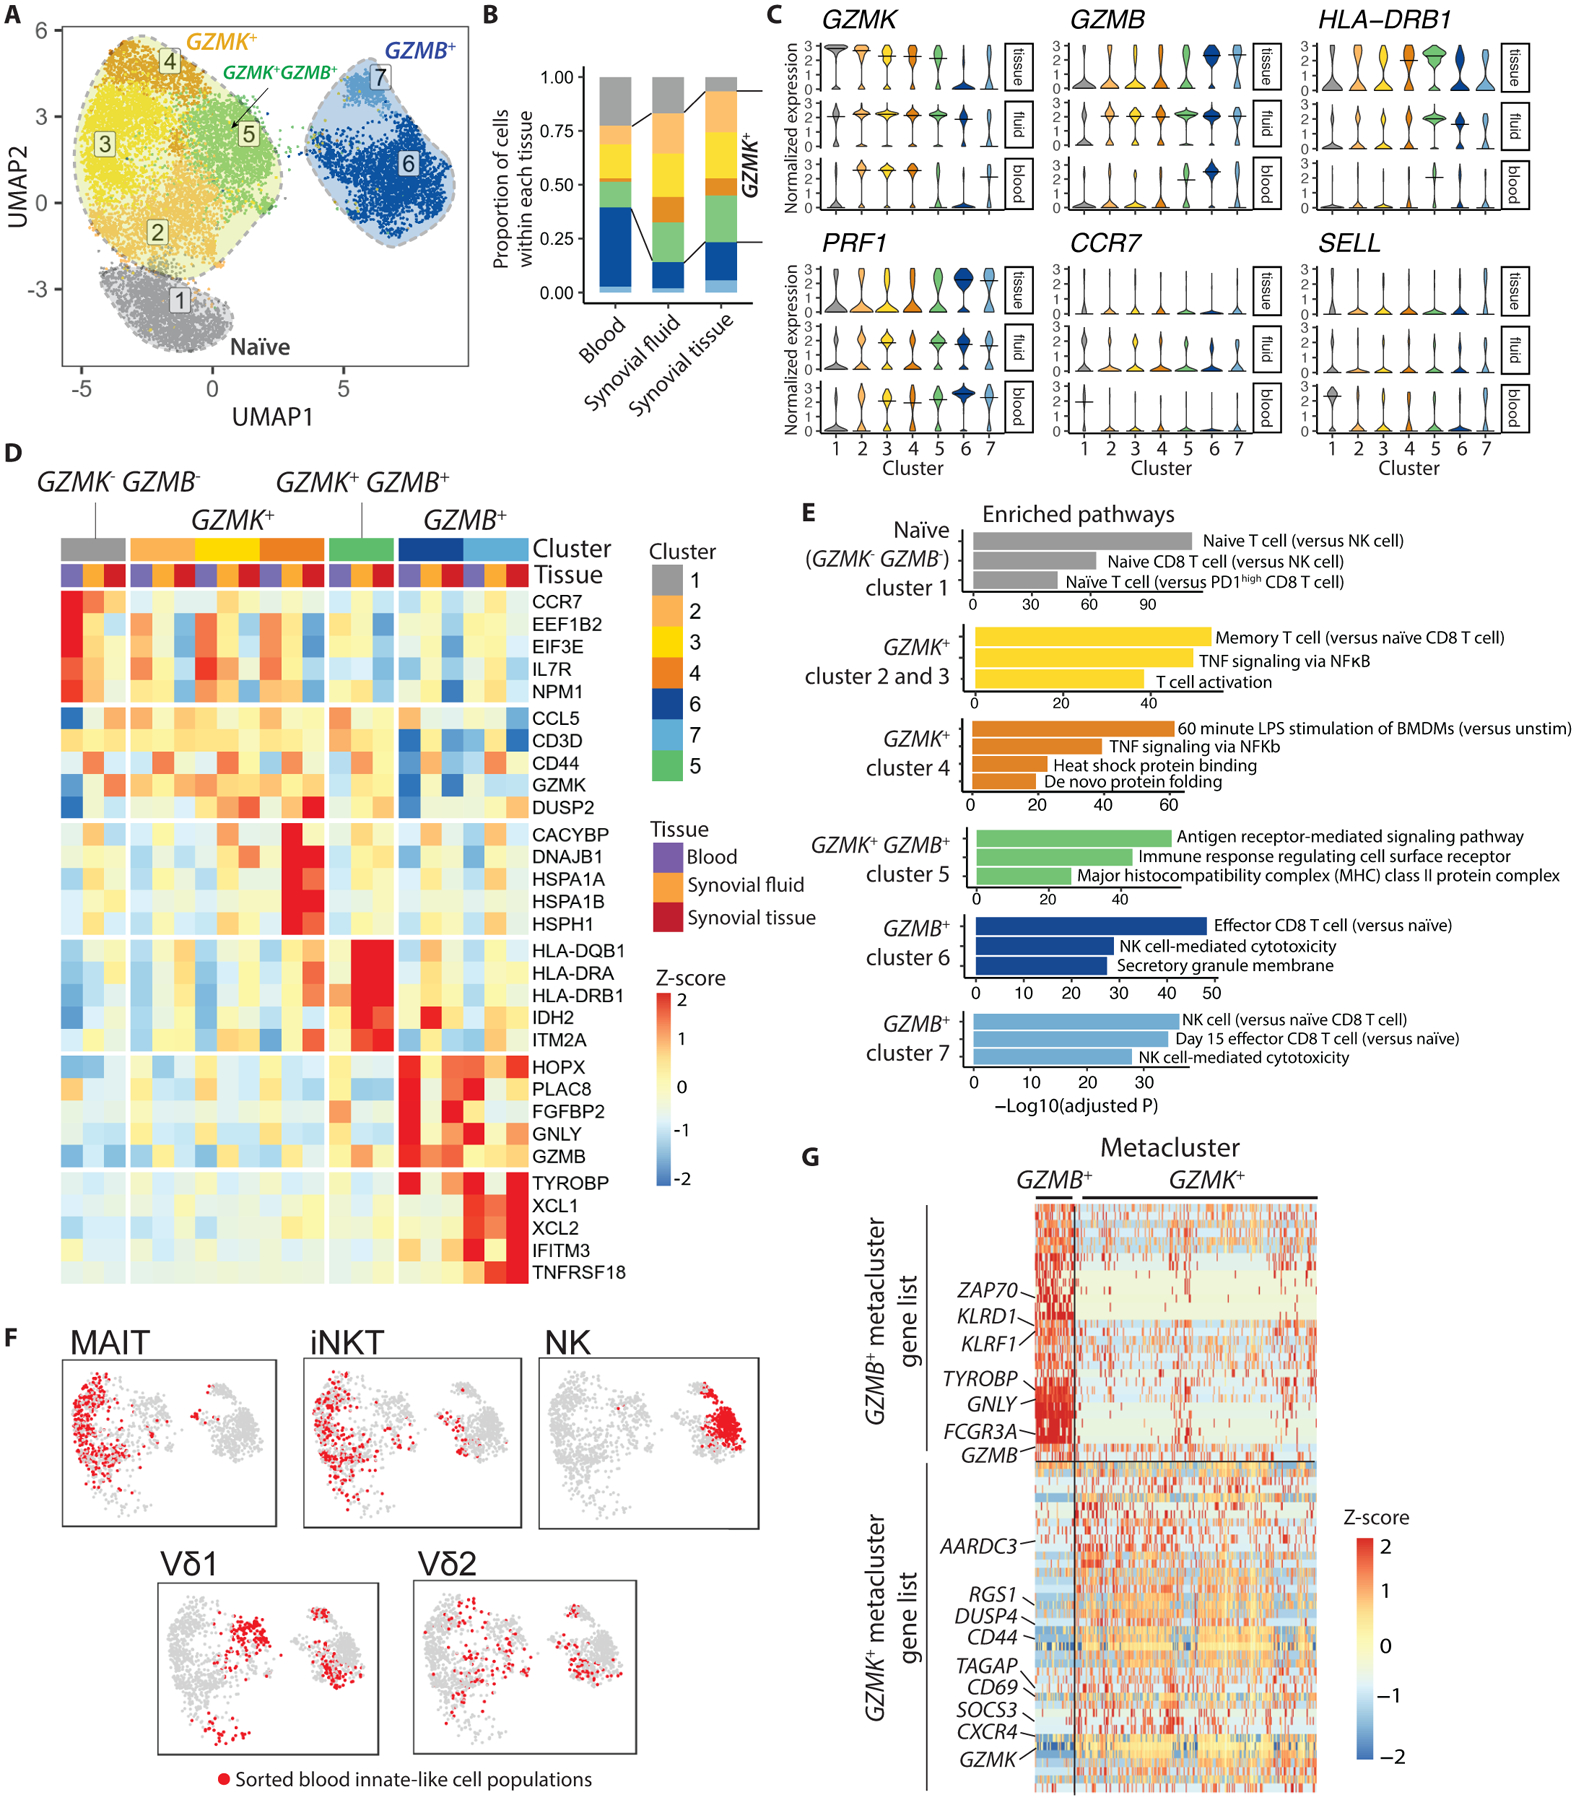
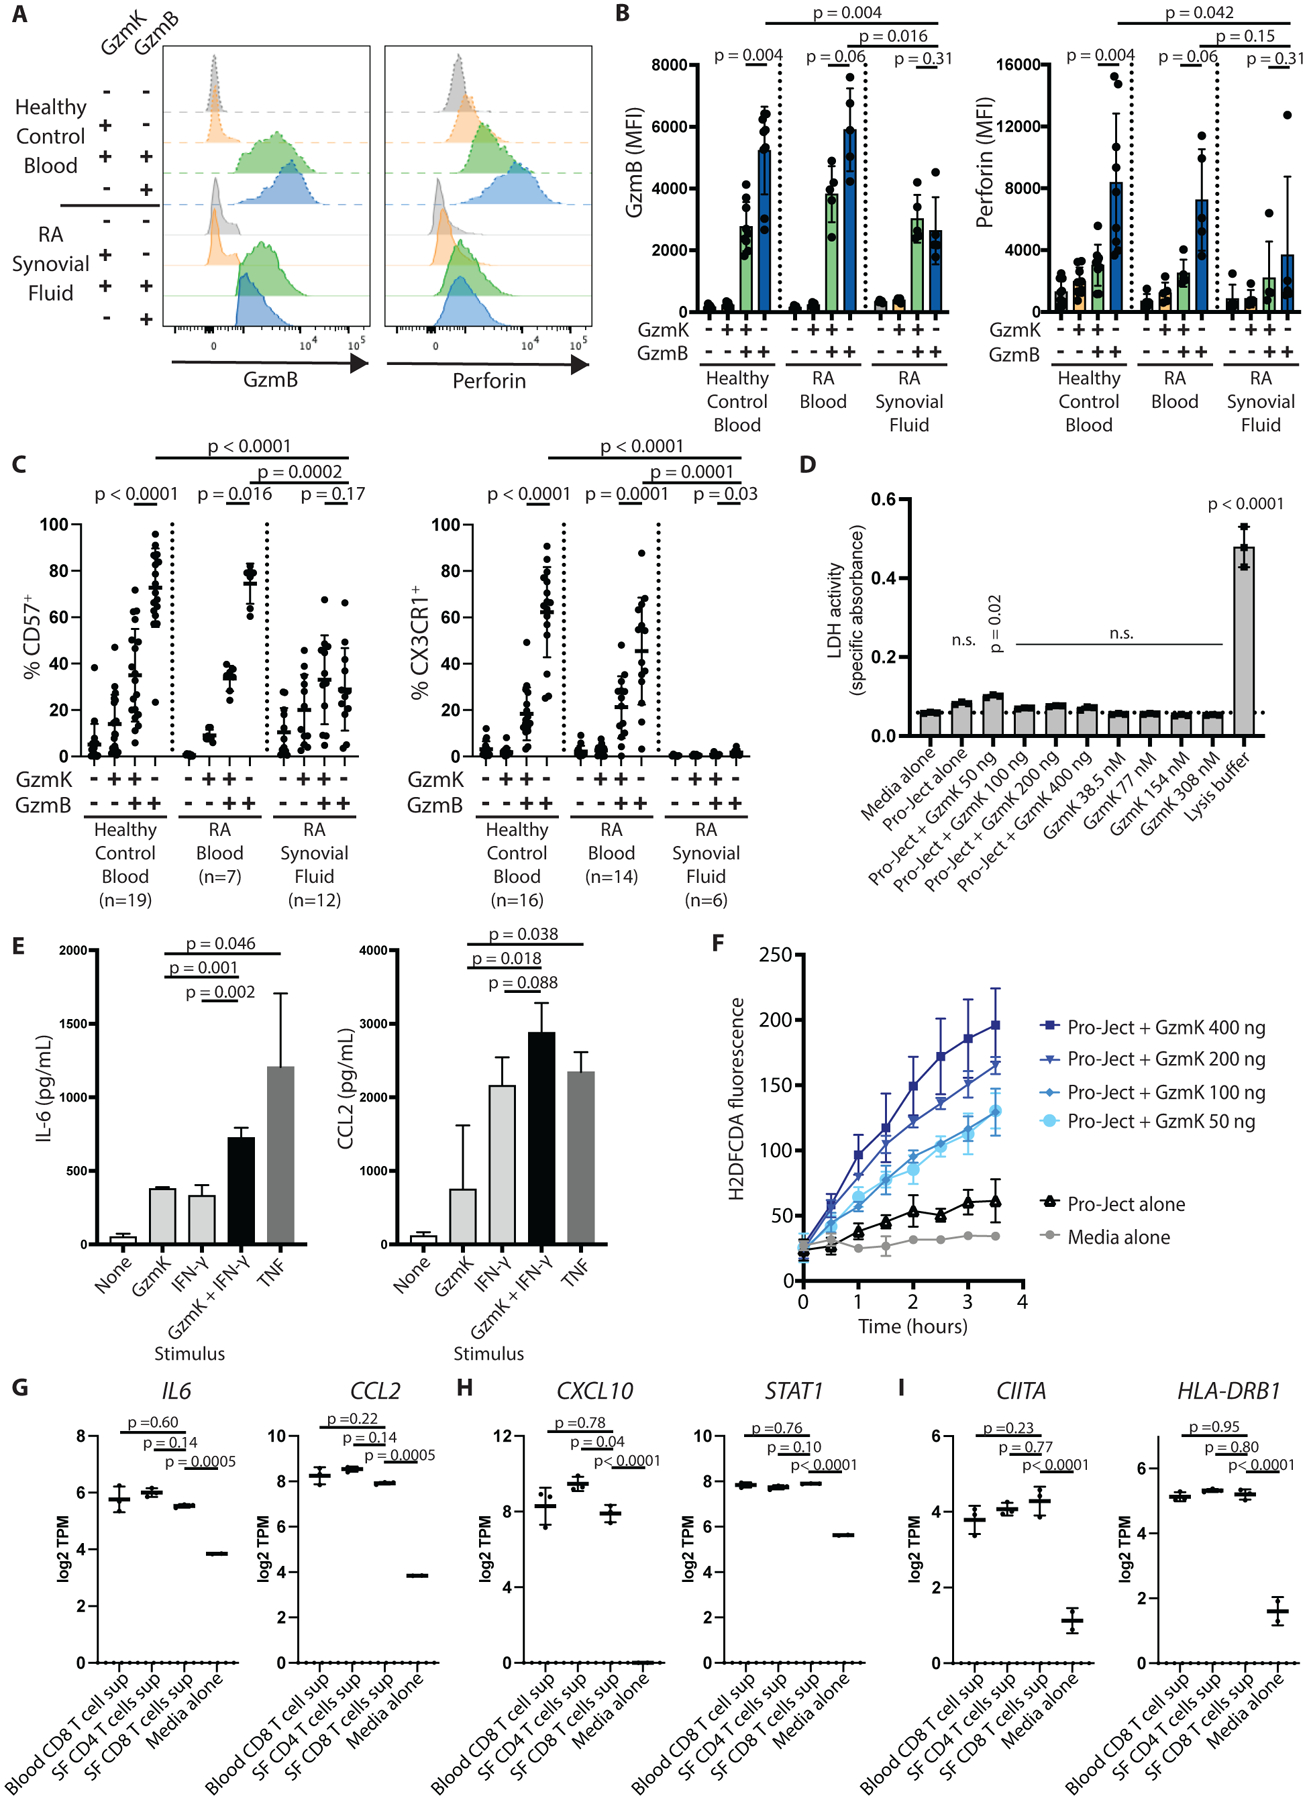
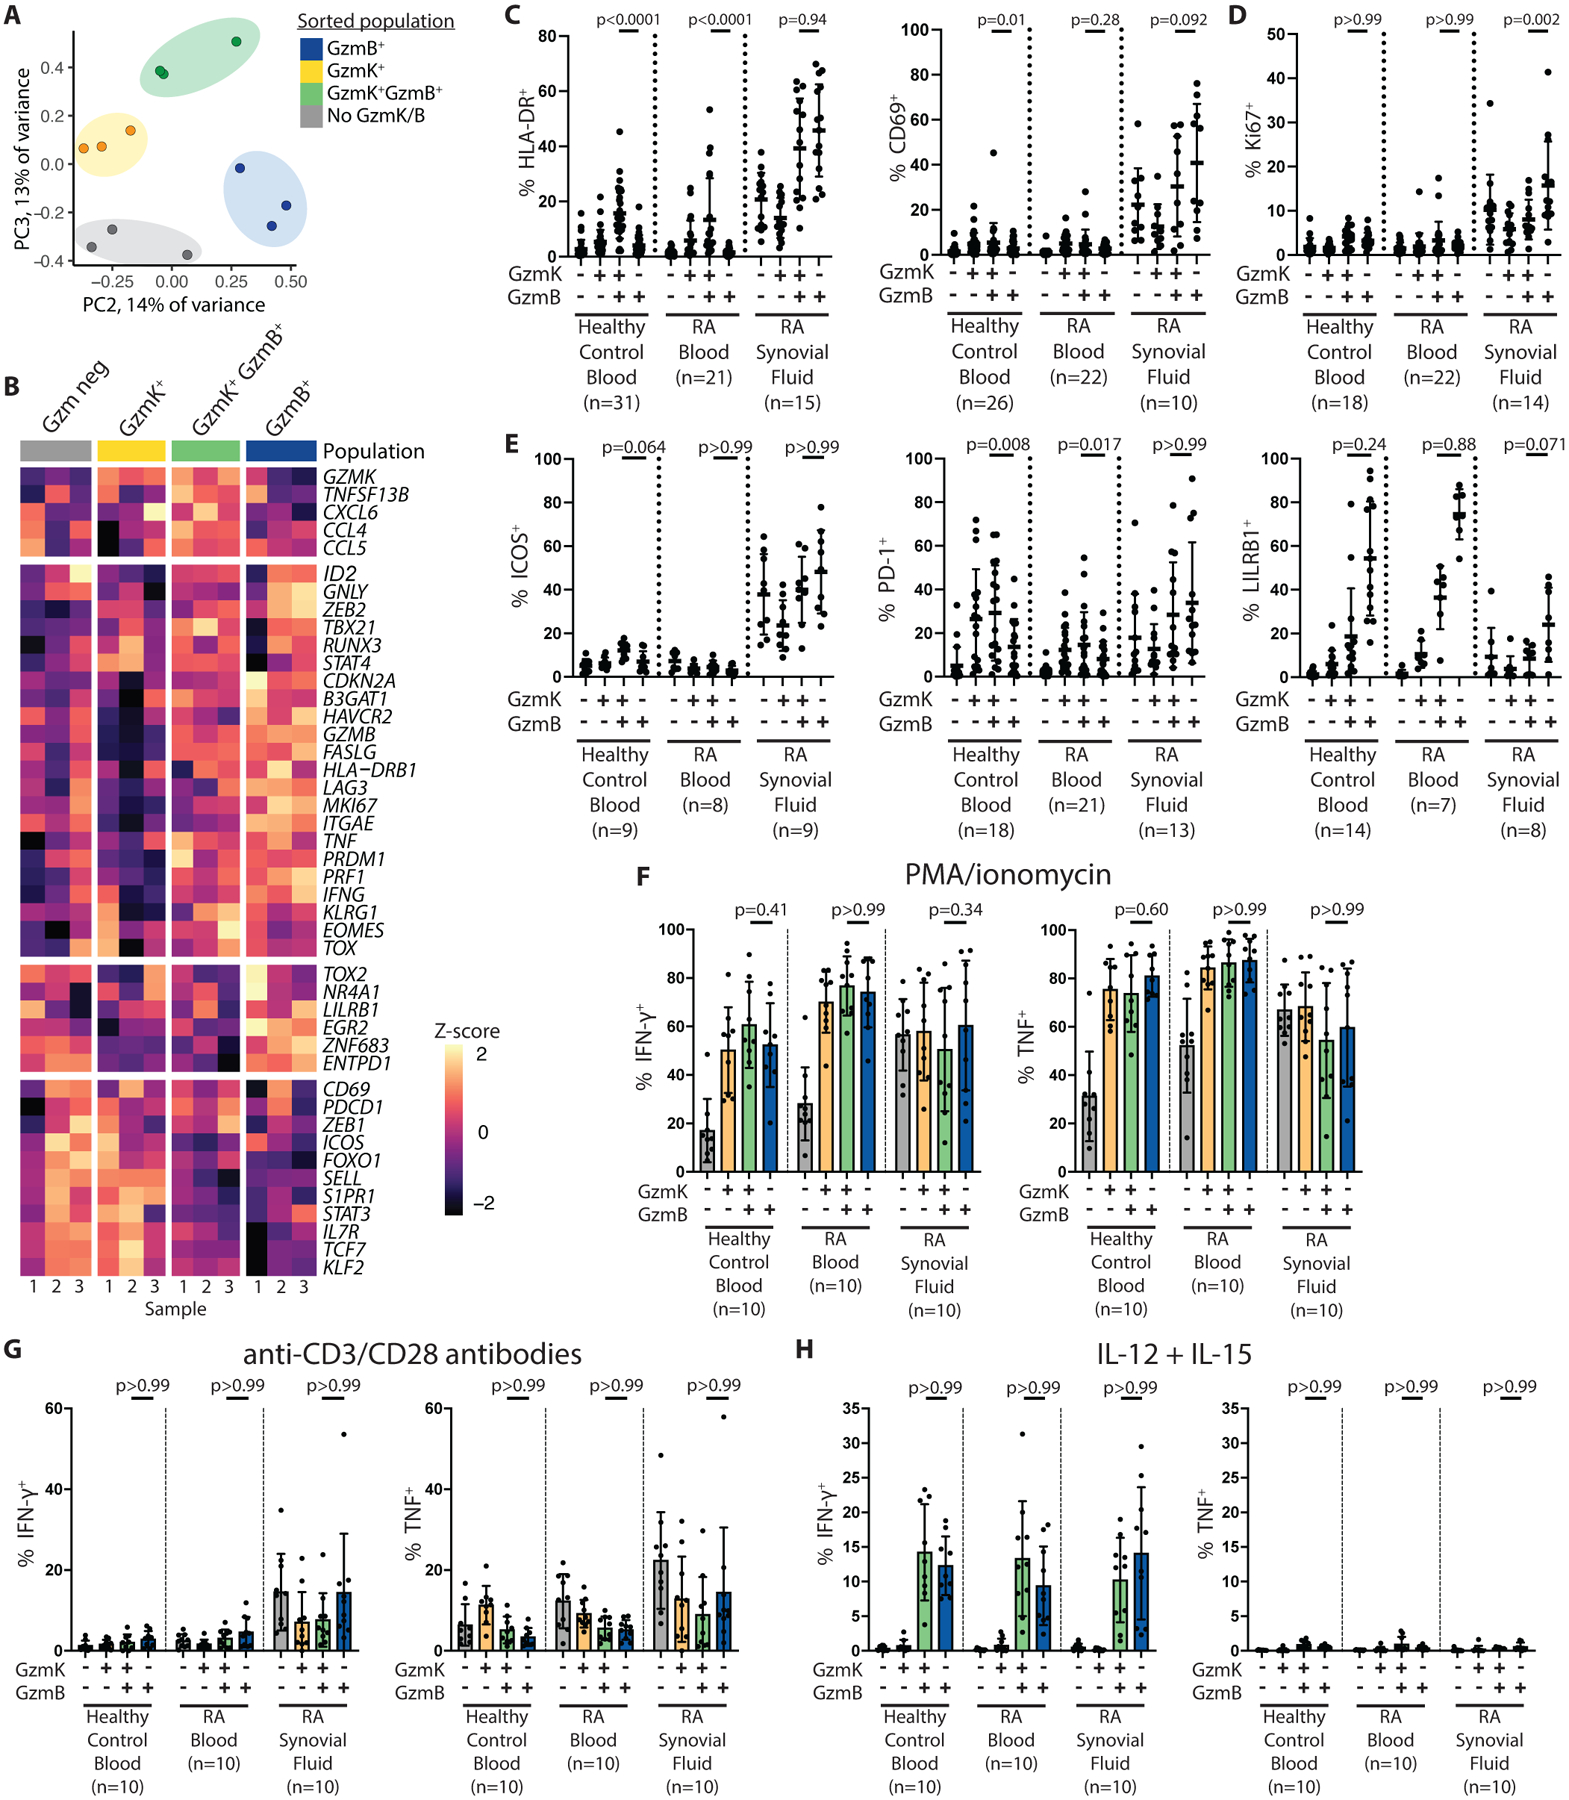
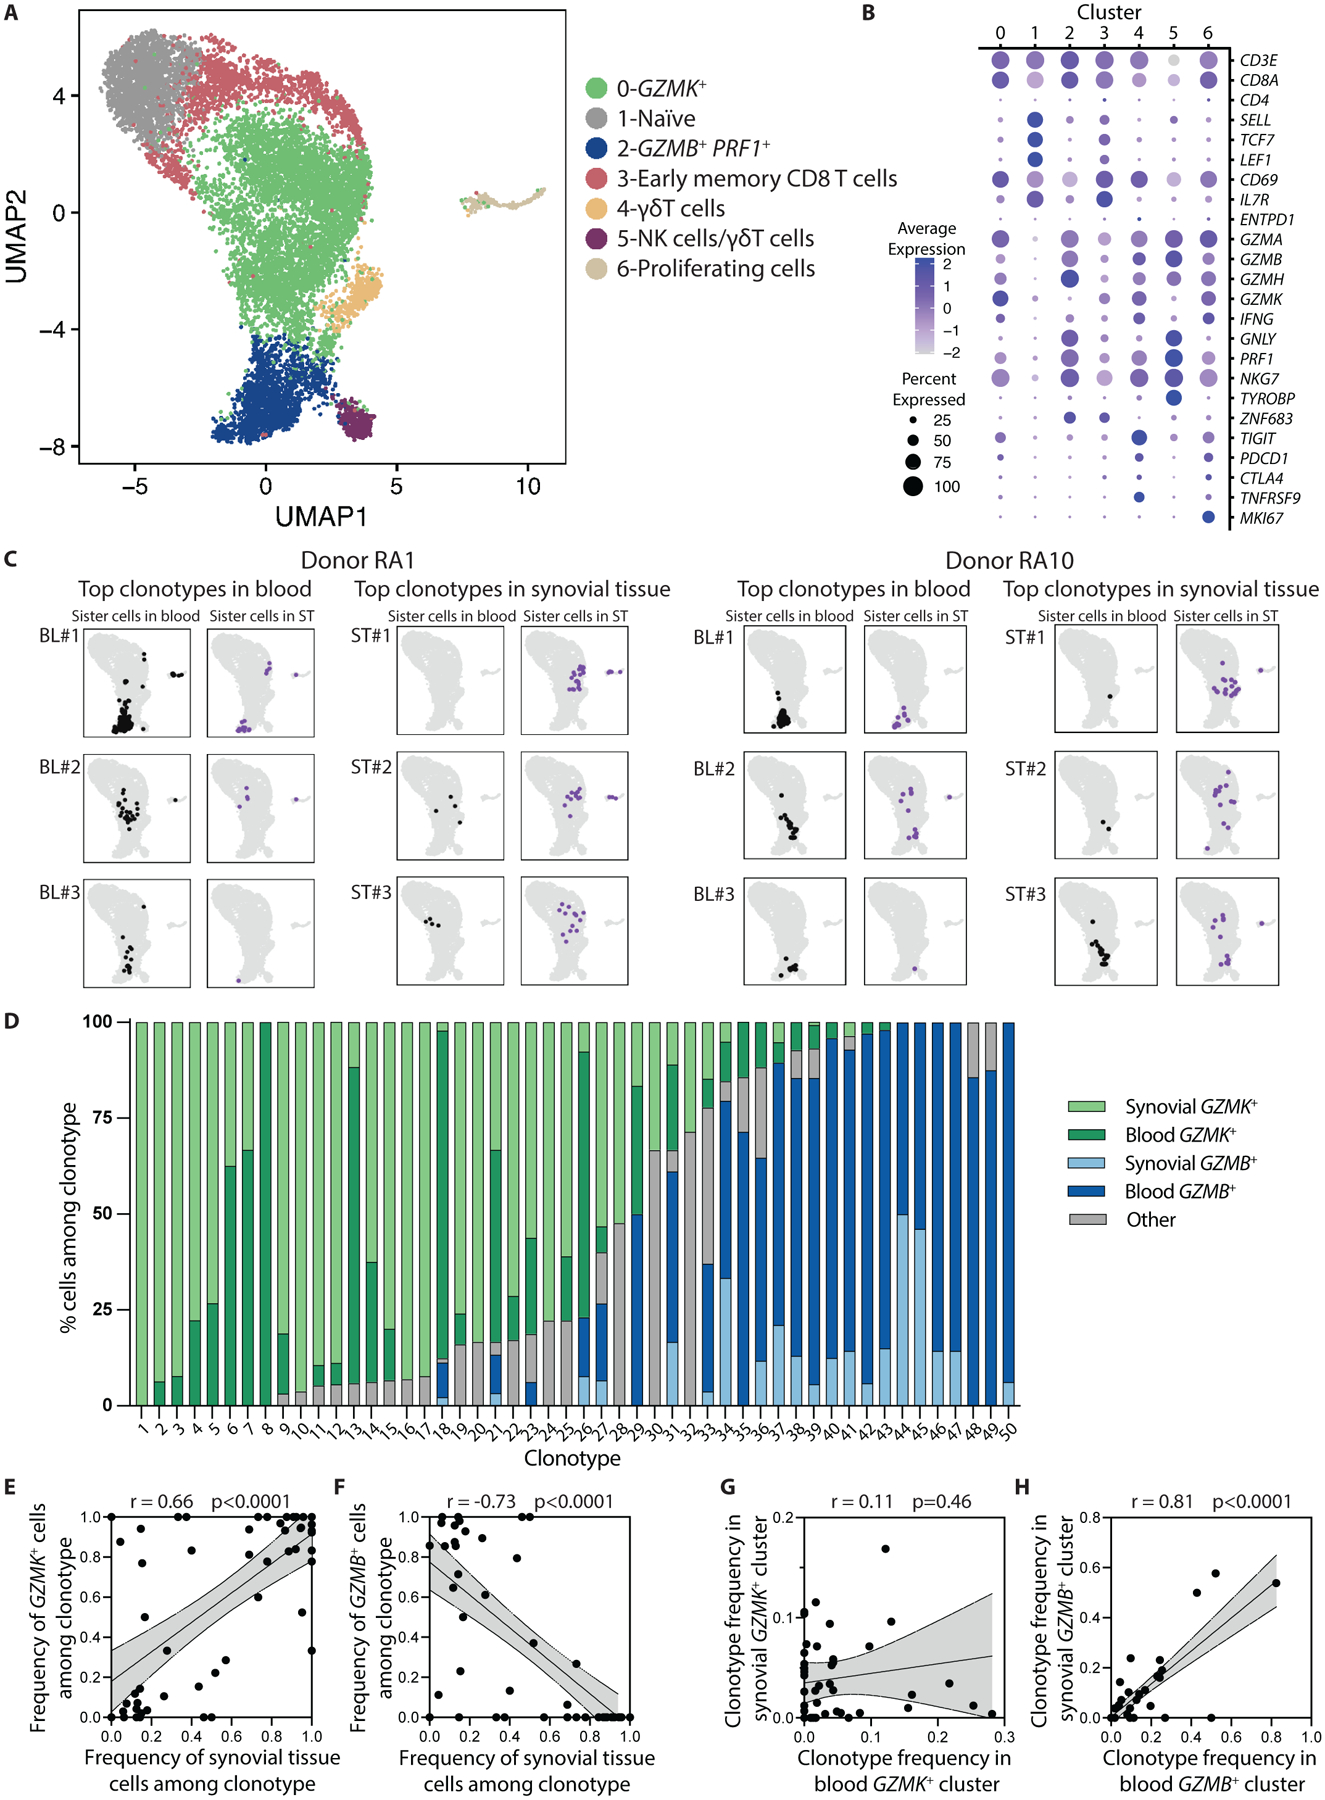
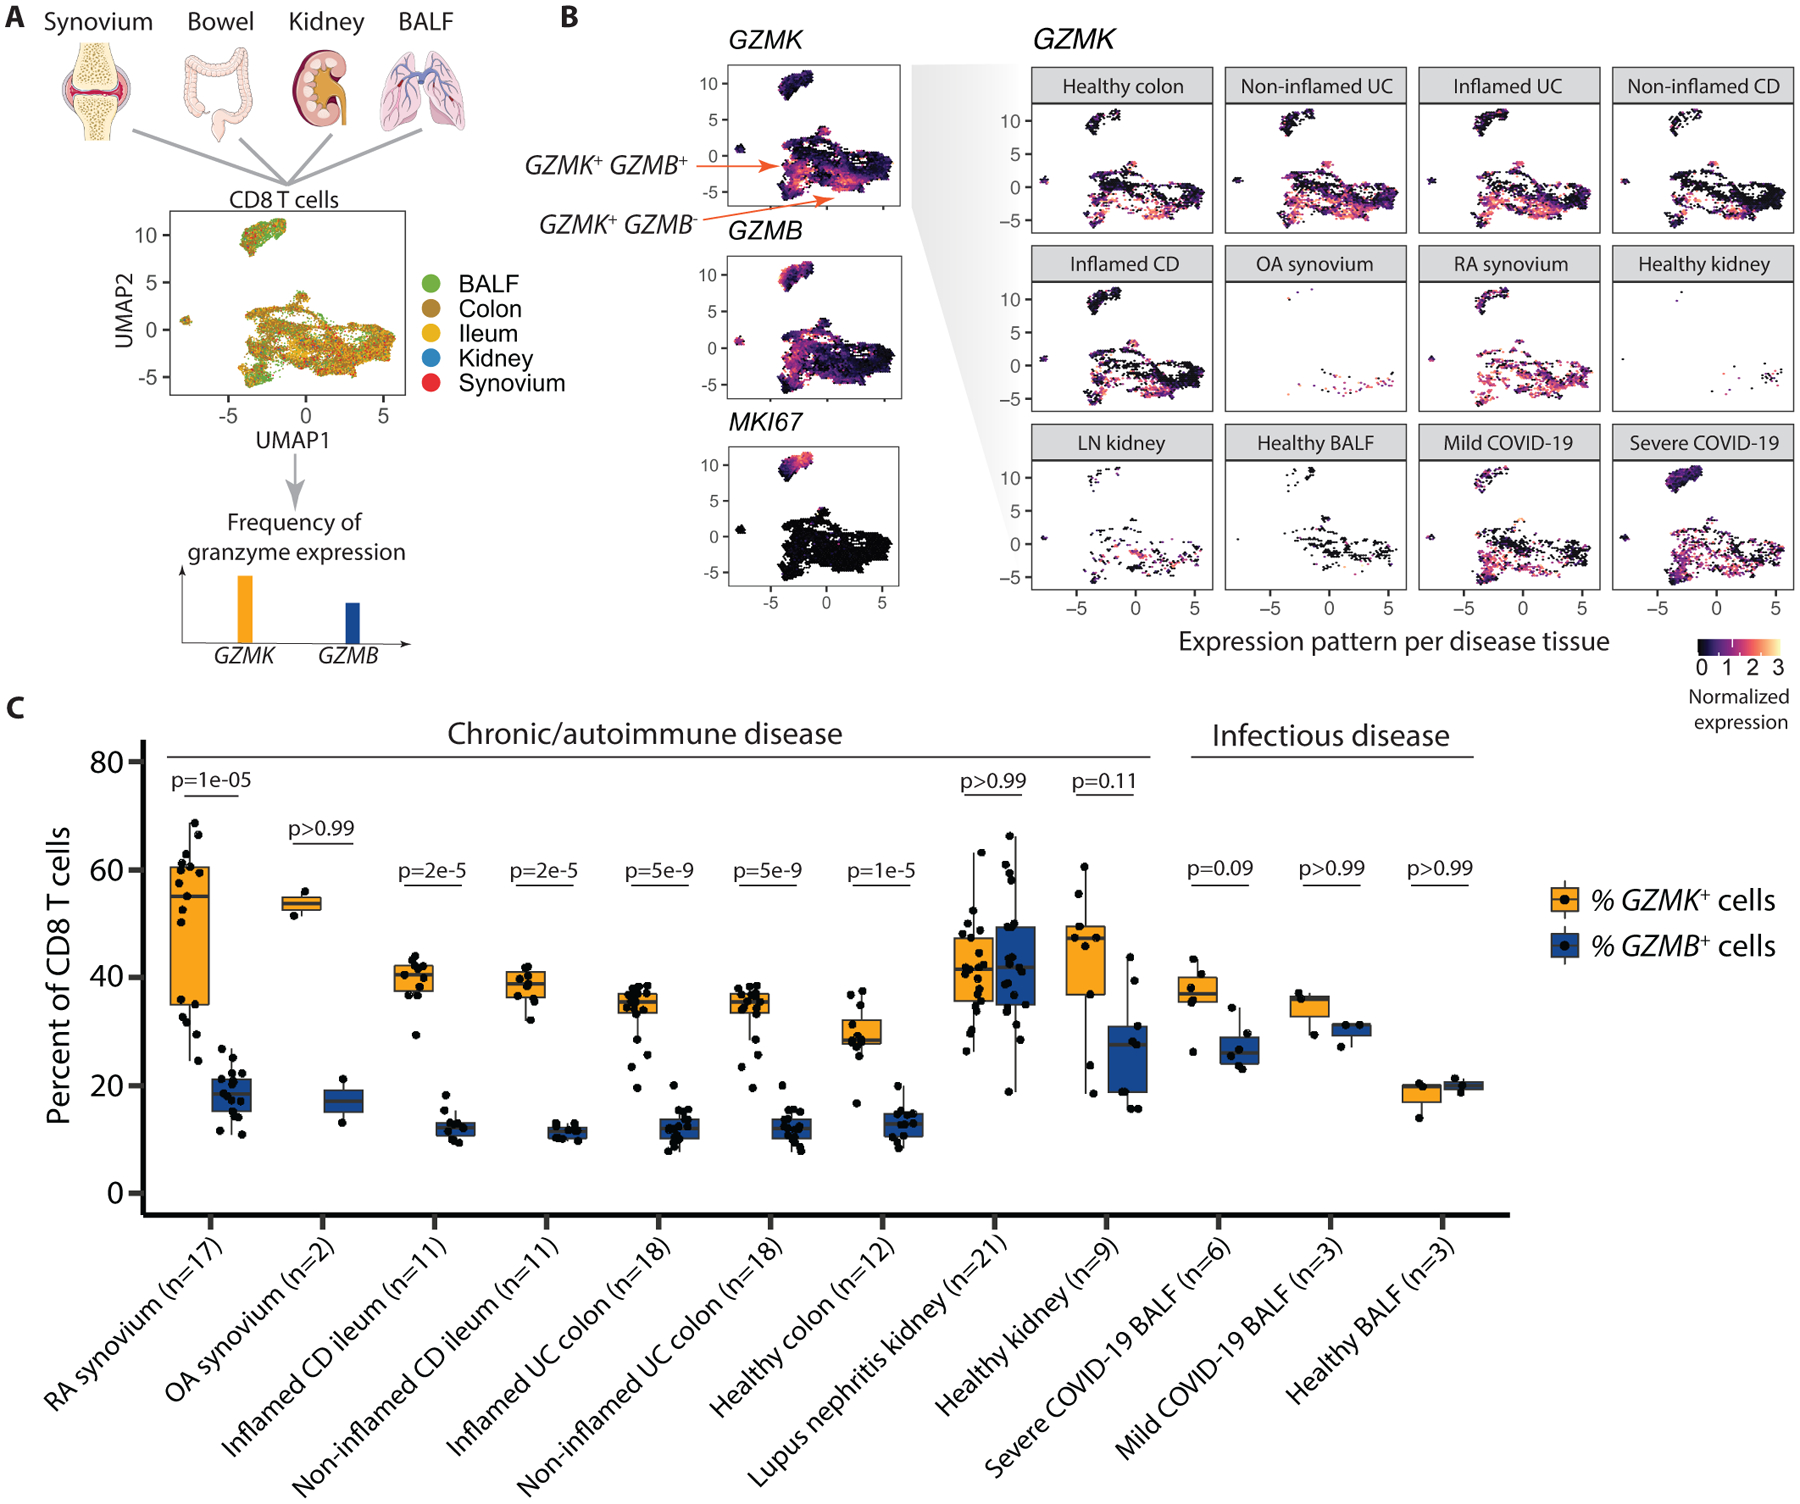
T cell-derived pro-inflammatory cytokines are a major driver of rheumatoid arthritis (RA) pathogenesis. Although these cytokines have traditionally been attributed to CD4 T cells, we have found that CD8 T cells are notably abundant in synovium and make more interferon (IFN)-γ and nearly as much tumor necrosis factor (TNF) as their CD4 T cell counterparts. Furthermore, using unbiased high-dimensional single-cell RNA-seq and flow cytometric data, we found that the vast majority of synovial tissue and synovial fluid CD8 T cells belong to an effector CD8 T cell population characterized by high expression of granzyme K (GzmK) and low expression of granzyme B (GzmB) and perforin. Functional experiments demonstrate that these GzmK+ GzmB+ CD8 T cells are major cytokine producers with low cytotoxic potential. Using T cell receptor repertoire data, we found that CD8 GzmK+ GzmB+ T cells are clonally expanded in synovial tissues and maintain their granzyme expression and overall cell state in blood, suggesting that they are enriched in tissue but also circulate. Using GzmK and GzmB signatures, we found that GzmK-expressing CD8 T cells were also the major CD8 T cell population in the gut, kidney, and coronavirus disease 2019 (COVID-19) bronchoalveolar lavage fluid, suggesting that they form a core population of tissue-associated T cells across diseases and human tissues. We term this population tissue-enriched expressing GzmK or TteK CD8 cells. Armed to produce cytokines in response to both antigen-dependent and antigen-independent stimuli, CD8 TteK cells have the potential to drive inflammation.


Figures

Fig. 1.
Fig. 1.. CD8 T cells in RA synovial tissue and fluid make TNF and IFN-γ and predominantly express GzmK, whereas only a small portion express GzmB alone.
(A and B) Frequency of CD8 T cells among total live cells (A) and CD45+ cells (B) is shown in synovial tissue from patients with active RA (n=6) compared to OA (n=10) in a published synovial tissue mass cytometry dataset (10). (C) Frequency of CD8 T cells among total T cells in blood (n=9), synovial fluid (syn. fl., n=9), and synovial tissue (syn. tis., n=8) of RA patients is shown. (D) The frequency of CD4 and CD8 T cells producing IFN-γ and TNF is shown for seropositive RA synovial fluid (n=10) after stimulation with PMA and ionomycin (PMA/iono) for three hours. Paired CD4 and CD8 T cell data from the same patient are connected by a line. (E) The percentage contribution to total IFN-γ- or TNF-producing T cell pool by CD4 versus CD8 T cells from seropositive RA synovial fluid (n=10) is shown after stimulation with anti-CD3/CD28 antibody-coated beads or PMA and ionomycin for three hours. (F) A UMAP plot of Louvain clustering of 4,111 single-cell RNA-seq profiles synovial tissue T cells is shown. (G) Violin plots are shown illustrating expression of selected genes by cells in each cluster from the UMAP plot in (F). (H) A pseudobulk heatmap shows expression of selected genes by the CD4 and CD8 T cell clusters shown in (F). (I) Immunofluorescent staining of RA synovial tissue is shown. White arrowheads indicate GzmK+ GzmB+ T cells. The arrow points to a GzmK+ T cell, and the asterisks indicate GzmB+ cells, which do not stain for CD3. (J and K) Representative flow cytometry plots (J) and cumulative data (K) show GzmK and GzmB expression among CD8 T cells from synovial fluid (n=17), synovial tissue (n=7), and blood (n=21) from patients with RA and blood from healthy controls (n=27). Bars in (A to C, E, and K) represent mean ± SD. Statistics by Mann-Whitney U-test (A and B), Kruskal-Wallis test (C), two-tailed ratio paired t-test (D and E) and Friedman test with Dunn’s multiple comparisons test (K) are shown. *p<0.05, **p<0.01, ***p<0.001, ****p<0.0001.
Fig. 2.
Fig. 2.. CD8 T cells and other granzyme-expressing lymphocytes in RA synovial tissue, fluid, and blood segregate into transcriptional clusters characterized by GzmK and GzmB expression.
(A) Clustering of 11,602 single-cell profiles from RA synovial tissue and fluid as well as healthy control blood reveals 7 distinct clusters. Clusters of cells are projected into UMAP space. (B) Proportion of cells of each cluster is shown by tissue source. (C) Violin plots are shown depicting expression of cluster marker genes among cells from synovial tissue, synovial fluid, and blood. (D) Heatmaps show Z-scores of the average expression of selected genes, separated by tissue source. Most significantly enriched pathways per cluster are shown next to the heatmaps. (E) Most significantly enriched pathways per cluster are shown. (F) Projections of sorted innate-like T cell and NK cell populations are shown in UMAP space. (G) A heat map displaying differentially expressed genes between the GzmK and GzmB metaclusters, which make up the GzmK and GzmB gene signatures, is shown.
Fig. 3.
Fig. 3.. GzmK+ GzmB+ CD8 T cells have reduced cytotoxic potential in both healthy control blood and synovial fluid.
(A) Histograms show GzmB and perforin expression by the indicated CD8 T cell subset from healthy control blood (dashed lines) or RA synovial fluid (solid lines). (B) Cumulative mean fluorescence intensities (MFI) for GzmB and perforin staining by the indicated CD8 T cell subset are shown for healthy control blood (n=9), RA blood (n=5), and RA synovial fluid (n=5). Bars represent SD. (C) Expression of cytotoxic markers CD57 and CX3CR1 by the indicated CD8 T cell population are shown for healthy control blood, RA blood, or RA synovial fluid, as measured by flow cytometry. Bars represent SD. (D) RA synovial fibroblasts were incubated for 24 hours with recombinant enzymatically active GzmK in the culture supernatant or packaged into a protein transfection reagent (Pro-Ject). Cell death was measured by LDH release assay. Bars show SD of technical replicates. Representative of two independent assays. (E) RA synovial fibroblasts were incubated with recombinant GzmK, IFN-γ, or TNF for 24 hours, and IL-6 and CCL2 production was measured by enzyme-linked immunosorbent assay (ELISA). Bars show mean ± SD of three technical replicates; representative of four independent assays. (F) Recombinant GzmK was packaged into a protein transfection reagent and applied to RA synovial fibroblasts. ROS production was measured by 2’,7’-dichlorodihydrofluorescein diacetate (H2DFCDA) fluorescence over time. (G to I) Expression of selected genes involved in (G) pro-inflammatory signaling, (H) IFN-γ signatures, and (I) antigen processing and presentation are shown for low-input RNA-seq data of RA synovial fibroblasts stimulated with supernatants from the indicated T cell subset. SF, synovial fluid; TPM, transcripts per million. Bars show mean ± SD of three biological replicates. Statistical testing was done by (B and C) Wilcoxon matched-pairs signed rank test (within tissues) and Mann-Whitney test (across tissues); (D, G to I) one-way ANOVA with Dunnett’s multiple comparisons test, comparing all groups to (D) media alone or (G to I) synovial fluid CD8 T cell supernatant-stimulated cells, and (E) unpaired t-test. n.s., not significant.
Fig. 4.
Fig. 4.. GzmK+ GzmB+ CD8 T cells are activated, tissue-resident CD8 T cells that do not show signs of exhaustion or senescence in blood and synovial fluid.
(A) A PCA plot is shown for low-input bulk RNA-seq data obtained from fixed and intracellularly stained RA synovial fluid CD8 T cells sorted for GzmK and GzmB expression. (B) Z-score heat maps of expression of selected genes in the low-input bulk RNA-seq dataset are shown. (C to E) The proportions of cells expressing markers of (C) activation (HLA-DR and CD69), (D) proliferation (Ki67), and (E) exhaustion or senescence (ICOS, PD-1, LILRB1) are shown for the indicated CD8 T cell subset in healthy control blood, seropositive RA blood, or seropositive RA synovial fluid, as measured by flow cytometry. (F to H) The proportions of cells within the indicated CD8 T cell subset producing IFN-γ and TNF are shown for healthy control blood (n=9), seropositive RA blood (n=10), or seropositive RA synovial fluid (n=10) after four hours of stimulation with (F) PMA and ionomycin or (G) anti-CD3/CD28 antibody-coated beads, or with (H) overnight stimulation with IL-12 and IL-15, as measured by intracellular cytokine staining. Statistical testing was done by Friedman test. Due to space constraints, only selected statistically significant differences are labeled. Bars represent mean ± SD.
Fig. 5.
Fig. 5.. TCR repertoire data connects synovial GZMK+ CD8 T cells with GZMK+ CD8 T cells in blood.
(A) A UMAP plot of Louvain clustering of 11,030 single-cell profiles from RA synovial tissue (6,555 cells) and matched blood (4,475 cells) reveals 7 distinct clusters. (B) Expression of selected markers is shown for the individual clusters shown in (A). (C) Mapping of sister cells belonging to the top 3 most frequent clonotypes in blood and synovial fluid from two representative patients shows that cells within a clonotype tend to map to the same location within the UMAP, whether they are in blood or synovial tissue (ST). (D) Transcriptional cluster and tissue origin is shown for clonal cells in the 50 analyzed clonotypes. Cells mapping to any of the five clusters other than GZMK+ or GZMB+ were categorized as “other.” (E and F) Correlations are shown for the frequency of synovial tissue cells among each of the 50 analyzed clonotypes and the frequency of clones in the GZMK+ (E) or GZMB+ (F) cluster in that clonotype. (G and H) Correlations are shown for the frequency of each of the 50 analyzed clonotypes among blood and synovial tissue CD8 T cells in the GZMK+ (G) or GZMB+ (H) cluster in that individual. Statistical testing was done by Pearson correlation.
Fig. 6.
Fig. 6.. GZMK is prominently expressed by CD8 T cells isolated from multiple healthy and diseased tissues.
(A) The diagram illustrates the unbiased integration of 26,625 single-cell profiles from CD8 T cells in RNA-seq datasets from healthy or diseased tissues from RA synovium, Crohn’s disease (CD) ileum, ulcerative colitis colon, lupus nephritis (LN) kidney, and COVID-19 bronchoalveolar lavage fluid, where colors represent different tissue sources. The frequency of GZMK and GZMB gene expression was then assessed. (B) Expression pattern of GZMK, GZMB, and MKI67 (Ki67) is shown for the integrative dataset in UMAP space. The UMAP depicts expression of GZMK by cells from each individual tissue and disease state. (C) The percent of CD8 T cells from the indicated samples expressing GZMK or GZMB mRNA is shown. Data were analyzed by a two-tailed Wilcoxon rank-sum test. Boxplots summarize the median, interquartile range and 95% quantile range.

References

    1. Amariuta T, Luo Y, Knevel R, Okada Y, Raychaudhuri S, Advances in genetics toward identifying pathogenic cell states of rheumatoid arthritis. Immunol. Rev 294, 188–204 (2020). - PMC - PubMed
    1. Raychaudhuri S, Sandor C, Stahl EA, Freudenberg J, Lee HS, Jia X, Alfredsson L, Padyukov L, Klareskog L, Worthington J, Siminovitch KA, Bae SC, Plenge RM, Gregersen PK, de Bakker PI, Five amino acids in three HLA proteins explain most of the association between MHC and seropositive rheumatoid arthritis. Nat. Genet 44, 291–296 (2012). - PMC - PubMed
    1. Gregersen PK, Silver J, Winchester RJ, The shared epitope hypothesis. An approach to understanding the molecular genetics of susceptibility to rheumatoid arthritis. Arthritis Rheum 30, 1205–1213 (1987). - PubMed
    1. Firestein GS, McInnes IB, Immunopathogenesis of Rheumatoid Arthritis. Immunity 46, 183–196 (2017). - PMC - PubMed
    1. Smolen JS, Aletaha D, McInnes IB, Rheumatoid arthritis. Lancet 388, 2023–2038 (2016). - PubMed

Publication types