. 2022 Jun 15;14(649):eabl3981.
doi: 10.1126/scitranslmed.abl3981. Epub 2022 Jun 15.

The balance between protective and pathogenic immune responses to pneumonia in the neonatal lung is enforced by gut microbiota

Affiliations

The balance between protective and pathogenic immune responses to pneumonia in the neonatal lung is enforced by gut microbiota

Joseph Stevens et al. Sci Transl Med. .

Abstract

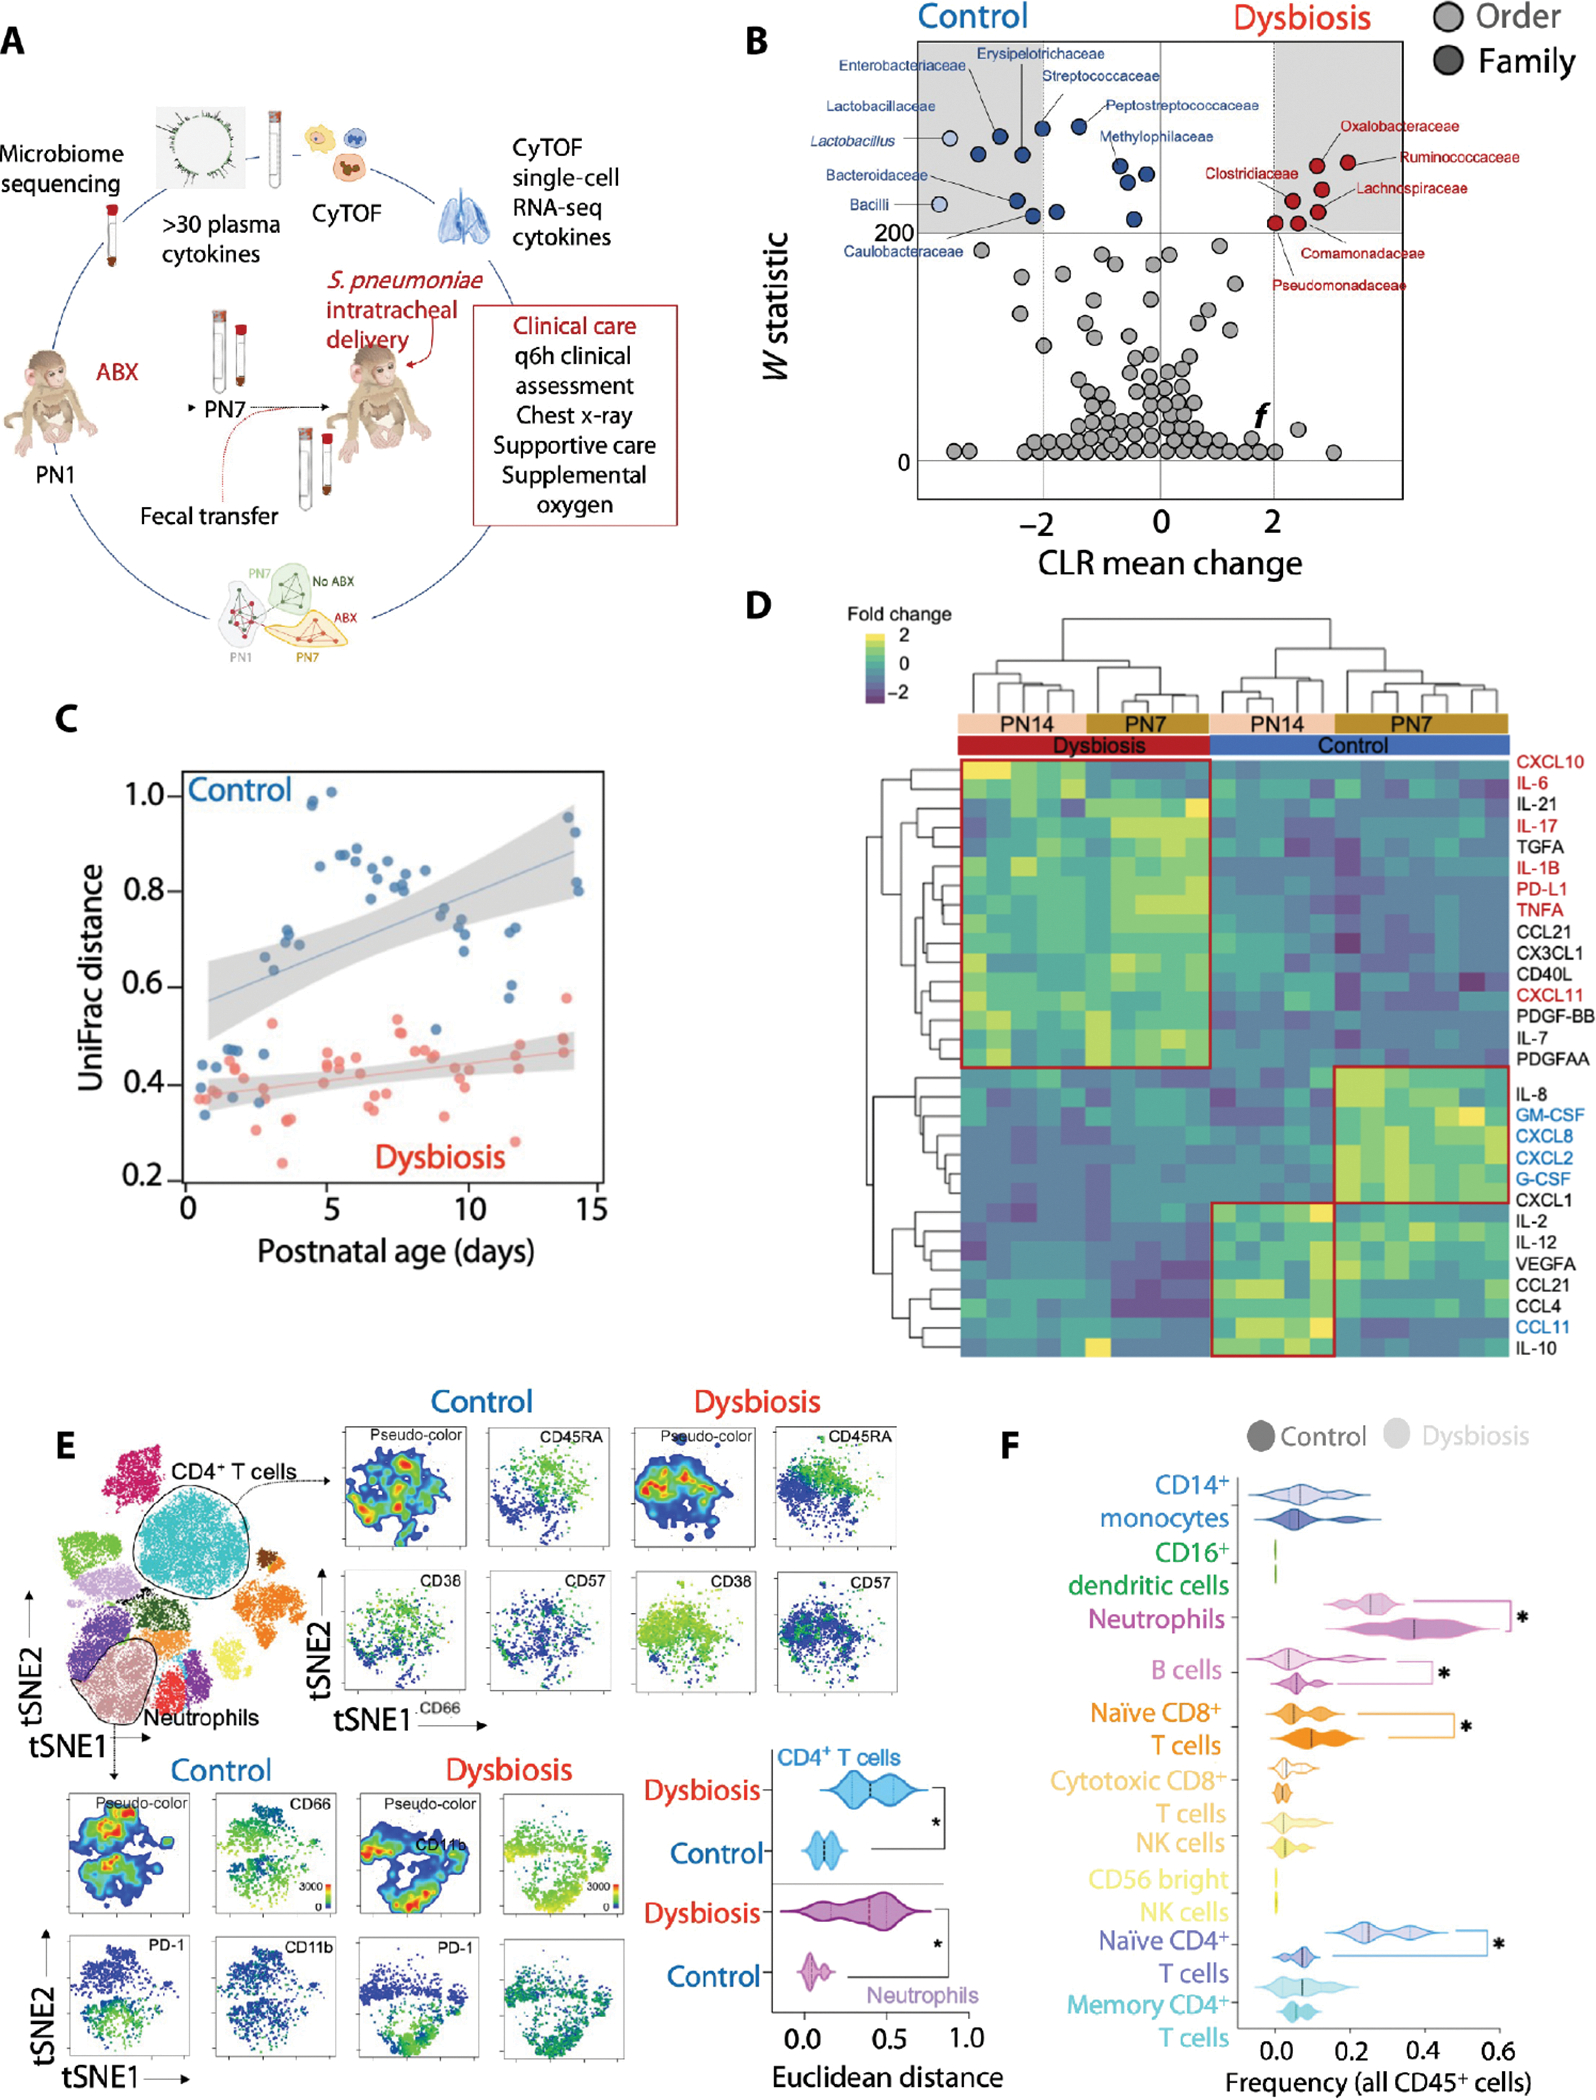
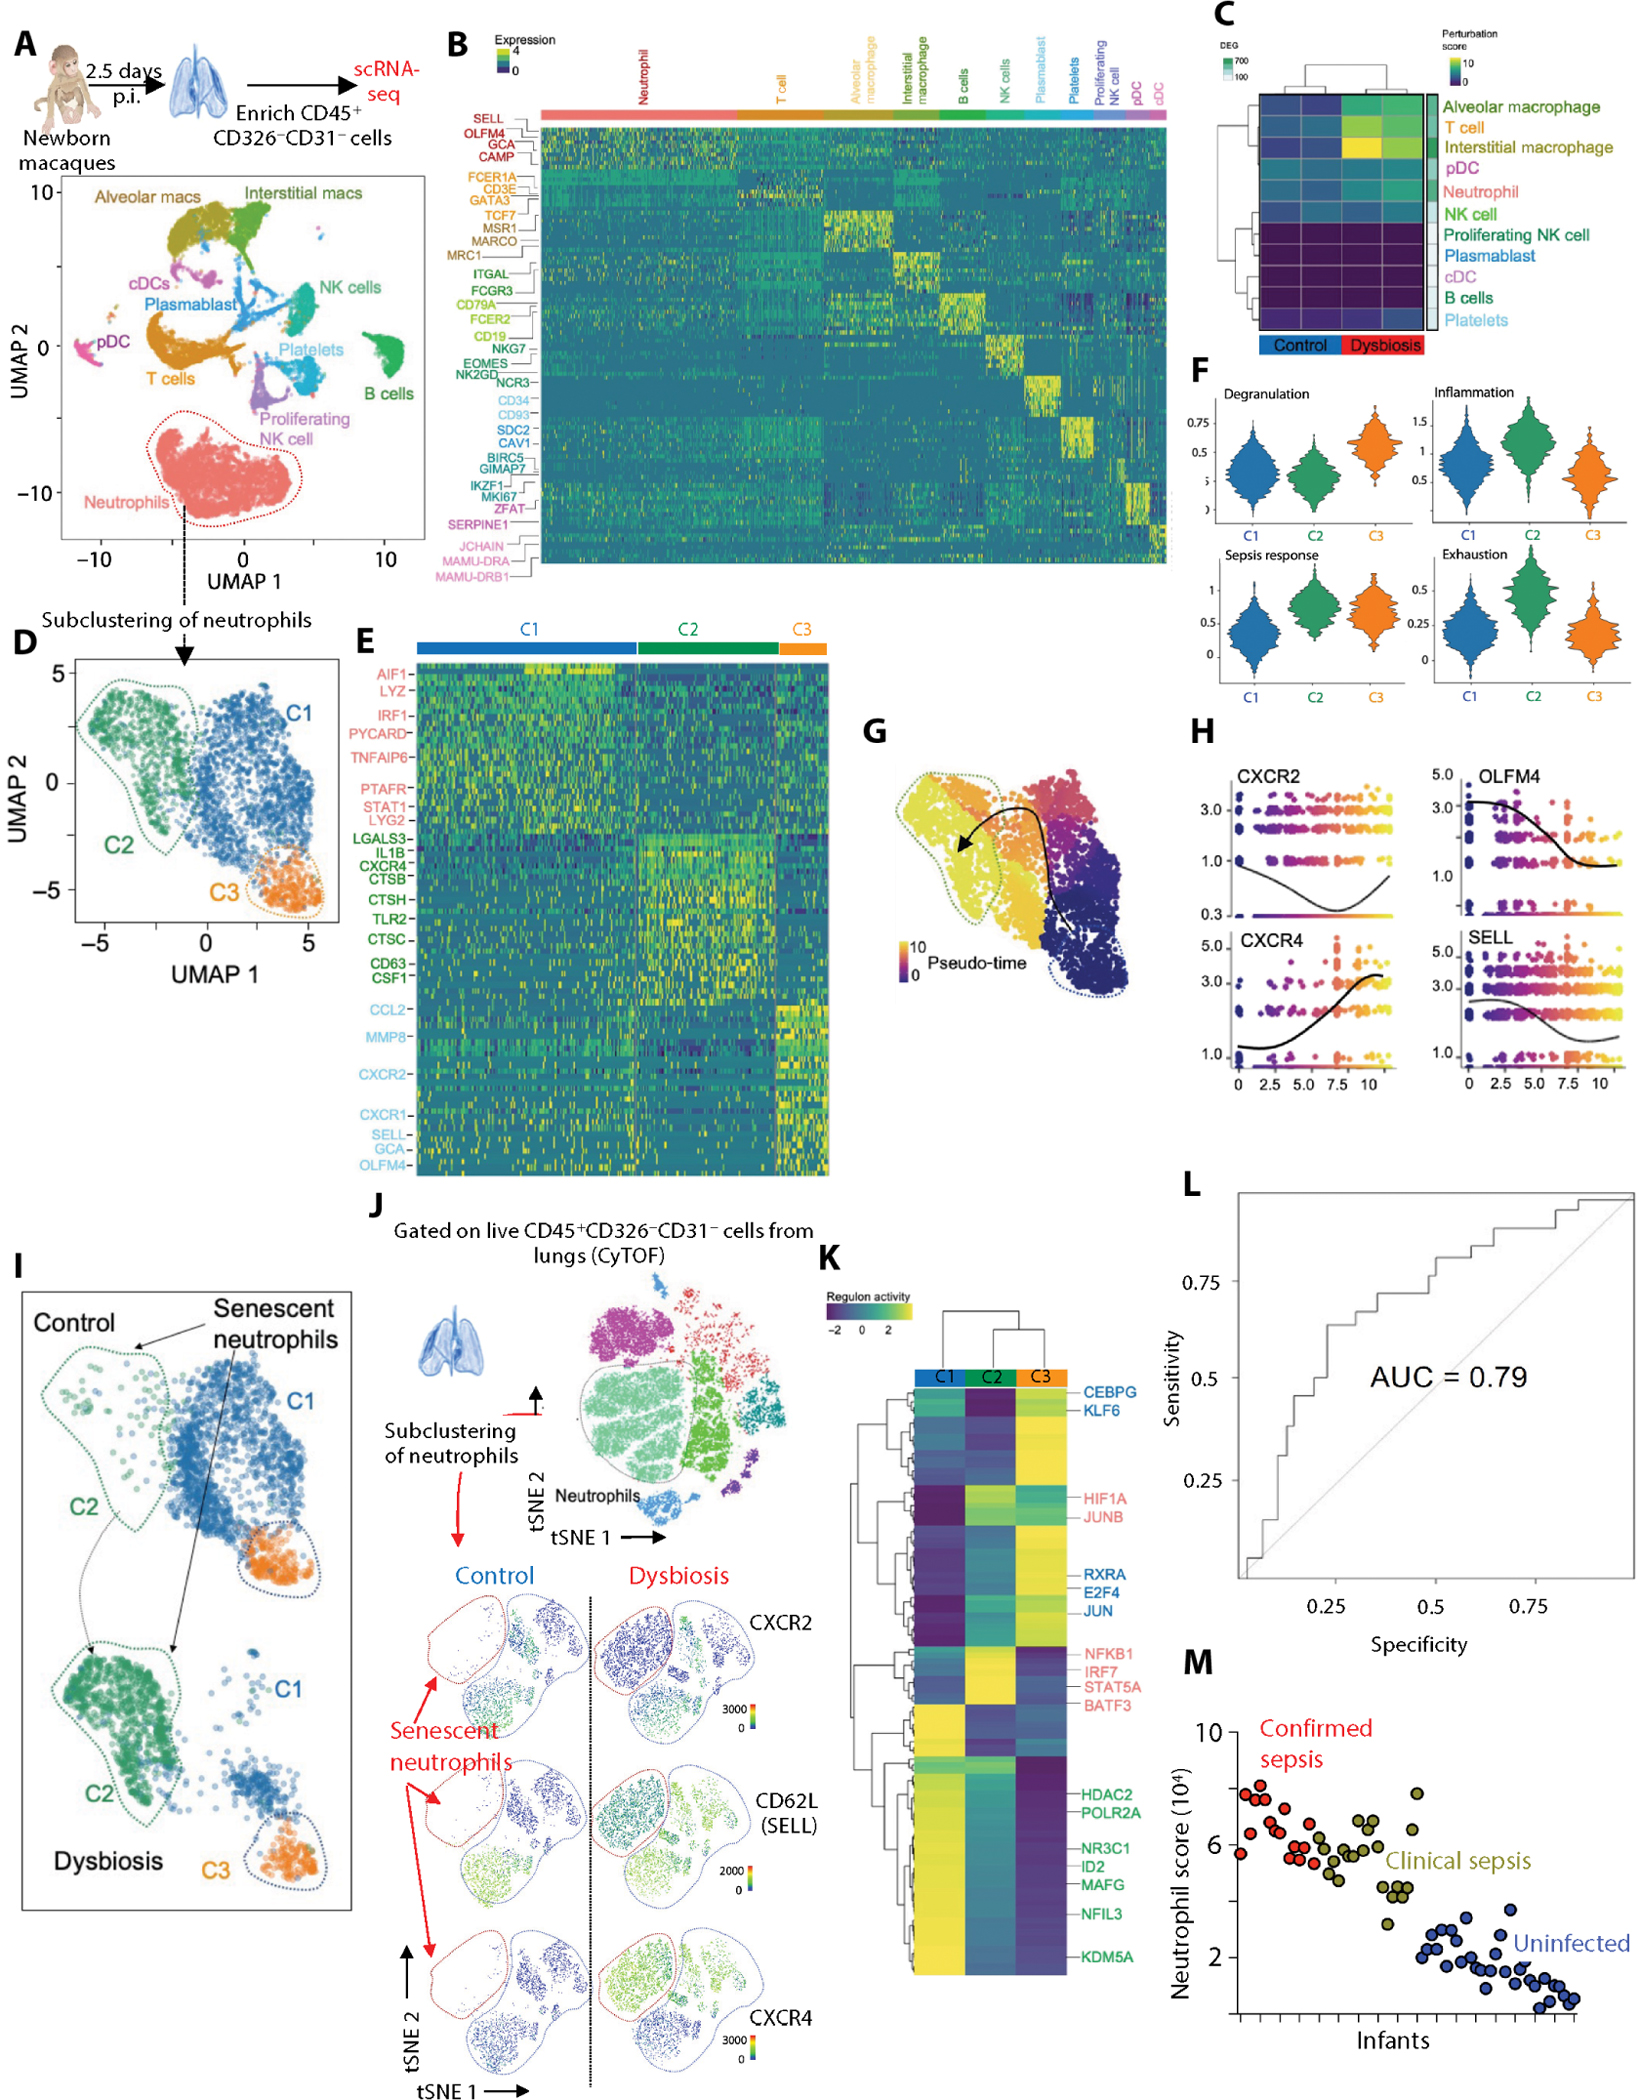
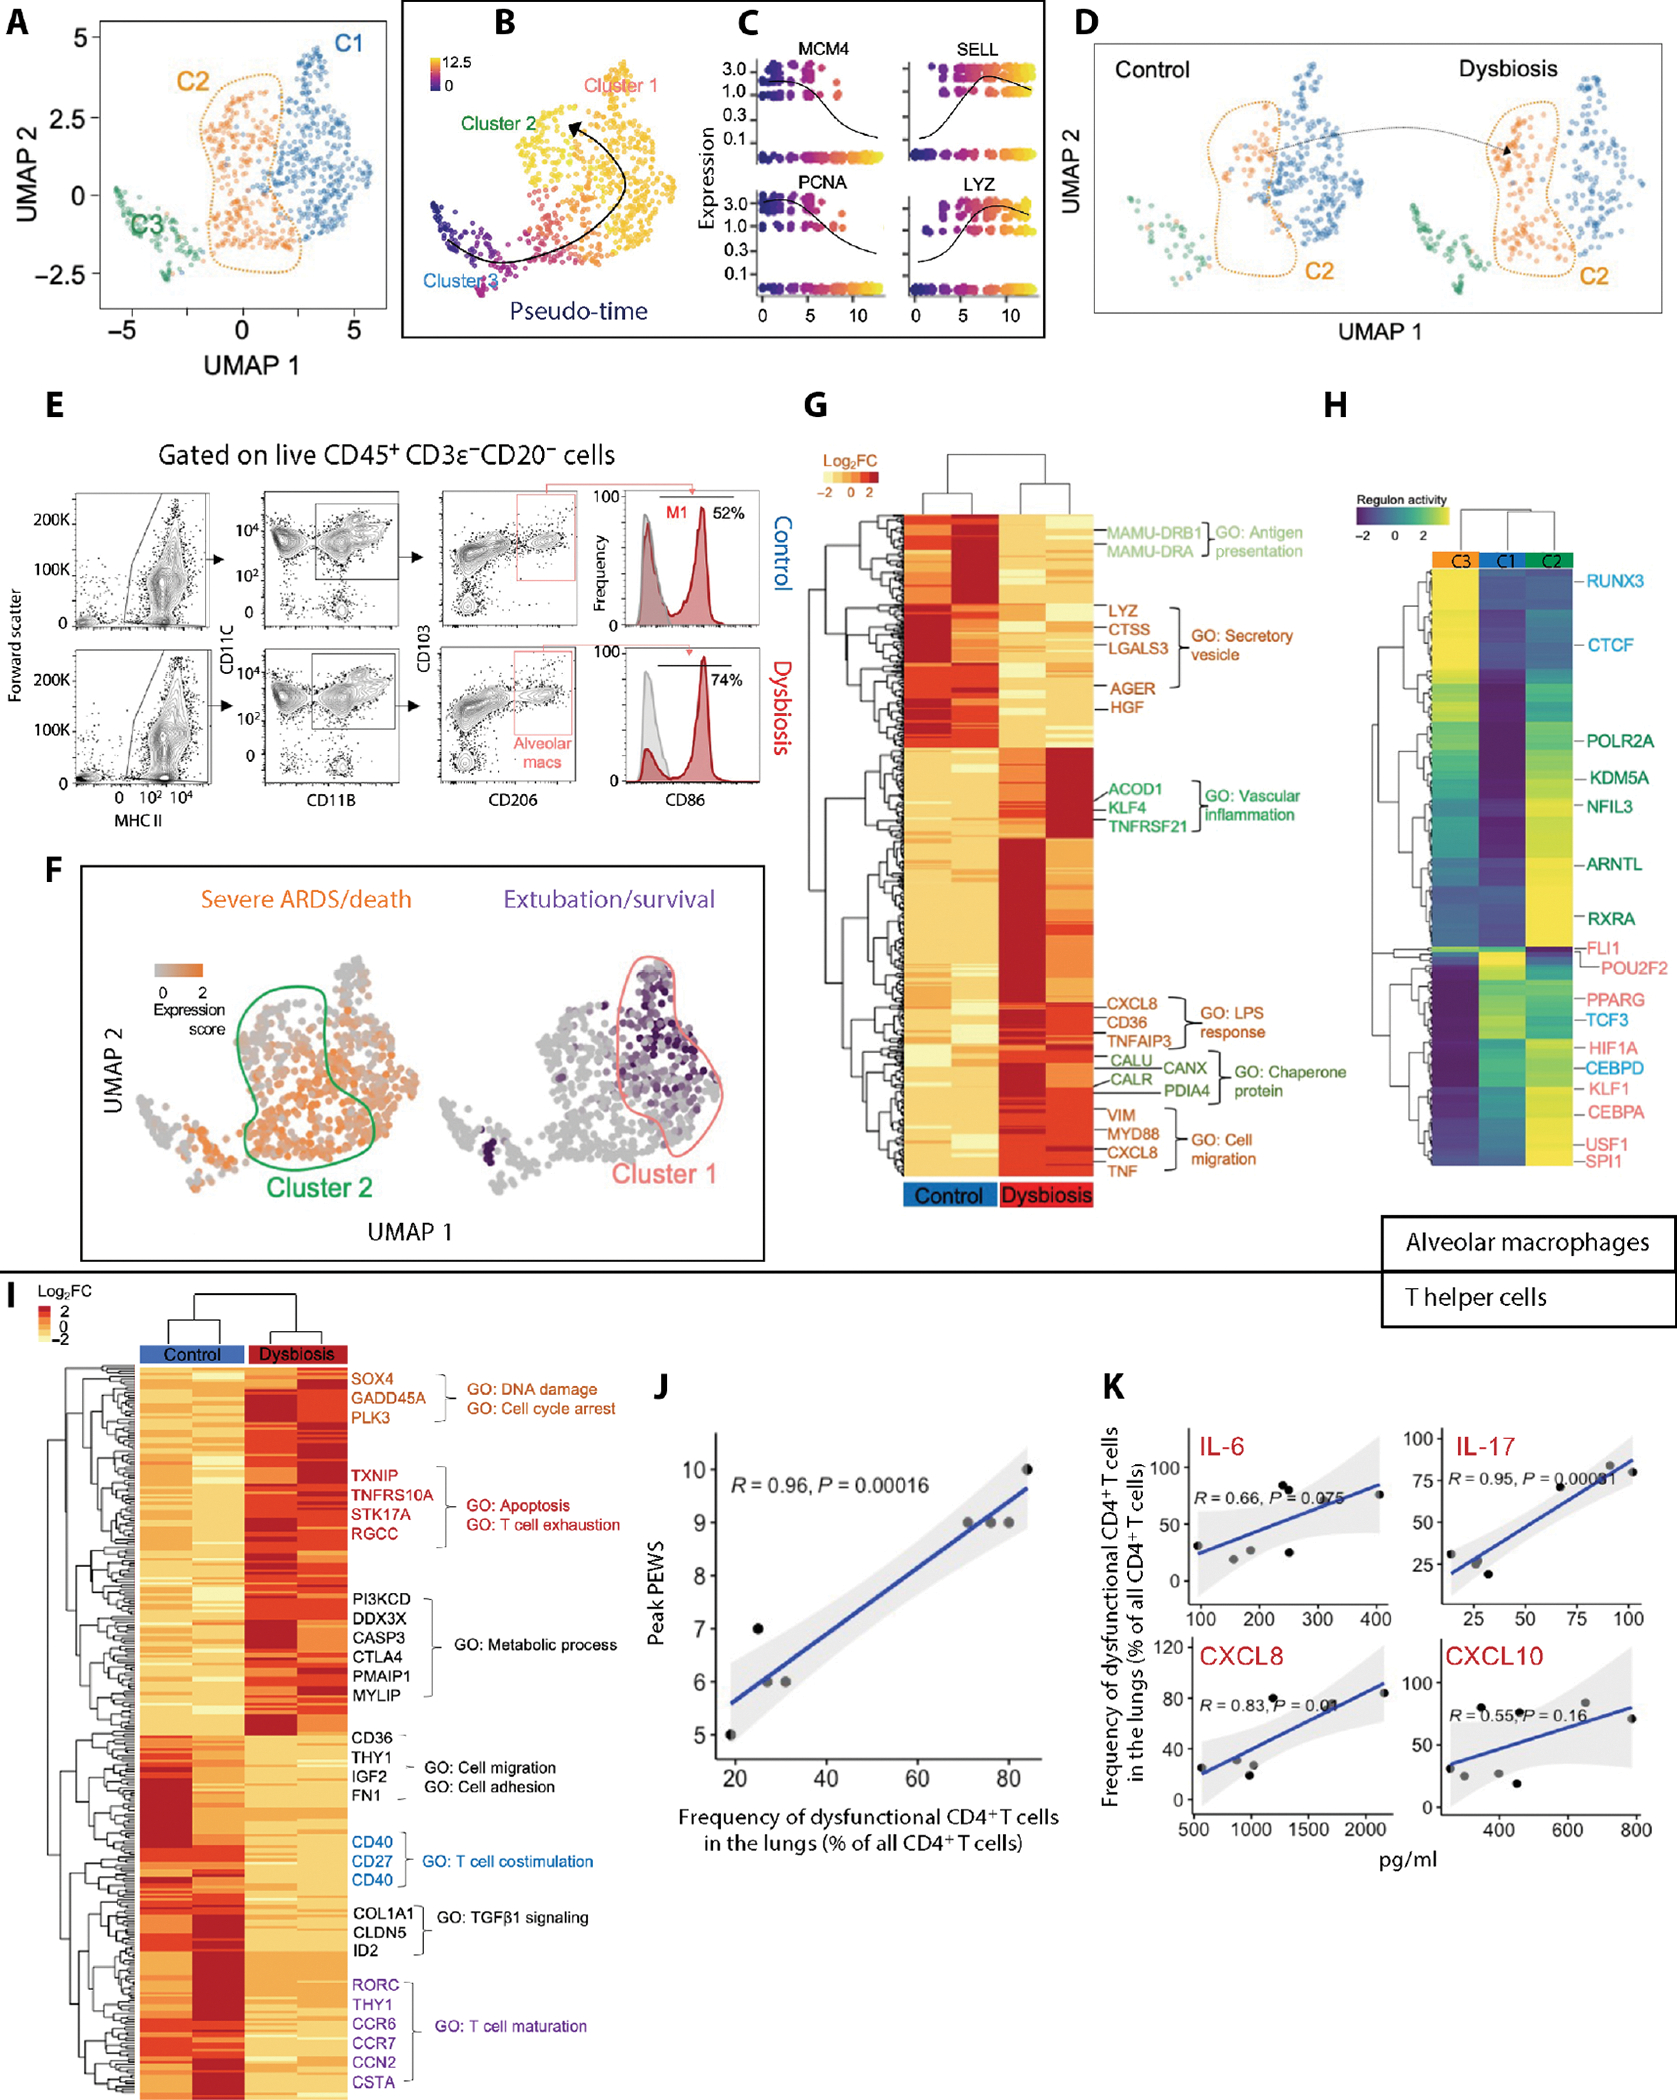
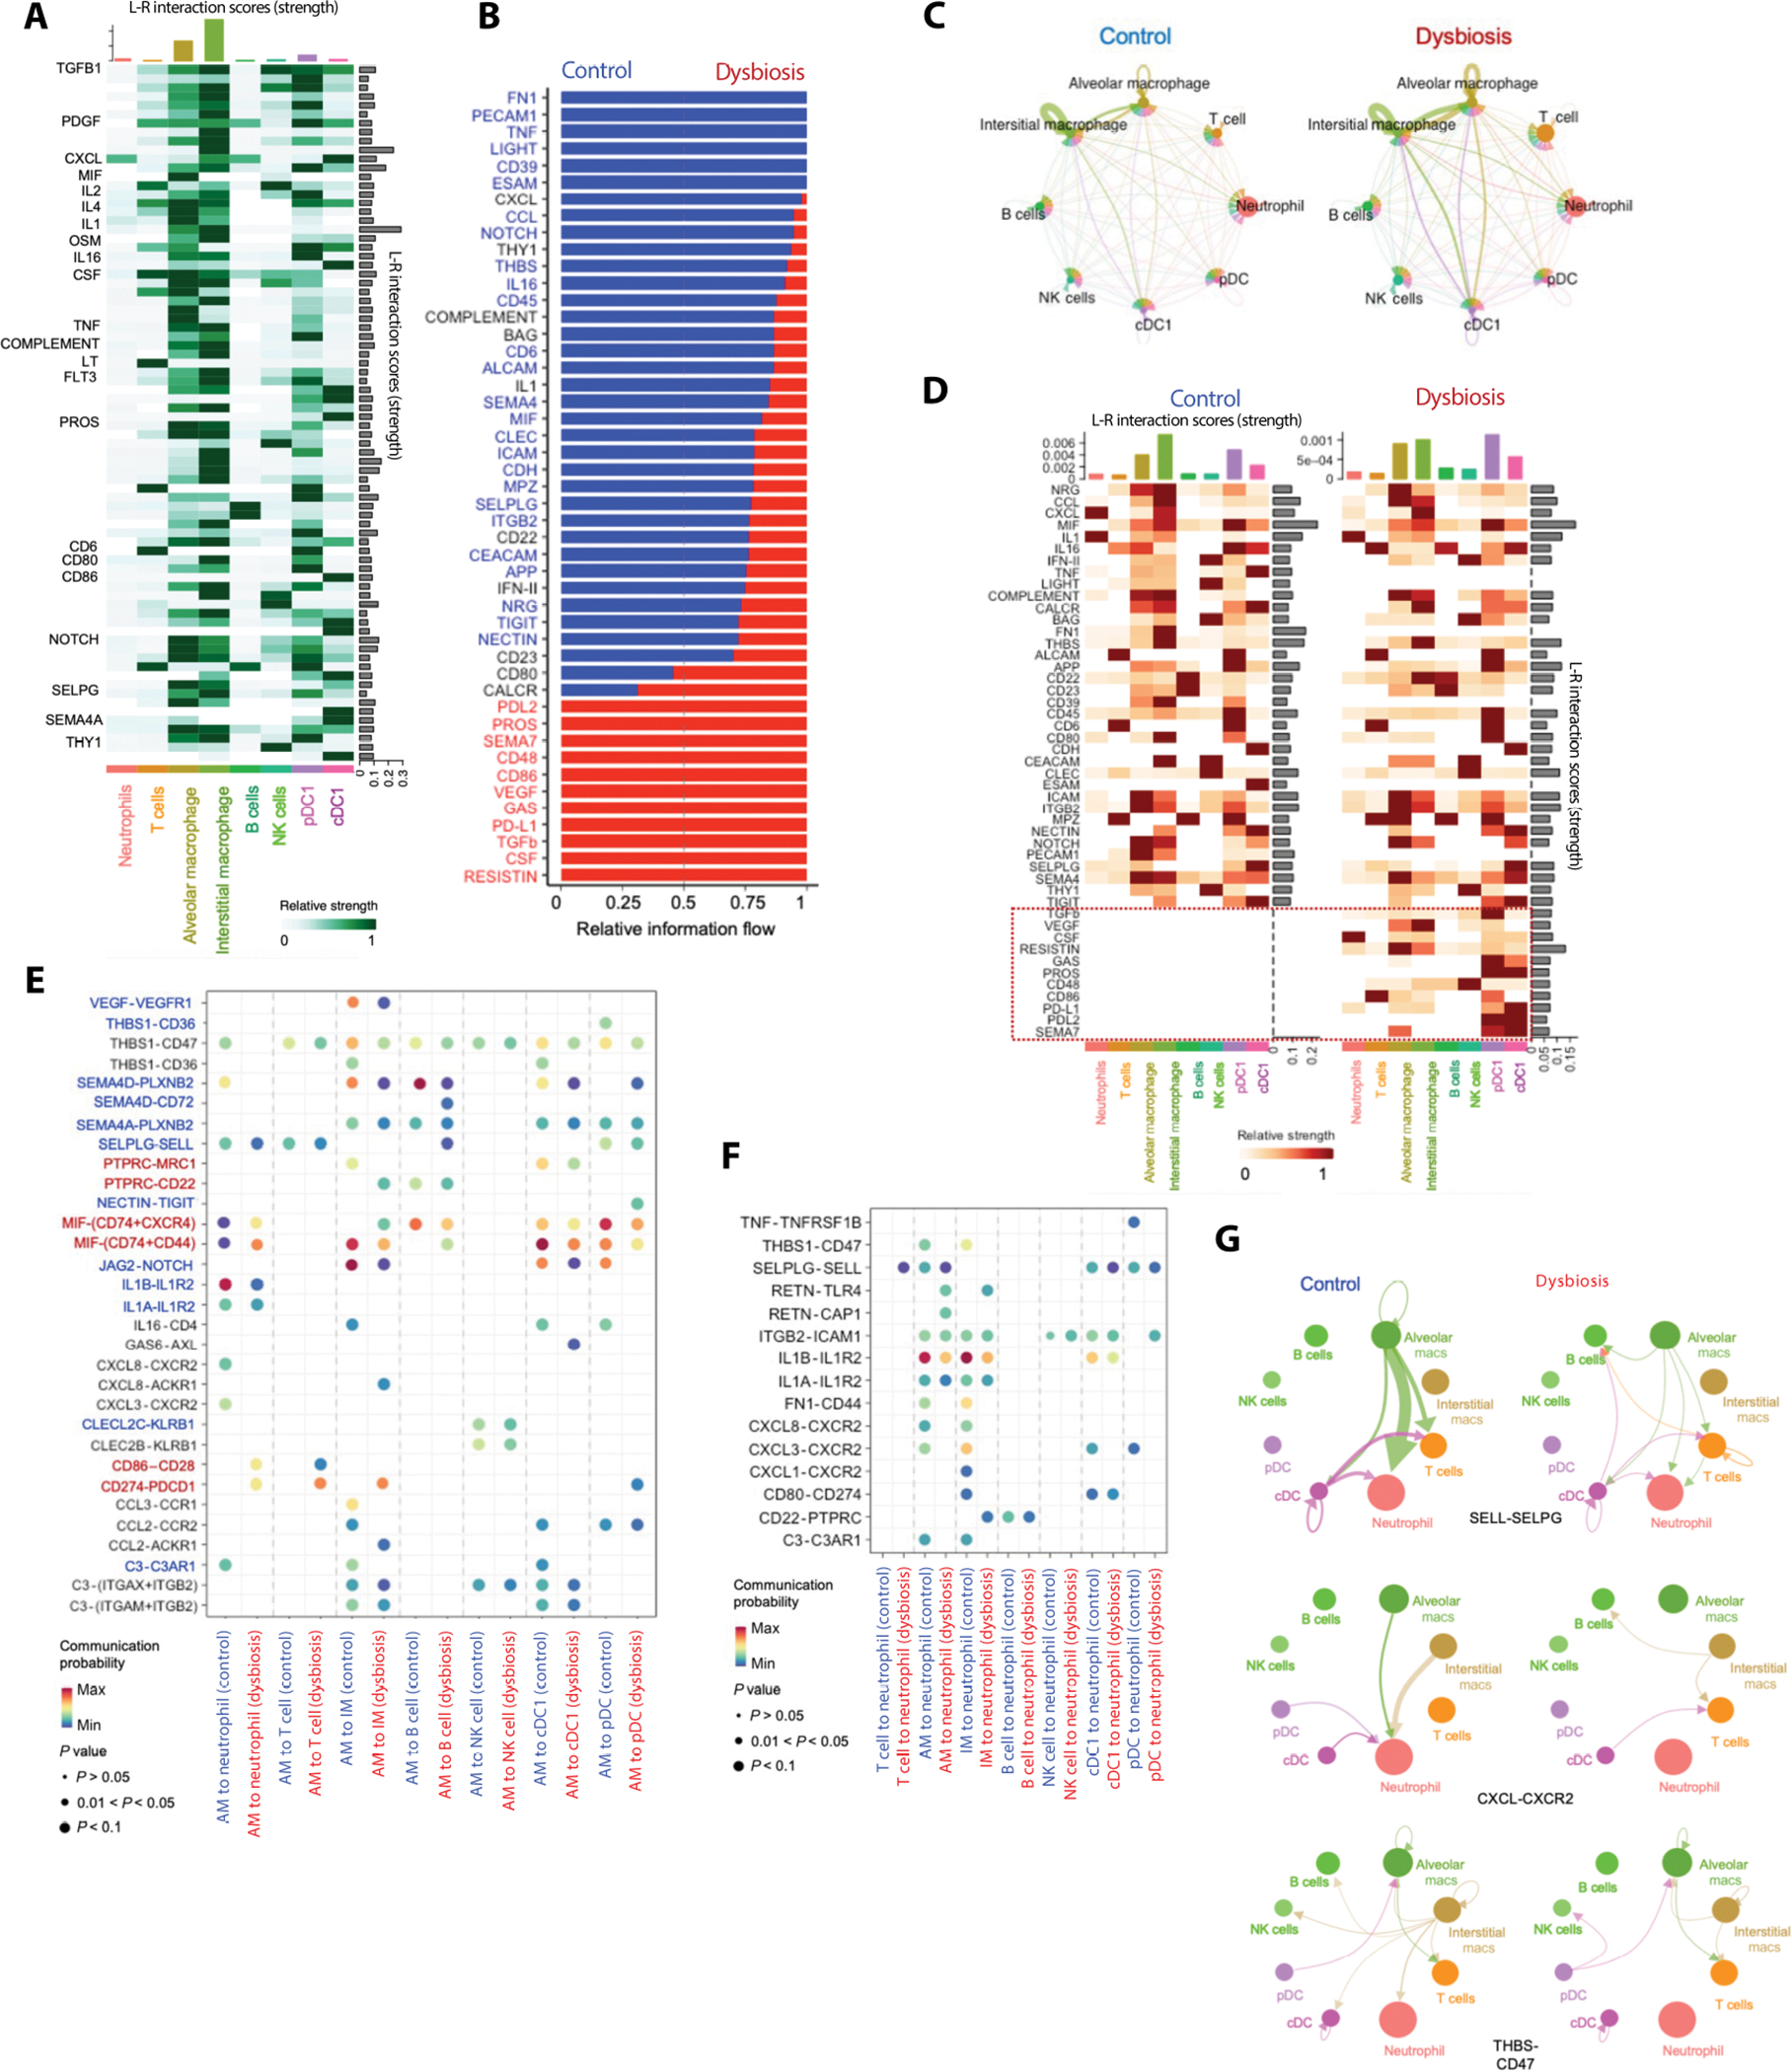
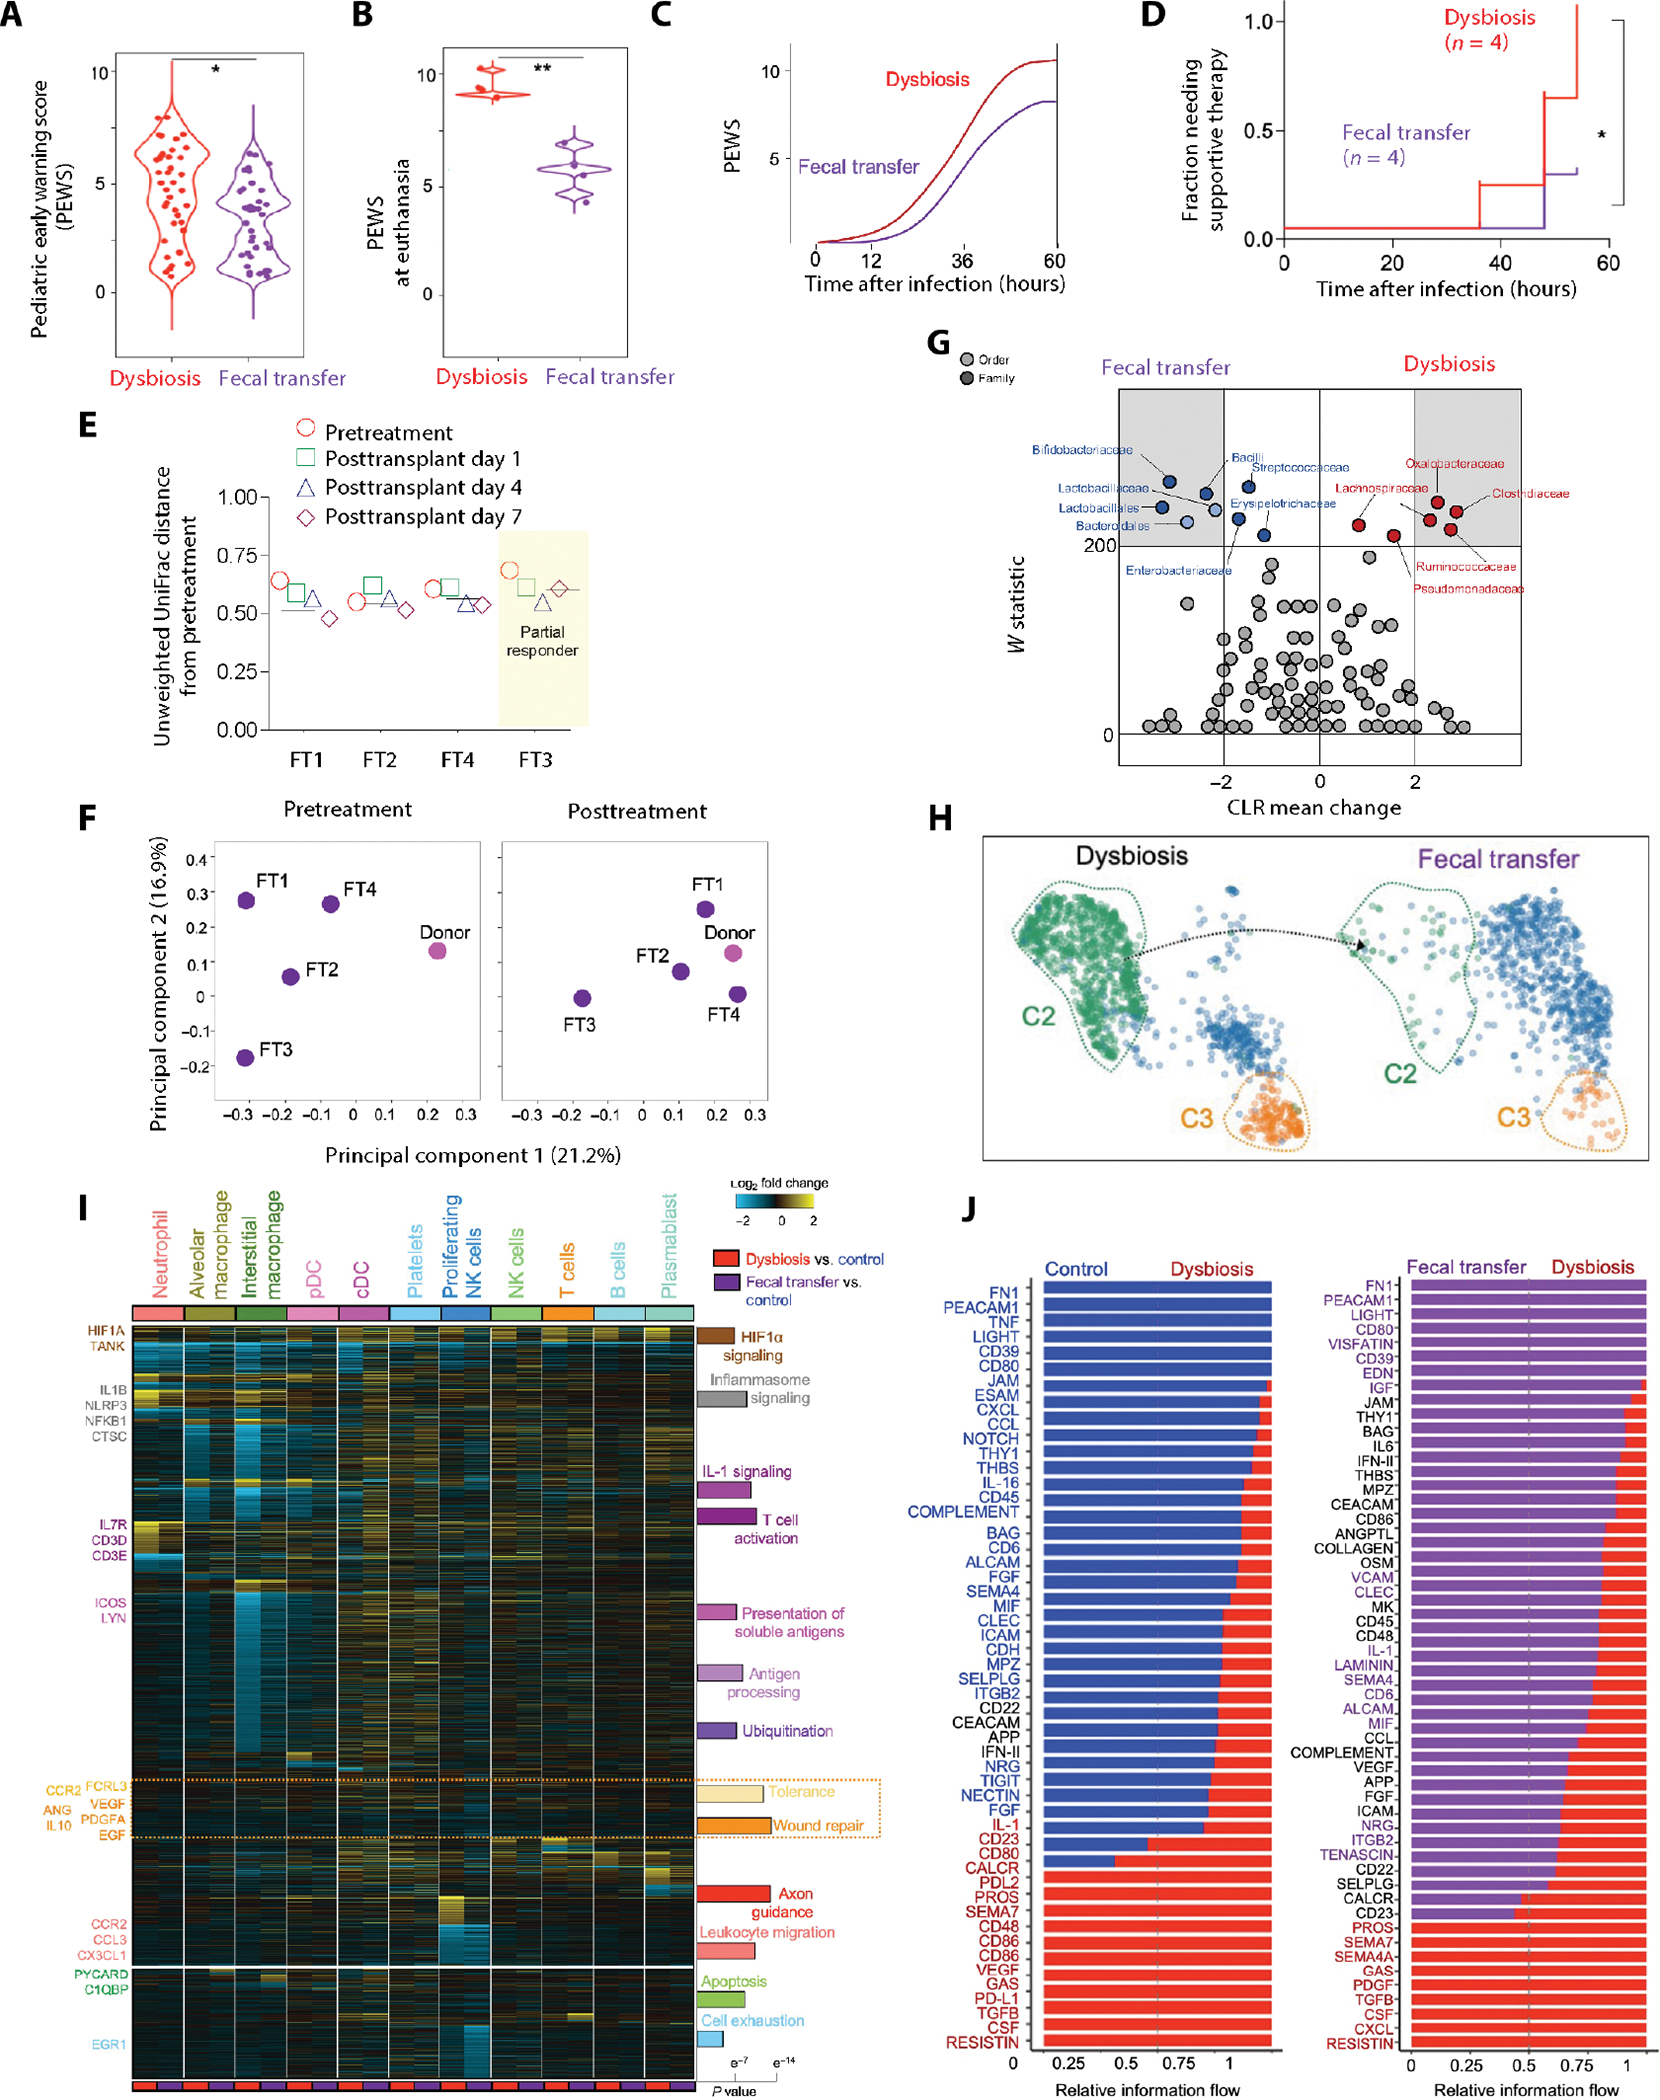
Although modern clinical practices such as cesarean sections and perinatal antibiotics have improved infant survival, treatment with broad-spectrum antibiotics alters intestinal microbiota and causes dysbiosis. Infants exposed to perinatal antibiotics have an increased likelihood of life-threatening infections, including pneumonia. Here, we investigated how the gut microbiota sculpt pulmonary immune responses, promoting recovery and resolution of infection in newborn rhesus macaques. Early-life antibiotic exposure interrupted the maturation of intestinal commensal bacteria and disrupted the developmental trajectory of the pulmonary immune system, as assessed by single-cell proteomic and transcriptomic analyses. Early-life antibiotic exposure rendered newborn macaques more susceptible to bacterial pneumonia, concurrent with increases in neutrophil senescence and hyperinflammation, broad inflammatory cytokine signaling, and macrophage dysfunction. This pathogenic reprogramming of pulmonary immunity was further reflected by a hyperinflammatory signature in all pulmonary immune cell subsets coupled with a global loss of tissue-protective, homeostatic pathways in the lungs of dysbiotic newborns. Fecal microbiota transfer was associated with partial correction of the broad immune maladaptations and protection against severe pneumonia. These data demonstrate the importance of intestinal microbiota in programming pulmonary immunity and support the idea that gut microbiota promote the balance between pathways driving tissue repair and inflammatory responses associated with clinical recovery from infection in infants. Our results highlight a potential role for microbial transfer for immune support in these at-risk infants.


Conflict of interest statement

Competing interests: The authors declare that they have no competing interests.

Figures

Fig. 1.
Fig. 1.. Antibiotic exposure during the first week of life is associated with delayed microbiota maturation and reconfiguration of the peripheral immune system.
(A) Cohort of vaginally delivered, nursery-raised rhesus macaques was treated with a cocktail of antimicrobials (ABX) from postnatal day 1 (PN1) to PN7 (dysbiosis) or with saline (control) (n = 4 in each experimental group). (B) Differentially abundant taxa [FDR q ≤ 0.05, center log transformation (CLR) > 2] between control and dysbiosis groups are presented in gray margins. The center log transformation mean difference represents compositional differences in microbial communities. (C) β-Diversity (unweighted UniFrac) of fecal bacterial communities at the indicated day of life in control and dysbiotic newborn macaques. Linear fit is shown, and margins represent 95% confidence limits. (D) Abundance of plasma proteins in control and dysbiotic newborn macaques at 7 or 14 days of life, normalized against all subjects and scaled by row. k-means clustering was used to arrange subjects and plasma protein abundance. (E) Unsupervised analysis of cytometry by time of flight (CyTOF) data for CD4+ helper T cells or neutrophils. t-SNE (t-distributed stochastic neighbor embedding) projection of indicated functional markers in CD4+ helper T cells (top) or neutrophils (bottom) in peripheral blood of control and dysbiotic newborn macaques at 7 days of life. Pairwise Euclidean distances between CD4+ helper T cells (top) or neutrophils (bottom) in peripheral blood of control and dysbiotic newborn macaques at 7 days of life (n = 8; four in each experimental group; *P < 0.05, Student’s t test). Solid lines, median; dotted lines, quartiles. (F) Frequencies of the indicated immune cell types in peripheral blood of control and dysbiotic newborn macaques at 7 days of life (n = 8; four in each experimental group; P < 0.05, one-way ANOVA with Tukey’s correction for multiple comparisons). Solid lines, median; dotted lines, quartiles.
Fig. 2.
Fig. 2.. Antibiotic exposure during the first week of life is associated with increased susceptibility to pneumonia.
(A) Pediatric early warning score (PEWS) after infection with Streptococcus pneumoniae in control (blue) or dysbiotic (red) newborn macaques. (B) Representative chest radiographs obtained at euthanasia in control and dysbiotic newborn macaques. Arrows indicate areas of consolidation. (C) Progression of PEWS after infection with S. pneumoniae in control (blue) or dysbiotic (red) newborn macaques. Lines represent the best-fit curve by the smoothed spline of the longitudinal distribution of PEWS from the start of infection. Broken lines represent time (after infection) to PEWS > 8, a predetermined threshold to initiate supportive therapy. (D) Kaplan-Meier plot of the fraction of control and dysbiotic newborn macaques requiring supportive therapy at indicated times after infection (n = 8; four in each experimental group; *P < 0.05, Mantel-Cox log-rank test).
Fig. 3.
Fig. 3.. Antibiotic exposure for the first week remodels the pulmonary immune transcriptome during response to respiratory pathogens.
(A) Lung from control and dysbiotic newborn macaques (n = 4; two in each group) was obtained at 60 hours after infection. p.i., post infection. Lung samples were dissociated into cell suspensions, enriched for immune cells (EPCAMCD31CD45+), and used for single-cell RNA sequencing (scRNA-seq). Uniform manifold approximation and projection (UMAP) embedding of all samples (n = 13,377 cells) colored by cell clusters was performed on scRNA-seq data of these pulmonary immune cells. pDC, plasmacytoid dendritic cells; cDC, classical dendritic cells. (B) Row-scaled expression of the highest differentially expressed genes (DEGs) in each cluster (Bonferroni-adjusted P < 0.05). pDC, plasmacytoid dendritic cells; cDC, classical dendritic cells. (C) Cellular perturbation scores in indicated samples. The number of DEGs between dysbiotic and control newborn macaques for each cell type is indicated on the right. (D) UMAP embedding of neutrophils (n = 4768) extracted from a larger dataset of lung immune cells and reclustered into three distinct clusters. (E) Row-scaled expression of the highest DEGs in each cluster (Bonferroni-adjusted P < 0.05). (F) Module scores for each cluster of neutrophils showing enrichment of genes related to degranulation, inflammation, sepsis, and exhaustion. (G) UMAP embedding of neutrophils colored by pseudo-time with overlaid trajectory and (H) scatterplots showing expression of selected cluster-defining genes across pseudo-time. (I) UMAP embedding of neutrophils colored by cluster in control and dysbiotic newborn macaques indicating the emergence of the senescent C2 cluster in dysbiotic newborns. (J) CyTOF. t-SNE embedding of neutrophils extracted from a larger dataset of lung immune cells (top). Expression of key phenotypic markers (CXCR2, CD62L, and CXCR4) is shown (bottom). Neutrophil cluster coexpressing CXCR4 and CD62L is absent in control newborn macaques. (K) Row-scaled regulon activity for neutrophil clusters. k-means clustering was used to arrange clusters and regulons (n = 4; two in each experimental group; Benjamini and Hochberg–adjusted P < 0.01). (L) Receiver operating characteristic curve depicting sensitivity and specificity of sepsis diagnosis using the gene signature of senescent, hyperinflammatory neutrophils (HIF1A, CXCR4, CD274, LTF, and S100A8) in an independent cohort of 69 at-risk infants. AUC, area under the curve. (M) Scatterplot representing the ranked senescent neutrophil signature score (aggregated expression of HIF1A, CXCR4, CD274, LTF, and S100A8; see Materials and Methods) for each infant sample in bulk transcriptomic dataset (see Materials and Methods), colored by clinical diagnosis.
Fig. 4.
Fig. 4.. Antibiotic exposure during the first week remodels the pulmonary macrophages and helper T cell compartments.
(A) UMAP embedding of AMs extracted from a larger dataset of lung immune cells colored by clusters. (B) UMAP embedding of AMs colored by pseudo-time with overlaid trajectory and (C) scatterplots showing expression of selected cluster-defining genes across pseudo-time. (D) UMAP embedding of AMs split by control and dysbiotic macaques showing an emergence of a unique dysbiotic cluster (cluster 2). (E) Flow cytometry. Bivariate contour plots showing gating strategy to identify macrophage subsets and histograms showing coexpression of activation markers, CD86 and CD206, on AMs from control (top) and dysbiotic (bottom) newborn macaques. Numbers indicate the relative frequencies of M1-activated macrophage subset (n = 8; four in each experimental group). (F) UMAP embedding of AMs colored by average expression of genes associated with severe ARDS/death (orange) and survival/extubation (purple). These gene signatures were derived from public gene expression datasets from monocytes in pediatric bacterial sepsis subjects (see Materials and Methods). (G) Row-scaled expression of DEGs in AMs from control and dysbiotic newborn macaques (n = 4; two in each experimental group), normalized against all subjects. k-means clustering was used to arrange subjects and transcripts (n = 4; two in each experimental group; Benjamini and Hochberg–adjusted P < 0.01, log2 fold change (FC) > 2, Wald’s test]. GO, Gene Ontology. (H) Row-scaled regulon activity for AM clusters. k-means clustering was used to arrange clusters and regulons (n = 4; two in each experimental group; Benjamini and Hochberg–adjusted P < 0.01). (I) Row-scaled expression of DEGs in the pulmonary T cells from control and dysbiotic newborn macaques (n = 4; two in each experimental group), normalized against all subjects. k-means clustering was used to arrange subjects and transcripts (n = 4; two in each experimental group; Benjamini and Hochberg–adjusted P < 0.01, log2 fold change > 2, Wald’s test). (J) Pearson correlation between peak PEWS and the frequency of dysfunctional (LAG-3+) CD4+ T cells (percentage of all CD4+ T cells from lungs). Correlation coefficient (R) and significance with the associated P value is indicated. (K) Pearson correlation between indicated cytokines from bronchial washings (pg/ml) and the frequency of dysfunctional CD4+ T cells (% of all CD4+ T cells from lungs). Correlation coefficient (R2) and significance with the associated P value is indicated.
Fig. 5.
Fig. 5.. Changes in communication circuits between neutrophils and macrophages underlie a dysfunctional remodeling of the pulmonary myeloid compartment.
(A) Cellcell communication network between different pulmonary immune cells. Bar graphs at the top indicate ligand-receptor interaction scores (strength) for each indicated cell type. Bar graphs on the right show the ligand-receptor interaction scores (strength) of each ligand-receptor interaction. The network is dominated by pathways related to inflammation, chemotaxis, and tissue repair, as indicated by selected signal transcripts (on the left). (B) Cell-cell communication pathways ranked by overall information flow in control or dysbiotic newborn macaques. Cell-cell communications enriched in control exposed newborn macaques (in blue text) are dominated by pathways related to tissue homeostasis. Pathways related to chemotaxis (in black text) are equally enriched in control or dysbiotic newborn macaques. Cell-cell communications increased in dysbiotic newborn macaques (in red text) are dominated by pathways related to inflammation. (C) Circle plot showing differential number of interactions in the cellcell communication network between control (left) and dysbiotic (right) newborn macaques. Macrophages and dendritic cells are the hubs (senders), whereas neutrophils and T cells are targets (receivers) of cell-cell communication networks. (D) Communication pathways related to cell exhaustion and cell activation (boxed) are abundant in dysbiotic compared to control macaques. Bar graphs at the top indicate ligand-receptor interaction scores (strength) for each indicated cell type. Bar graphs on the right show the ligand-receptor interaction scores (strength) of each ligand-receptor interaction. (E) Dot plot of outgoing signaling patterns from AM (sender) to other immune cells in control (blue) or dysbiotic macaques (red). Dot color reflects communication probabilities and dot size represents computed P values. Empty space means that the communication probability is zero (P values calculated from one-sided permutation test). (F) Dot plot of incoming signaling patterns to neutrophils (receiver) from other immune cells in control (blue) or dysbiotic macaques (red) (P values computed from one-sided permutation test). (G) Autocrine and paracrine signaling pathways related to neutrophil migration (CXCL-CXCR2 and THBS1-CD47) and neutrophil activation (SELPLG-SELL) in control or dysbiotic macaques. Circle sizes are proportional to the number of cells in each cell group, and edge width represents the strength of cell-cell communication.
Fig. 6.
Fig. 6.. Fecal transfer was associated with favorable changes in pulmonary immune cell responses and improved host resistance to pneumonia in dysbiotic macaques.
(A) ABX-exposed (dysbiosis) or fecal transfer (FT) recipient newborn macaques were challenged with S. pneumoniae (serotype 19F) on PN14. PEWS was determined every 6 hours (n = 8; four in each experimental group; the P value is indicated, Student’s t test). (B) PEWS at euthanasia (n = 8; four in each experimental group; the P value is indicated, Student’s t test). (C) Progression of PEWS after infection in dysbiotic or FT recipient newborn macaques. Broken lines (C) represent time (after infection) to PEWS > 8, a predetermined threshold to initiate supportive therapy. (D) Kaplan-Meier plot of the fraction of dysbiotic or FT recipient newborn macaques requiring supportive therapy at indicated times after infection (n = 8; four in each experimental group; *P < 0.05, Mantel-Cox log-rank test). (E) Plot of unweighted UniFrac distances for each FT recipient from the corresponding pretreatment sample at 1, 4, or 7 days after transfer. 0 represents identical microbiota compositions, and 1 represents completely dissimilar compositions. The horizontal line represents the average posttreatment distance. (F) Principal component analysis (PCA) of fecal bacterial communities of the donor (pink) and the recipients (purple) before (pretreatment) or 7 days after FT (posttreatment), based on β-diversity (unweighted UniFrac). The distance between samples on the plot represents their dissimilarity. (G) Relative abundance of specific taxa in the recipients before (pretreatment) or 7 days after FT (posttreatment). Differentially abundant taxa (FDR q ≤ 0.05, center log transformation > 2) are presented in gray margins. The center log transformation mean difference represents compositional differences in microbial communities. (H) UMAP embedding of pulmonary neutrophils colored by cluster in dysbiotic and FT recipient newborn macaques, showing the reappearance of cluster 1. (I) Heatmap of DEGs in all pairwise cell type comparisons (fold > 1.2 and eBayes t test P < 0.05, FDR corrected) in dysbiosis or FT versus control (cellHarmony). Bar plot denotes the Fisher’s exact P values (FDR corrected) of GO terms adjacent to the enriched cellHarmony DEG cluster. (J) Cell-cell communication pathways ranked by overall information flow in dysbiotic (red text) or FT recipient newborn macaques (purple text). Miscommunication in pathways related to inflammation, immune costimulation, and cell exhaustion is reversed in FT recipient newborn macaques. Cell-cell communication associated with tissue repair and cell migration remains uncorrected after FT.

Similar articles

Cited by

References

    1. Dowling DJ, Levy O, Ontogeny of early life immunity. Trends Immunol. 35, 299–310 (2014). - PMC - PubMed
    1. Liu L, Oza S, Hogan D, Chu Y, Perin J, Zhu J, Lawn JE, Cousens S, Mathers C, Black RE, Global, regional, and national causes of under-5 mortality in 2000–15: An updated systematic analysis with implications for the Sustainable Development Goals. Lancet 388, 3027–3035 (2016). - PMC - PubMed
    1. MacGillivray DM, Kollmann TR, The role of environmental factors in modulating immune responses in early life. Front. Immunol. 5, 434 (2014). - PMC - PubMed
    1. Cash HL, Whitham CV, Behrendt CL, Hooper LV, Symbiotic bacteria direct expression of an intestinal bactericidal lectin. Science 313, 1126–1130 (2006). - PMC - PubMed
    1. Elinav E, Strowig T, Henao-Mejia J, Flavell RA, Regulation of the antimicrobial response by NLR proteins. Immunity 34, 665–679 (2011). - PubMed

Publication types

Substances